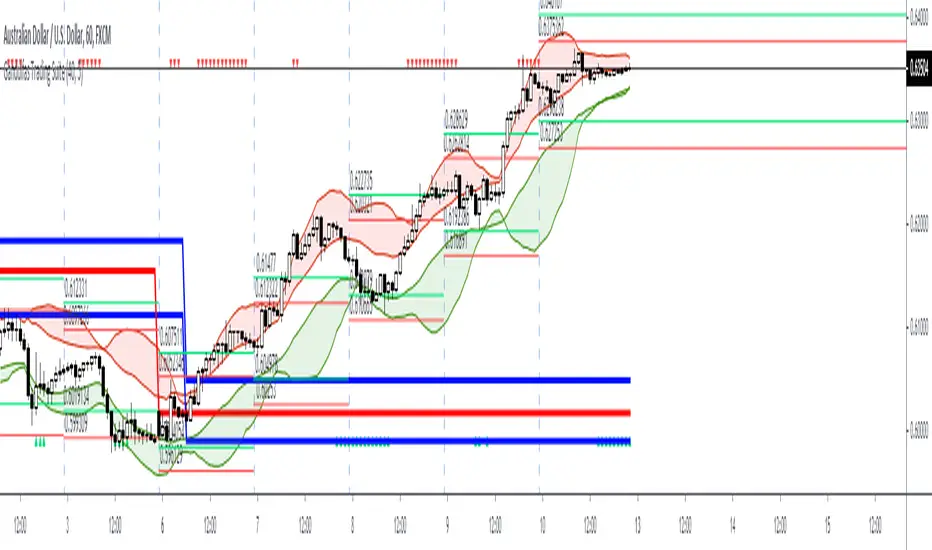
Gandulfas Trading SuiteAn indicator designed to quickly and easily enter you trades, with all the information you need in just one chart!
It uses a combination of :
Price action to have a Weekly BIAS
Volatility channels to track dynamic points of support/resistance
A momentum indicator on the background to point out when the pair is in "overbought/oversold" status - adds confluence to our entries.
Volatility pivots based on the Average Daily Range, to quickly manage your entries and stop losses - more confluence!
How to use this system?
First, we use the price action lines to define a weekly bias. If the price moves above this anchor, then we are looking for buying oportunities on retracements. If the price moves below this anchor, then we look for seling oportunities on retracements.
Now that we have a Weekly BIAS, we know that for this week we are currently looking for buying oportunities. Then, we can use the Volatility Channel to look for buying oportunities. Optimal entries are found within the channels and clouds!.
We should always look for a confluence of factors before entering any trade , and for that we decided to also add to the system a momentum indicator . This also can act as an early warning, telling us a that a potential setup is coming our way.
Does it repaint? No. The system is designed this way to reduce confirmation bias and keep your emotions at bay. For example, if you see the momentum indicator , maybe it is close to your threshold but it did not crossed over or crossed under it. Maybe it's 35, when your threshold is 25. It is low indeed , but it has not crossed it. Fact is this will get you emotional, and perhaps make you trigger a trade before you should.
So for this reason we decided to add the momentum indicator just showing the triangles when indeed the threshold has been crossed, so you don't get emotional trying to enter a trade too early. For this reason, you should always wait to the candle to close, to see if indeed we have crossed that threshold.
And then we have our volatility pivots , that help us to define better entries, targets and stop losses. They are based on the Average Daily Range, and it's use is pretty much straigthforward. The notion of this system is to take entries in the weekly direction. So, what we are really trying to achieve here is to get a chunk of that weekly expansion . The fastest the better, as having a positions means having exposure to the market. To achieve this objective the daily range helps us a lot.
If we are looking for a bullish day, that means we are looking for an good expansion of the Open-High range. So the daily range helps us to see how many pips this range could be on any given day. Then we apply a correction factor , because we do not want to estimate the whole range, we are good to go if we could anticipate just a 60% of it, let's say.
And it also helps us to define our stop loss places, because the range also tell us when it is most probable that our trading idea was wrong. Because if we are looking for a bullish day, we expect a good expansion on the open-high, not on the open-low!. So it also makes sense to take a look on the level that makes our idea most probably wrong!.
Here you can see how these pivots helps us to add extra confluence to our trading idea.
Our best trades are then performed....
Wednesday on the chart is the perfect example of the best type of trade you could perform. You have price entering the volatility channel, with the momentum indicator in our oversold zone, and price just a bit above our ADR pivots!.
Where should you put your targets?
You can use the volatility channel, and or also the pivots as we just described!
Where should you put your stop loss?
Below the volatility channel, taking into account where the pivots are. Because remember, if price trades below those, it most likely means that your idea was wrong, and you should not keep the trade open.
If you want to test or use this trading system on a regular basis, please get in touch with us through the private chat!
חפש סקריפטים עבור "weekly"
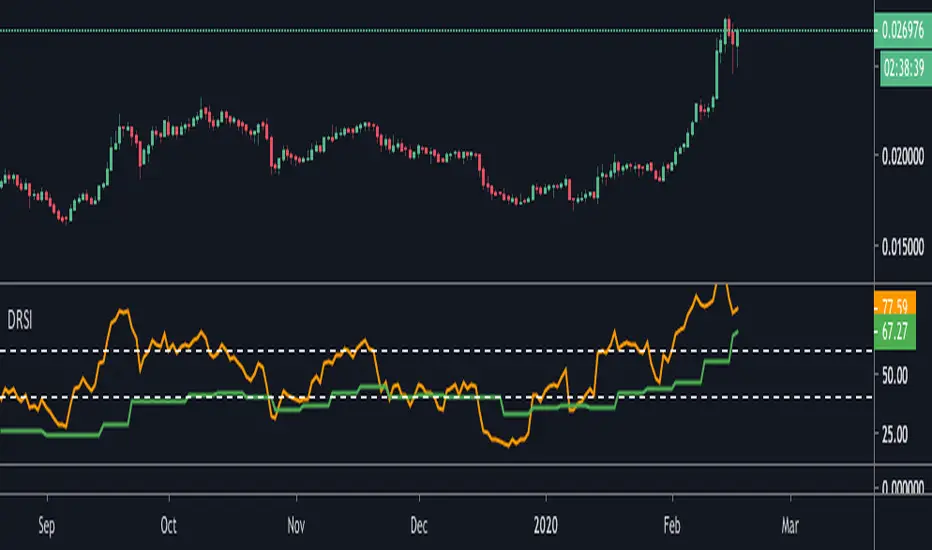
Double RSIThis is double RSI script which plots one time frame higher RSI along with the current time frame i.e
For Weekly chart it display Weekly and Monthly RSI
For Daily chart it display Daily and Weekly RSI
For Intraday chart it display Intraday and Daily RSI.
Usage:
If Daily RSI is above 60 and weekly above 40 and moving up then stock is in a good uptrend look for buying when Daily takes support at 60. Usually First test of Daily produces a good entry for subsequent entries probability decreases.
For Downtrend look for Daily RSI below 40 and weekly below 60.
CPR and Camarilla PivotsThis script has CPR ranges for (Daily, Weekly, Monthly) and Major pivot levels for daily (R/S 3,4,5) weekly (R/S 3,4). It also has prev day H/L and weekly H/L.
- Daily CPR (Black dotted lines)
- Weekly CPR (Blue dotted lines)
- Monthly CPR (Fushcia dotted lines)
- Prev Day H/L (Orange dotted lines)
- Weekly H/L (maroon dotted lines)
- Daily pivots R/S 3,4,5 (black cross lines)
- Weekly pivots R/S 3,4 (blue cross lines)

TradewithPuneet: Pro-PatternsThe Pro-Patterns strategy is designed to trade classic chart patterns. At present, it identifies the Ascending Triangle patterns and Weekly Inside Bars patterns and takes Long or Short entries, as the case may be.
Ascending Triangle patterns:
- The strategy identifies ascending triangle patterns ranging from 40 to 120 days.
- BUY signals are generated on the breakout of the horizontal resistance line. No SHORT signal is generated on the breakdown of the rising trend line.
- The importance is given to higher lows, instead of attempting to make a perfectly straight rising trend line. Hence, the drawing of the rising trend line is skipped.
- The strategy gives BUY signals on continuation as well as reversal patterns.
- Users can choose exit rules either on the breakdown of a certain number of days or based on ATR.
- The Ascending triangle patterns can be seen on Daily timeframes only.
Weekly Inside Bars
- The strategy identifies inside bars on weekly charts with three candles. This means, that Weekly Inside Bars pattern is said to be formed when the current week's candle is inside the previous week and the previous week's candle is inside the week prior to it.
- A BUY or SHORT signal is generated next week on breakout or breakdown of high or low of third week’s candle.
- The importance is given to a decrease in volume on second & third weeks’ candles.
- The strategy gives BUY or SHORT signals on continuation as well as reversal patterns. However, users can choose to see trading signals on continuation patterns only.
- Users can choose exit rule on breakdown or breakout of a certain number of weeks in case of BUY & SHORT signals respectively.
- The Weekly Inside Bars patterns can be seen on Weekly timeframes only.
The strategy guides you the price level at which to BUY / SHORT and EXIT. It is intended for short to medium-term traders. It is important for the security to close beyond the trigger point for the signal to remain in force.

RyuPivot🔰 Pivot Points Standard Traditional Pivot Levels
📌Shows the same pivot levels from the Pivot Points Standard (Pivots) indicator on the Traditional settings. But with 3 indicators in one, can show the daily, weekly, and monthly levels all in one indicator. This indicator only shows the current pivot level and not the previous ones and will auto adjust update to the newest one. The current pivot line levels are shown across the chart.
📌Features
🔹P-D = Pivot Daily Timeframe
🔹P-W = Pivot Weekly Timeframe
🔹P-M = Pivot Monthly Timeframe
🔹S1, S2, S3, S4, S5 Pivot Supports with each timeframe D/W/M
🔹R1, R2, R3, R4, R5 Pivot Resistances with each timeframe D/W/M
🔹Can show/hide any timeframe Daily, Weekly, Monthly, or all
🔹Option to show/hide the 4th and 5th support/resistance levels
🔹Can adjust the line width for each timeframe
🔹Can show/hide pivot text labels
🔹Can adjust pivot text labels position offset
📌Default set Daily Pivots off, can use for trading lower timeframes for scalps. Shows Monthly and Weekly pivots with Pivot support/resistance levels 4 and 5 default on, optionally can hide. Default line width set with Monthly largest at 3, Weekly at 2, and Daily smallest at 1; can adjust to preference and can change color in the style tab. Note, for the Daily Pivots levels for S4, S5, R4, and R5 text labels are not shown since ran out of room to add more, but the line levels are still shown.

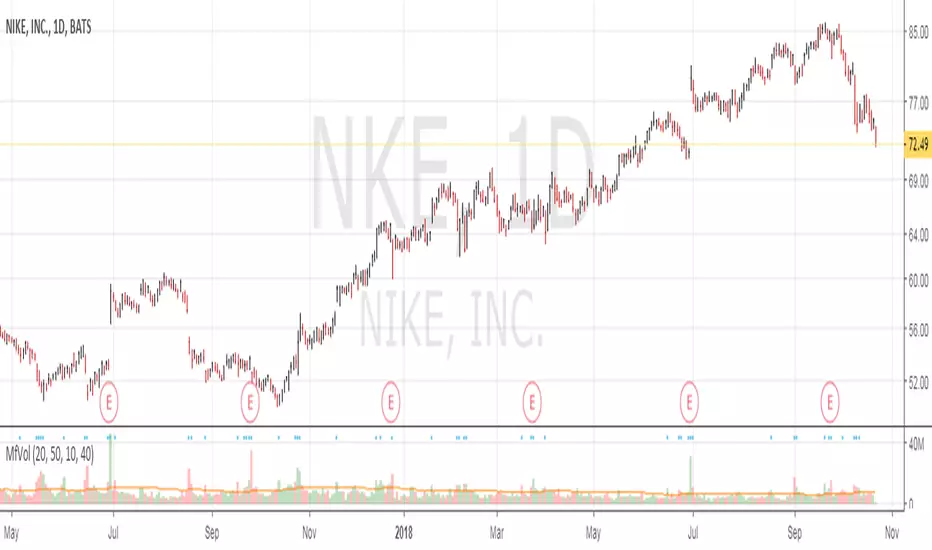
Multi Time Frame VolumeThis is a standard Volume indicator with options to allow different configurable daily and weekly MA length. All other chart time frame (besides daily and weekly) will be using the default MA length value.
On top of the configurable daily and weekly MA length, a dot is displayed for volume x% > current MA length. This is to indicate institutional buying when volume is above certain %.
Default, daily and weekly MA length are configurable. % of increase above the MA length is also configurable. Here are the default value, Default = 20, Daily MA length = 50, Weekly MA length = 10, Institutional Purchase (blue dot) = 40%.
Ichimoku DoubleTF overlay
Hello guys, this code allow to overlay a second ichimoku over the first one loaded on the used time-frame.
It's simple.
Choose your preferred Time-frame.
Set the Time-frame for the second Ichimoku in the settings menu .
Now you can see two Ichimoku clouds based on two different time-frame.
It can be very usefull and more ordered of a multi-windows layout.
On second Ichimoku the Chikou-span is omitted 'cause i think that is useless and cumbersome.
To help to reading the graph i set two labels to identify the "2nds" tenkan and kijun.
Tell me if this script was useful and remember to follow me and adding a like.
Available combinations:
DAILY: WEEKLY AND MONTLY
4H: WEEKLY, DAILY
1H: WEEKLY, DAILY, 4H
30m: DAILY, 4H, 1H
15m: DAILY, 4H, 1H, 30m
5m: DAILY, 4H, 1H, 30m, 15m
3m: 1H, 30m, 15m
1m: 1H, 30m, 15m,5m,3min
Thanks, bhutano
*****************************************************************************************************
Ciao ragazzi, questo codice permette di sovrapporre un secondo Ichimoku a quello del time-frame utilizzato.
Scegliete il vostro time-frame preferito.
Impostate il time-frame del secondo Ichimoku dalle impostazioni dello script .
Adesso vedrete due Nuvole Ichimoku basati su due time-frame diversi.
Può essere davvero utile e più ordinato di un layout multi-window.
Sul secondo Ichimoku la Chickou è stata omessa perchè penso che sia inutile e ingombrante.
Per aiutare la lettura del grafico ho impostato due etichette per identificare le seconde tenkan e kijun.
Ditemi se questo script vi è stato utile e ricordatevi di seguirmi e aggiungere un mi piace.
Combinazioni possibili:
DAILY: WEEKLY AND MONTLY
4H: WEEKLY, DAILY
1H: WEEKLY, DAILY, 4H
30m: DAILY, 4H, 1H
15m: DAILY, 4H, 1H, 30m
5m: DAILY, 4H, 1H, 30m, 15m
3m: 1H, 30m, 15m
1m: 1H, 30m, 15m,5m,3min
Grazie, bhutano

Volumeweighted macd leader with bb squeezethis indicator is very useful for stocks or crytpto especialy 3d and weekly charts
daily shows good too but if u re a daily trader use it if not dont use it coz 4h and daily is noisy some when there is no trend
thats why weekly and 3d is good because it ll give u accurate signal and trend reversals
this is not my script just a combination of lazybear squeeze momentum, macdleader and volume weighted macd of kivanc
i merge them so it also shows bb squeeze on zero line and settings name is median
macd leader is 2 differen color above zero line and below zero line
above zero line if macd leader is green its buy signal and trend is up
if blue it meand no trend or trend reversal so sell or wait if u use 4h or daily but 3d and weekly it means sell
below zero line macd leader color is red and means that there is downtrend and do not buy
when 3d or weekly turns blue on macd leader it means trend reversal about the start
good with heiken ashi candles
DO NOT FORGET THIS IS NOT PERFECT INDICATOR FOR SHORT TERM, PREFER IT 3D AND WEEKLY FR BETTER RESULTS

Trend Speed & ALMA vs VWAP Oscillator# Trend Speed ALMA VWAP Oscillator (TSAV Osc)
## Overview
The **Trend Speed ALMA VWAP Oscillator** is a MACD-style oscillator that combines three powerful concepts: the Trend Speed Analyzer's dynamic EMA, ALMA (Arnaud Legoux Moving Average) bands, and Volume Weighted Average Price (VWAP). It measures trend strength and momentum relative to VWAP, providing clear visual signals for trend direction and potential reversals.
## Key Features
- **MACD-Style Display**: Familiar oscillator layout with lines, signal lines, and histogram
- **Multiple VWAP Types**: Session, Rolling (1-24 hours), and Weekly anchored VWAP
- **Dynamic Trend Analysis**: Adaptive EMA with acceleration factor from Trend Speed Analyzer
- **ALMA Band Integration**: Fast and slow ALMA for crossover signals
- **Chart Overlay**: Optional plots of Dynamic Trend, VWAP, and ALMA bands on price chart
- **VWAP Standard Deviation Bands**: +/- 1, 2, 3 standard deviation bands
## Indicator Components
### Oscillator Pane
| Component | Description |
|-----------|-------------|
| **Trend vs VWAP Line** | Distance between Dynamic Trend EMA and VWAP (blue) |
| **Trend Signal Line** | EMA of Trend vs VWAP for crossover signals (cyan) |
| **ALMA vs VWAP Line** | Distance between fast ALMA and VWAP (orange) |
| **ALMA Signal Line** | EMA of ALMA vs VWAP (yellow) |
| **Histogram** | Configurable: Trend Strength, Trend vs VWAP, or ALMA vs VWAP |
| **Zero Line** | White reference line at zero (VWAP level) |
### Chart Overlay (Optional)
| Component | Description |
|-----------|-------------|
| **Dynamic Trend** | Dotted line colored by histogram gradient |
| **VWAP** | Thick solid line, green above/red below trend |
| **VWAP Bands** | Standard deviation bands (+/- 1, 2, 3 std) |
| **ALMA Bands** | Fast and slow ALMA with optional fill |
### Signal Markers
| Signal | Shape | Meaning |
|--------|-------|---------|
| **Triangle Up** (green) | Bottom | Trend vs VWAP crossed above signal line |
| **Triangle Down** (red) | Top | Trend vs VWAP crossed below signal line |
| **X Cross** (green) | Zero line | Dynamic Trend crossed above VWAP |
| **X Cross** (red) | Zero line | Dynamic Trend crossed below VWAP |
| **Circle** (green) | Oscillator | ALMA bullish cross (configurable source) |
| **Circle** (red) | Oscillator | ALMA bearish cross (configurable source) |
| **Background Highlight** | Full bar | Ideal entry condition met |
## VWAP Types
### Session VWAP
Resets at a configurable anchor time (default 9:30 AM EST). Best for intraday trading with regular market hours.
### Rolling VWAP
Uses a moving window of 1, 2, 3, 4, 8, 12, or 24 hours. Best for continuous markets or when you want a shorter-term volume-weighted reference.
### Weekly VWAP
Resets at the start of each trading week using `timeframe.change("W")`. Works across all market types:
- **Stocks**: Resets Monday morning
- **Futures**: Resets at futures week open
- **Crypto**: Resets at calendar week start
## Settings Guide
### VWAP Settings
- **VWAP Type**: Session, Rolling, or Weekly
- **Anchor Time**: Reset time for Session VWAP (EST timezone)
- **Rolling Period**: Window size for Rolling VWAP
- **VWAP Source**: Price source for VWAP calculation (default: hlc3)
### Trend Speed Settings
- **Maximum Length**: Upper limit for dynamic moving average (default: 50)
- **Accelerator Multiplier**: Responsiveness to price changes (default: 5.0)
- **Speed Smoothing**: Hull MA period for speed smoothing (default: 5)
### ALMA Settings
- **ALMA 1 (Fast)**: Length, Offset, Sigma for fast ALMA
- **ALMA 2 (Slow)**: Length, Offset, Sigma for slow ALMA
### MACD Settings
- **Signal Line Length**: EMA period for signal lines (default: 9)
### Display Settings
- **Histogram Source**: Choose what the histogram displays
- **ALMA Cross Source**: "ALMA Bands" (ALMA1 vs ALMA2) or "Oscillator Signal" (vs signal line)
- **Show/Hide**: Toggle individual components
### Chart Overlay
- **Show Dynamic Trend**: Dotted trend line on chart
- **Show VWAP**: Thick VWAP line on chart
- **Show VWAP Std Dev Bands**: +/- 1, 2, 3 standard deviation bands
- **Show ALMA Bands**: ALMA1 and ALMA2 on chart
- **Show ALMA Fill**: Fill between ALMA bands
## Trading Guidelines
### Bullish Signals
1. Trend vs VWAP line crosses above signal line (triangle up)
2. Dynamic Trend crosses above zero/VWAP (green X)
3. ALMA bullish cross (green circle)
4. **Ideal Long**: All three align with positive histogram
### Bearish Signals
1. Trend vs VWAP line crosses below signal line (triangle down)
2. Dynamic Trend crosses below zero/VWAP (red X)
3. ALMA bearish cross (red circle)
4. **Ideal Short**: All three align with negative histogram
### Reading the Histogram
- **Bright Green**: Strong bullish momentum (trend accelerating up)
- **Light Green**: Weak bullish momentum (trend slowing)
- **Light Red**: Weak bearish momentum (trend slowing)
- **Bright Red**: Strong bearish momentum (trend accelerating down)
### VWAP as Support/Resistance
- Price above VWAP with positive oscillator = bullish bias
- Price below VWAP with negative oscillator = bearish bias
- Oscillator crossing zero = potential trend change at VWAP
## Installation
1. Copy the source code from `trend-speed-alma-vwap-oscillator.pine`
2. Open TradingView's Pine Editor
3. Paste the code and click "Add to Chart"
4. Configure settings based on your trading style
## Files Included
- `trend-speed-alma-vwap-oscillator.pine` - Main indicator implementation
- `README.md` - This documentation file
## Based On
- **Trend Speed Analyzer** by Zeiierman - Dynamic EMA and speed calculations
- **ALMA** (Arnaud Legoux Moving Average) - Built-in TradingView function
- **VWAP** - Volume Weighted Average Price with custom anchoring
## Disclaimer
Trading involves substantial risk of loss and is not suitable for all investors. Past performance is not indicative of future results. This indicator is for educational purposes only and should not be considered as investment advice.

cd_VW_CxOverview
The cd_VW_Cx is a sophisticated trend analysis tool designed to quantify market momentum using Multi-Period VWAP (Volume Weighted Average Price). Unlike standard indicators, this script evaluates the current price relationship across multiple historical VWAP anchors to generate a real-time "Confidence Score" ranging from -100 to +100.
💡 Key Features
• Dynamic Anchoring: Seamlessly switch between Daily, Weekly, or Monthly open anchors to align with your trading style (Scalping, Day Trading, or Swing).
• Algorithmic Scoring (The Score Box): The indicator compares the current VWAP against historical periods.
o Score > +70: Strong Bullish Momentum.
o Score < -70: Strong Bearish Momentum.
• Polyline Rendering: Utilizes Pine Script v6’s advanced polyline architecture for high-performance, sleek visual plotting that doesn't clutter your chart.
• Institutional Support/Resistance: Historical VWAP levels are color-coded, often acting as "invisible" magnetic zones where institutional orders are clustered.
🛠 How to Trade with cd_VW_Cx
1. Momentum Confirmation: Look for the Score Box to turn Teal (Bullish) or Red (Bearish). This indicates that the current trend has statistical backing from multiple previous sessions.
2. The Breakout Signal: The script tracks price crossovers of the current VWAP. A "Bullish Breakout" combined with a high score is a high-probability entry signal.
3. Visual Guidance: Use the custom labels to identify which specific day/week/month’s VWAP is currently being tested as support or resistance.
⚙️ Customizable Settings
• Anchor Selection: Choose the calculation basis (Daily, Weekly, Monthly).
• Thresholds: Adjust the sensitivity of the Bullish/Bearish alerts (Default is +/- 70).
• Visuals: Full control over table positioning, font sizes, and color palettes to match your chart theme.
📢 cd_VW_Cx: Multi-Period VWAP Scoring & Analysis Guide
🔍 Overview & Visual Logic
The labels next to the VWAP levels dynamically change based on your Anchor selection:
• Daily Open: Displays the Day Name (e.g., Monday, Tuesday).
• Weekly Open: Displays the Week Number (1 – 52).
• Monthly Open: Displays the Month Number (1 – 12).
•
General View:
________________________________________
🚦 How to Filter & Track Your Assets
You can monitor your favorite assets using two powerful methods:
1. Real-Time Alerts
Stay updated with TradingView notifications:
• Per Asset: Track a single pair.
• Watchlist Basis: Monitor your entire list at once. Alert Setup Guide:
2. Pine Screener Integration
Filter the market effortlessly using the Pine Screener. Pine Screener View:
________________________________________
⚙️ Settings & Configuration
• Timeframe Selection: Your chart timeframe must be lower than the selected Anchor timeframe. (e.g., If "Daily Open" is selected, the timeframe should be lower than 1D).
• Anchor Choice: Select Daily, Weekly, or Monthly opens.
• Source Selection: Default value is set to ohlc4. Source Settings:
Filtering Criteria Examples:
• Bullish Filtering: Find assets with high momentum scores.
• Bullish Breakout (Single Criteria): Filters assets that have closed above the current VWAP level.
• Combined Strength (Score + Breakout): Filters assets that have a Score > 70 AND a fresh VWAP Breakout simultaneously.
________________________________________
⚠️ Important Notes & Warnings
• Calculation Logic: The indicator calculates levels and scores on timeframes lower than the anchor. It is best used on timeframes that are close to but lower than the anchor.
• Avoid Extreme Gaps: Using a very low timeframe (e.g., 1m) with a very high anchor (e.g., Monthly) increases the risk of erroneous results.
• Optimization: The default score threshold of 70 is a starting point; I recommend adjusting it based on your own trading experience.
• The Power of Confluence: VWAP levels are naturally strong. Their significance increases when they coincide with institutional levels like PDH (Previous Day High), Session H/L, or HTF FVG.
• Experience Matters: A high score alone is not enough for an entry. Always combine this data with your personal strategy.
________________________________________
💬 Community & Feedback
I would love to hear your suggestions regarding the scoring logic or visual improvements! Feel free to share your thoughts in the comments.
Happy Trading! 🚀

Monday Range - User Defined LookbackEnglish Description
Monday Range Expansion & Multi-Week Projections
This indicator identifies the Monday Range (the price action from Monday's open at 00:00) and projects symmetric expansion levels across the entire trading week. It is designed for traders who use the weekly open and Monday's volatility as a benchmark for the week's price action.
Key Features:
Exact Monday 00:00 Start: Using advanced logic, the indicator pins the starting point precisely to the weekly open (Monday 00:00), ensuring no lag or offset regardless of your timeframe.
Symmetric Expansion Levels: It calculates the Monday High-Low range and projects a +100%, +50%, -50%, and -100% expansion, providing clear support and resistance targets.
User-Defined Lookback: You can choose exactly how many past weeks to display on your chart, keeping your workspace clean and focused.
Force Overlay Technology: All lines and labels use force_overlay, ensuring they always stay on the top layer, above candles and other indicators.
Weekly Freeze: Historical weeks stay "frozen" at their Friday closing points, allowing for clear backtesting of previous weekly levels.

BTC - BEAM: Adaptive Multiple (Open-Source)Title: BTC - BEAM: Adaptive Multiple Cycle Oscillator | RM
Overview & Philosophy
The BTC - BEAM (Bitcoin Economics Adaptive Multiple) is a premier macro-valuation tool designed to identify the "Logarithmic Pulse" of Bitcoin's 4-year cycles. Unlike standard oscillators that lose relevance as the network grows, BEAM uses an adaptive baseline that tracks Bitcoin’s fundamental growth curve with precision.
It identifies the harmonic distance between the current price and its multi-year mean, helping you spot the rare windows of deep capitulation and terminal euphoria.
Methodology
This edition is a hardened, gap-proof and Open-Source implementation of the canonical BEAM model.
1. The 1400-Day Anchor (200 Weeks):
The model is anchored to a 1400-day Simple Moving Average. On the Weekly chart, this aligns with the legendary 200-week moving average—the historical "floor" of the Bitcoin network. It represents one full halving cycle of data.
2. Daily-Lock Architecture:
Even when viewed on the 1W chart, the script performs its calculations using Daily data. This ensures that the oscillator captures the exact peak day of a cycle, providing a "high-resolution" signal within a "low-noise" weekly environment.
3. Logarithmic Normalization:
We calculate the natural logarithm of the price-to-mean relationship, scaled by a factor of 2.5: Score = ln(Price / 1400d MA) / 2.5 This creates a standardized "Multiple" that remains comparable across all Bitcoin eras.
How to Read the Chart (1W Context)
🟧 The BEAM Line (Orange): Tracks the "macro heat" of the market. On the 1W chart, look for the slope of this line to identify cycle acceleration.
🔴 The Cycle Ceiling (Score > 1.0): Historical Cycle Tops. When the weekly candle sustains in this zone, the market has reached a state of unsustainable mania. Every major blow-off top has been captured in this red corridor.
🟢 The Cycle Floor (Score < 0.1): Generational Accumulation. On the 1W chart, these zones appear as extended "green troughs." These are the only times in history where Bitcoin is fundamentally "too cheap" relative to its 4-year trend.
The Status Dashboard
The bottom-right monitor provides immediate cycle classification:
• BEAM Score: The exact logarithmic multiple.
• Cycle Regime: ACCUMULATION , NEUTRAL , or OVERHEATED .
Credits
BitcoinEcon: For the original concept of the BEAM adaptive model.
⚠️ RECOMMENDATION: While this indicator captures daily data, it is strongly recommended to be viewed on the Weekly (1W) Timeframe. The 1W chart filters market noise and perfectly reveals the long-term "Cycle Narrative."
Disclaimer
This script is for research and educational purposes only. Macro indicators provide structural context; they are not crystal balls. Always manage your risk according to your personal financial plan.
Tags
bitcoin, btc, beam, macro, cycle, halving, log-growth, valuation, on-chain, Rob Maths

Alpha Options System# Apex Options Sniper - Advanced Multi-Signal Day Trading System
## 🎯 Overview
**Apex Options Sniper** is a professional-grade, multi-signal trading indicator specifically engineered for high-probability day trading of weekly options. This comprehensive system combines 10+ technical indicators into a sophisticated scoring algorithm that identifies optimal entry points with institutional-level precision.
Perfect for traders of SPY, QQQ, and high-volume stocks, this indicator eliminates guesswork by providing clear BUY CALLS and BUY PUTS signals based on multiple technical confluences.
---
## 🚀 Key Features
### **Multi-Signal Confluence Engine**
- **10+ Technical Indicators** working in harmony
- **Weighted Scoring System** (0-30+ points) for signal strength
- **Real-time Signal Classification**: Strong vs Moderate signals
- **False Signal Reduction** through multi-confirmation requirements
### **Advanced Momentum Analysis**
- ✅ RSI with Divergence Detection (bullish & bearish)
- ✅ Stochastic Oscillator (oversold/overbought + crossovers)
- ✅ MACD with crossover and momentum confirmation
- ✅ Automatic divergence spotting for reversal trades
### **Sophisticated Trend Detection**
- ✅ Triple EMA System (9/21/50) with alignment scoring
- ✅ SuperTrend Indicator with trend flip alerts
- ✅ VWAP for institutional price levels
- ✅ Multi-timeframe trend confirmation
### **Professional Volume Analysis**
- ✅ Volume Spike Detection (vs 20-period average)
- ✅ OBV (On-Balance Volume) with divergence detection
- ✅ Order Flow Analysis (buy vs sell pressure)
- ✅ Relative volume ratio display
### **Advanced Pattern Recognition**
- ✅ Bollinger Band Squeeze detection (volatility expansion)
- ✅ BB breakout signals (major move initiation)
- ✅ Automatic Support & Resistance levels (pivot-based)
- ✅ Price reaction scoring at key levels
### **Built-in Risk Management**
- ✅ ATR-based Stop Loss calculations
- ✅ Customizable Risk:Reward ratios
- ✅ Position sizing recommendations
- ✅ Real-time profit target calculations
### **Comprehensive Visual Dashboard**
- ✅ Live scoring breakdown for all indicators
- ✅ Individual signal strength display
- ✅ Bull vs Bear score comparison
- ✅ Color-coded signal status
- ✅ Risk management metrics
---
## 📊 How It Works
### **Scoring System**
The indicator assigns points based on technical conditions:
| **Category** | **Max Points** | **Conditions** |
|-------------|---------------|----------------|
| Momentum (RSI/Stoch) | 8 | Oversold/overbought + divergences |
| MACD | 4 | Crossovers + momentum direction |
| Trend (EMAs) | 6 | EMA alignment + SuperTrend |
| Volume | 4 | Spikes + OBV divergences |
| Order Flow | 2 | Buy/sell pressure imbalance |
| Bollinger Bands | 2 | Squeeze + breakouts |
| Support/Resistance | 2 | Price at key levels |
| VWAP | 1 | Above/below institutional level |
### **Signal Thresholds**
- **🚀 STRONG CALLS**: Bull score ≥6, Net score ≥4
- **📈 CALLS**: Bull score ≥4, Net score ≥2
- **🔥 STRONG PUTS**: Bear score ≥6, Net score ≤-4
- **📉 PUTS**: Bear score ≥4, Net score ≤-2
### **Multi-Timeframe Filter**
Optional higher timeframe confirmation reduces false signals by ensuring the broader trend supports your trade direction.
---
## 🎮 How to Use
### **Installation**
1. Open TradingView Pine Editor
2. Paste the complete indicator code
3. Click "Add to Chart"
4. Customize settings to your preference
### **Recommended Settings**
**For SPY/QQQ Day Trading:**
- Timeframe: 1-minute or 5-minute
- Strong Signal Threshold: 6
- Moderate Signal Threshold: 4
- Multi-timeframe Confluence: ON
**For Individual Stocks:**
- Timeframe: 5-minute or 15-minute
- Increase SuperTrend multiplier to 3.5-4.0
- Enable all advanced features
**For Scalping:**
- Timeframe: 1-minute
- Use STRONG signals only (6+)
- Tight stop loss (1.0-1.5 ATR multiplier)
### **Best Trading Times**
- **9:30-11:00 AM EST** - Highest volume, strongest signals
- **2:00-4:00 PM EST** - Afternoon momentum plays
- Avoid 11:30 AM-1:30 PM EST (lunch chop)
---
## 📈 Signal Interpretation
### **What You'll See on Chart:**
**Visual Signals:**
- 🟢 **Green Triangle (CALLS)**: Bullish entry point
- 🟢 **Large Green Triangle (STRONG CALLS)**: High-confidence bullish entry
- 🔴 **Red Triangle (PUTS)**: Bearish entry point
- 🔴 **Large Red Triangle (STRONG PUTS)**: High-confidence bearish entry
- 💎 **Small Diamonds**: RSI/OBV divergences (reversal warning)
**Dashboard Information:**
- Individual indicator values and signals
- Real-time score breakdown
- Bull/Bear score totals
- ATR stop loss levels
### **Entry Rules:**
✅ **High Probability Trades (Take These):**
- Strong signal (6+ score)
- 3+ indicators confirming
- Volume spike present
- SuperTrend aligned
- Higher timeframe confirms
⚠️ **Moderate Trades (Smaller Position):**
- Moderate signal (4-5 score)
- 2+ indicators confirming
- Normal volume
- Mixed trend signals
❌ **Avoid These:**
- Conflicting signals (Bull score ≈ Bear score)
- Low volume
- During major news events
- Bollinger squeeze without breakout direction
---
## 🛡️ Risk Management Guide
### **Position Sizing:**
- **Strong Signals (6+)**: 3-5% of portfolio
- **Moderate Signals (4-5)**: 2-3% of portfolio
- **Low Conviction**: 1-2% or skip
### **Stop Loss Strategy:**
- Use ATR-based stops (displayed in dashboard)
- Default: 1.5x ATR from entry
- Weekly options: 30-50% premium loss maximum
- Never hold through stop loss hoping for recovery
### **Profit Targets:**
- **Quick Scalps**: 25-50% gain (15-30 min)
- **Day Trades**: 50-100% gain (same day exit)
- **Swing**: 100-200% gain (1-2 days max for weeklies)
- **Take partial profits** at first target, let rest run
### **Time Decay Management (Weekly Options):**
- Monday-Wednesday: Hold overnight acceptable on strong signals
- Thursday: Close by EOD unless very strong conviction
- Friday: Avoid holding overnight, theta decay accelerates
---
## 🔔 Alert Configuration
### **Recommended Alerts:**
**Essential Alerts:**
1. 🚀 Strong Buy Calls
2. 🔥 Strong Buy Puts
**Advanced Alerts:**
3. 💎 RSI Bullish Divergence
4. ⚠️ RSI Bearish Divergence
5. 🔶 Bollinger Band Squeeze
6. ✅ SuperTrend Bull Flip
7. ❌ SuperTrend Bear Flip
**Alert Setup:**
- Set frequency: "Once Per Bar Close"
- Enable for all devices
- Use webhook for automation (optional)
---
## 💡 Pro Trading Tips
### **Maximize Win Rate:**
1. **Wait for confluence** - Best trades have 3+ indicators aligned
2. **Respect the dashboard** - Check WHY it's signaling (which indicators)
3. **Volume is king** - Signals with volume spikes are significantly more reliable
4. **Use BB Squeeze** - When squeeze + signal = explosive directional move
5. **SuperTrend flips** - Major trend change confirmations, very powerful
6. **Watch for divergences** - Diamond markers = hidden reversal opportunities
### **Common Mistakes to Avoid:**
❌ Trading every signal (be selective)
❌ Ignoring volume (volume confirms everything)
❌ Fighting the higher timeframe trend
❌ Oversizing positions on moderate signals
❌ Holding weekly options too long (theta decay)
❌ Trading during lunch hour (11:30-1:30 EST)
### **Advanced Techniques:**
- **Divergence + Support/Resistance** = Highest probability reversals
- **BB Squeeze + EMA alignment** = Explosive trend continuations
- **SuperTrend flip + Volume spike** = Major trend change entries
- **Multiple timeframe analysis** - Check 5m signal on 1m chart for precision entries
---
## 📊 Indicator Components Explained
### **RSI (Relative Strength Index)**
- Measures momentum and overbought/oversold conditions
- Divergences signal potential reversals before they happen
- Score: 2-3 points for extremes and divergences
### **Stochastic Oscillator**
- Confirms momentum extremes
- Crossovers provide entry timing
- Score: 1-2 points
### **MACD (Moving Average Convergence Divergence)**
- Trend following momentum indicator
- Crossovers signal momentum shifts
- Score: 1-3 points based on signal strength
### **EMA System (9/21/50)**
- Dynamic support and resistance
- Alignment shows trend strength
- Price position relative to EMAs scores 1-2 points
### **SuperTrend**
- Volatility-based trend indicator
- Reduces whipsaws in choppy conditions
- Trend flips are major signals (2 points)
### **Bollinger Bands**
- Volatility measurement
- Squeeze = calm before the storm
- Breakouts = directional move initiation (2 points)
### **Volume Analysis**
- Confirms price movement legitimacy
- Spikes validate signals (2 points)
- OBV divergences predict reversals (2 points)
### **Order Flow**
- Buy vs sell pressure measurement
- Institutional footprint detection
- Score: 2 points for strong imbalances
---
## 🎓 Learning Path
### **Beginner (Week 1-2):**
- Use STRONG signals only
- Focus on high-volume stocks (SPY/QQQ)
- Trade only first hour of market
- Use paper trading first
### **Intermediate (Week 3-4):**
- Add moderate signals to your arsenal
- Learn to read the dashboard
- Understand why each signal triggers
- Start combining with support/resistance
### **Advanced (Month 2+):**
- Use divergence signals
- Trade BB squeeze breakouts
- Optimize settings for your style
- Develop your own confluence rules
---
## ⚙️ Customization Guide
### **Adjustable Parameters:**
**Momentum Settings:**
- RSI Length (default: 14)
- RSI Oversold/Overbought levels (30/70)
- Stochastic Length (14)
**Trend Settings:**
- EMA periods (9/21/50)
- SuperTrend ATR Length (10)
- SuperTrend Multiplier (3.0)
**Volume Settings:**
- Volume MA Length (20)
- Volume Spike Threshold (1.5x)
**Advanced Settings:**
- Bollinger Band Length (20)
- BB Standard Deviation (2.0)
- Pivot Lookback (10)
**Signal Thresholds:**
- Strong Signal Score (default: 6)
- Moderate Signal Score (default: 4)
**Risk Management:**
- ATR Length (14)
- Stop Loss Multiplier (1.5)
- Risk:Reward Ratio (2.0)
---
## 📈 Performance Optimization
### **For Volatile Markets (VIX > 25):**
- Increase SuperTrend multiplier to 4.0
- Raise signal thresholds (+1 point)
- Tighten stop losses (1.0-1.2 ATR)
### **For Ranging Markets:**
- Focus on RSI extremes and divergences
- Use BB squeeze signals
- Ignore moderate signals
- Wait for support/resistance confirmation
### **For Trending Markets:**
- Follow SuperTrend direction religiously
- Use EMA alignment signals
- Allow wider stops (2.0 ATR)
- Take partial profits, let winners run
---
## 🔍 Troubleshooting
**Too Many Signals:**
- Increase signal thresholds to 7/5
- Enable multi-timeframe filter
- Trade only STRONG signals
**Missing Signals:**
- Decrease thresholds to 5/3
- Disable multi-timeframe filter
- Check that all features are enabled
**Whipsaw in Choppy Markets:**
- Increase SuperTrend multiplier
- Require volume spike confirmation
- Avoid trading 11:30 AM-1:30 PM EST
---
## 🏆 Best Practices
✅ **Always check:**
1. Dashboard shows why signal triggered
2. Volume confirms the move
3. Not during news events
4. Adequate time until expiration
✅ **Risk Management:**
1. Never risk more than 2% per trade
2. Use stops religiously
3. Take profits at targets
4. Don't revenge trade
✅ **Journal Your Trades:**
1. Entry price and signal strength
2. Which indicators triggered
3. Exit price and profit/loss
4. What worked and what didn't
---
## 📞 Support & Updates
This indicator is designed to evolve with market conditions. Recommended to:
- Review settings monthly
- Backtest on your favorite instruments
- Adjust thresholds based on your risk tolerance
- Keep a trading journal to track performance
---
## ⚠️ Disclaimer
This indicator is a tool for technical analysis and should not be used as the sole basis for trading decisions. Options trading involves substantial risk and is not suitable for all investors. Past performance does not guarantee future results. Always:
- Do your own research and due diligence
- Never invest more than you can afford to lose
- Consider consulting with a financial advisor
- Practice with paper trading before using real money
- Understand options Greeks (Delta, Theta, Gamma, Vega)
- Be aware of earnings dates and major news events
**No indicator is 100% accurate. Use proper risk management and trade responsibly.**
---
## 📊 Version History
**v1.0 - Initial Release**
- Multi-signal confluence system
- 10+ technical indicators
- Advanced dashboard
- ATR-based risk management
- Comprehensive alert system
---
## 🎯 Final Thoughts
**Apex Options Sniper** transforms complex technical analysis into clear, actionable signals. By combining multiple proven indicators with sophisticated scoring logic, it helps traders identify high-probability setups while managing risk effectively.
**Success Keys:**
- Quality over quantity (be selective)
- Risk management is everything
- Volume confirms the signal
- Confluence increases probability
- Discipline beats emotion
**Trade smart. Trade with confidence. Trade with Apex Options Sniper.**
---
*For questions, suggestions, or to share your success stories, please comment below or send a message.*
**Happy Trading! 🚀📈**

MTF CPR Boxes & Multiple Pivots - Nadeem Al-QahwiMTF CPR Boxes & Multiple Pivots is designed to make those structural zones easier to see by turning classic pivot math into clean, multi-timeframe visual regions directly on your chart.
⸻
The Concept: Central Pivot Range (CPR) Math
This tool is based on the well-known Central Pivot Range (CPR) methodology.
For each selected timeframe, the CPR is calculated from the previous period’s OHLC data:
• Central Pivot:
Pivot = (High + Low + Close) / 3
• Bottom Central:
BC = (High + Low) / 2
• Top Central:
TC = (Pivot - BC) + Pivot (equivalently TC = 2 * Pivot - BC)
This indicator computes these CPR levels for Daily, Weekly, and Monthly timeframes and overlays them on the current chart. The idea is to reveal how price is interacting with higher-timeframe value areas and potential support/resistance clusters in real time.
⸻
Visual Innovation:
• Instead of drawing only thin lines for TC, Pivot, and BC, the area between TC and BC is rendered as a box (zone).
• The central pivot is still drawn as a line inside the box for reference, but the main emphasis is on the entire value range, not a single price.
• This box-based representation helps traders visually identify:
• Liquidity clusters inside the CPR range
• Overlapping CPR zones across multiple timeframes (powerful confluence)
• Compression areas where price is likely to build up orders before expansion
⸻
Key Features
• Multi-Timeframe CPR (MTF Overlay)
• Daily CPR box
• Weekly CPR box
• Monthly CPR box
All three can be enabled simultaneously, allowing you to see where short-term and higher-timeframe value zones overlap.
• Institutional Color Theme
• Separate colors for Daily, Weekly, and Monthly CPR zones
• Designed to be visually distinct yet clean, so confluence is easy to spot without clutter.
• Multiple Pivot Types (Traditional + Camarilla)
• Traditional pivots (PP, S1–S5, R1–R5)
• Camarilla pivots (L1–L6, H1–H6)
These are drawn as classic lines with label/price options and can be used together with CPR boxes for a richer structural map.
• Dynamic Zone Levels (DZL) Engine
• Automatically detects pivot-based support and resistance zones from historical swings.
• Clusters nearby pivots into channels based on a configurable width and strength filter.
• Draws only the strongest zones to keep the chart readable and focused on meaningful levels.
⸻
Settings Guide (How to Customize)
The script includes a set of user-friendly controls so you can adapt the visuals to your style and chart theme:
• General Settings
• Pivot timeframe selection for the main (non-CPR) pivots.
• “Pivots Back” and “CPR Levels Back” to control how many historical periods are displayed (helpful for performance).
• CPR Visual Style (SMC Boxes)
• Box Transparency: Adjusts how opaque the CPR zones are (0 = solid, 100 = invisible fill).
• Border Style & Width: Choose between Solid, Dashed, Dotted, or hide borders completely.
• Text Options: Toggle CPR labels inside each box (e.g., “D-CPR”, “W-CPR”), set text color, size, and placement (center or corner positions).
• Pivots & Labels
• Enable/disable Traditional and Camarilla sets independently.
• Control which levels to display (e.g., show R1–R3 only).
• Choose whether to show level names, prices, or both.
• DZL Settings
• Pivot period for swing detection.
• Channel width (% of price range).
• Maximum number of zones and minimum strength (how many pivots must cluster to form a valid zone).
• Separate style controls for support vs. resistance colors.
⸻
Disclaimer
This indicator is provided for educational and analytical purposes only.
It does not constitute financial advice, investment advice, or a recommendation to buy or sell any security or instrument. Always perform your own analysis and use proper risk management. Trading involves risk, and you are solely responsible for your own decisions.

Advanced custom multi MA signals (EMA/SMA/VWMA/VWAP) Features of Multi Moving Averages
The biggest enemy in trading is "Noise." If you get swayed by minute fluctuations on the chart, you end up missing the forest for the trees.
This indicator (Advanced Custom Multi MA Signals) is not just a simple line. By combining the three core elements of Price, Time, and Volume, it acts as a navigation system that visualizes the market's "true trend." In particular, the ability to analyze 5 moving averages simultaneously across various timeframes is akin to viewing a 3D map of the battlefield.
Understanding Core Concepts
This indicator supports 4 types of moving averages. It is crucial to clearly understand the nature of each tool.
SMA (Simple Moving Average): The most basic average value. Since it produces fewer whipsaws (false signals), it is used as a baseline to judge the "long-term trend."
EMA (Exponential Moving Average): Places more weight on recent prices. It reacts sensitively to market changes, making it advantageous for identifying "entry points."
VWMA (Volume Weighted Moving Average): Incorporates "volume" into the price calculation. It acts as a "false signal filter," weeding out price moves that aren't backed by trading volume.
VWAP (Volume Weighted Average Price): The benchmark price used by institutional investors for daily trading. It is calculated based on the session, regardless of the period settings. It is considered the "lifeline" of day trading.
Indicator Settings Guide
Open the settings window and tune it to fit your trading style.
MA 01 ~ 05 (Moving Average Settings)
MA Type: Select according to your purpose. (Generally, EMA is recommended for short-term analysis, SMA/VWMA for long-term).
Length: Enter the period you wish to analyze (e.g., 20, 60, 120, 200).
Timeframe: This is the core feature. It allows you to overlay moving averages from a higher timeframe (e.g., 4-hour, Daily) onto the chart you are currently viewing (e.g., 15-minute).
Signal Option (Trading Signals)
Golden Cross (GC) / Death Cross (DC): Captures the moment the short-term line breaks through the long-term line. You can run up to 3 strategies simultaneously.
Ribbon Gradient (Trend Visualization)
Represents the gap between two moving averages with color. As the color deepens and the width expands, it indicates a powerful trend; if the width narrows, it suggests a high probability of a trend reversal.
5 Usage Strategies
The highlight of this indicator is the cross strategy utilizing the "Multi-Timeframe (MTF)" feature. Familiarize yourself with the 5 example strategies below and set up your own strategy based on your expertise.
💡 Tip 1. Do not go against the "Major Trend" (The Authority of the Weekly Candle)
Settings: Set MA5 to .
Interpretation: The Weekly 50 line is the "major trend line" managed by institutions and market makers. If the current price is above this line, maintain only a "Buy (Long)" bias; if below, maintain only a "Sell (Short)" bias. Adhering to this rule alone can help you avoid massive losses.
💡 Tip 2. Highly Reliable "Swing Signal" (Daily Golden Cross)
Settings: In Signal 1, configure the Short MA to and the Long MA to .
Interpretation: A Golden Cross where the 4-Hour 50 EMA breaks above the Daily 50 EMA often signifies a major "trend reversal" rather than a temporary rebound. This provides an ideal entry signal for office workers or swing traders who need high reliability.
💡 Tip 3. 4-Hour Candle as the Standard for "Precision Entry"
Situation: When the Daily trend is rising (Bullish alignment).
Strategy: While watching the 15-minute or 1-hour chart, set the indicator's Signal 2 to the cross of and .
Interpretation: When the Daily chart is in an uptrend, a Golden Cross occurring on the 4-Hour chart marks "the point where a correction (pullback) ends and the rise resumes." This is the entry point with the best risk-to-reward ratio.
💡 Tip 4. Filtering Out "Fake Signals" (The Secret of Volume)
Strategy: When creating a cross signal, try using VWMA (Volume Weighted) for the Long MA, even if you use EMA for the Short MA.
Reason: A Golden Cross caused simply by a rise in price can be a trap. However, if it breaks through the heavy VWMA line accompanied by volume, it is strong evidence that "genuine liquidity" has entered.
💡 Tip 5. Remember the "Hierarchy" (Higher Timeframe Priority Rule)
Principle: If a Golden Cross (Buy Signal) appears on the 4-Hour chart, but the Daily chart is in a Death Cross (Sell Signal) state, do not enter.
Interpretation: A signal from a lower timeframe cannot overcome the power of a higher timeframe. The professional approach is to trade with significant volume only when signals align (Sync) in the order of Weekly > Daily > 4-Hour. Keep this indicator's dashboard feature on and always check the status of higher timeframes.
Signal Generation Principle (Operating Mechanism)
Signals are generated when the set short-term moving average and long-term moving average cross each other.
📈 1. Golden Cross (BUY = Buy Signal)
Situation: The moment the short-term MA crosses upward from below the long-term MA.
Principle: It implies that recent buying pressure has broken through the resistance level accumulated over a long period.
📉 2. Death Cross (SELL = Sell Signal)
Situation: The moment the short-term MA crosses downward from above the long-term MA.
Principle: It implies that recent selling pressure has collapsed the long-term support line.
※ If the candles are not displaying correctly or are flickering, please set the indicator's 'Visual order' to 'Bring to front' as shown in the image below.
Investment Caution and Disclaimer
Before using this indicator for actual trading, please strictly read the contents below.
① Auxiliary indicators are a "Compass," not a "Book of Prophecy."
This indicator is merely a tool that mathematically calculates and visualizes past price data. A "magic indicator" that predicts future price fluctuations 100% accurately or guarantees profit does not exist. The signals provided are for reference only and must never be the sole basis for entry/exit decisions.
② The responsibility for all investments lies with "Yourself."
Financial investment (Cryptocurrencies, Stocks, Futures, etc.) involves high volatility and is a risky activity that can result in the loss of some or all of the principal. The final responsibility for all trading results (profits and losses) incurred by utilizing this indicator lies entirely with the investor. The distributor and developer accept no legal responsibility for investment results under any circumstances.
③ Past data does not guarantee the future.
Even a Golden Cross that fit perfectly in backtesting or past charts may operate differently in tomorrow's market situation (News, Macroeconomics, Unexpected Variables, etc.). Do not rely solely on technical analysis; you must conduct fundamental analysis and risk management in parallel.
④ Risk management is the top priority.
No matter how promising a signal appears, "all-in trading" (investing all assets in a single trade) is a shortcut to bankruptcy. More important than the indicator itself is adhering to the principles of strict scaling in (split buying) and Stop-Loss.

VWAP Pro [cryptalent]VWAP Pro (Multi-Period + Standard Deviation)
1. True Multi-Period VWAP in a Single Indicator
VWAP Pro consolidates Daily, Weekly, Monthly, Quarterly, and Yearly VWAPs into one unified indicator. This eliminates the need for multiple scripts and allows traders to assess short-, medium-, and long-term value simultaneously on any timeframe.
This design supports:
Multi-timeframe value alignment
Institutional-style reference points
Cleaner charts with fewer indicators
2. Accurate Volume-Weighted Standard Deviation
Unlike generic volatility bands, the standard deviation in VWAP Pro is fully volume-weighted and derived directly from the VWAP calculation. This ensures that dispersion reflects where real trading activity occurred, not just price fluctuation.
Benefits include:
More realistic value boundaries
Improved identification of statistically stretched prices
Reduced noise compared to time-based indicators
3. Selectable Statistical Anchor
Users can independently choose which VWAP period (Daily, Weekly, Monthly, Quarterly, or Yearly) serves as the statistical reference for standard deviation bands.
This allows traders to:
Analyze intraday mean reversion around Daily VWAP
Track swing-level extensions from Weekly or Monthly VWAP
Maintain consistency between strategy horizon and statistical context
4. Current and Previous Period VWAP Visibility
VWAP Pro optionally plots previous period VWAPs alongside current ones. These prior value references often act as:
High-probability reaction levels
Acceptance or rejection zones
Structural support and resistance
This feature provides historical context without clutter, enabling more informed decision-making.
5. Highly Configurable and User-Controlled
Every VWAP and standard deviation component can be toggled independently. Traders can:
Display only relevant periods
Adjust standard deviation multipliers (1σ, 2σ, 3σ)
Customize colors for immediate visual clarity
The indicator adapts easily to different trading styles, from scalping to position trading.
6. Designed for Market Structure and Value Analysis
VWAP Pro is built around value discovery, not prediction. It excels at highlighting:
Fair value zones
Overextended price conditions
Areas where acceptance or rejection is likely to occur
This makes it especially effective for traders focused on market structure, auction behavior, and liquidity-driven price movement.
7. Clean Visualization with Professional Aesthetics
Careful use of transparency, fills, and plotting styles ensures that:
VWAP levels remain clearly visible
Standard deviation zones provide context without dominating the chart
Multiple periods can coexist without visual overload
The result is a professional-grade visual tool suitable for continuous use.
Summary
VWAP Pro (Multi-Period + Standard Deviation) is a comprehensive value-based indicator that combines multi-timeframe VWAPs, volume-weighted statistical bands, and flexible configuration into a single, efficient framework. It is designed for traders who prioritize structure, context, and statistically grounded decision-making over lagging signals or predictive indicators.

Nifty Hierarchical Macro GuardOverview
The Nifty Hierarchical Macro Guard is a "Market Compass" indicator specifically designed for Indian equity traders. It locks its logic to the Nifty 50 Index (NSE:NIFTY) and applies a strict hierarchy of trend analysis. The goal is simple: prioritize the long-term trend (Monthly/Weekly) to decide if you should even be in the market, then use the short-term trend (Daily) for precise exit timing.
This script ensures you never ignore a macro "crash" signal while trying to trade minor daily fluctuations.
The Color Hierarchy (Priority Logic)
The indicator uses a "Top-Down" filter. Higher timeframe signals override lower timeframe signals:
Level 1: Monthly (Ultra-Macro) — Deep Maroon
Condition: Nifty 10 EMA is below the 20 EMA on the Monthly chart.
Action: This is the highest priority. The background will turn Deep Maroon, overriding all other colors. This is your "Forget Trading" signal. The long-term structural trend is broken.
Level 2: Weekly (Macro Warning) — Dark Red
Condition: Monthly is Bullish, but Nifty 10 EMA is below the 20 EMA on the Weekly chart.
Action: The background turns Dark Red. This indicates a significant macro correction. You should stay out of fresh positions and protect capital.
Level 3: Daily (Tactical) — Light Red / Light Green
Condition: Both Monthly and Weekly are Bullish (Green).
Action: The background will now react to the Daily 10/20 EMA cross.
Light Green: Nifty is healthy; safe for fresh positions.
Light Red: Tactical exit signal. Nifty is seeing short-term weakness; exit positions quickly.
Key Features
Symbol Locked: No matter what stock you are viewing (Reliance, HDFC, Midcaps), the background only reacts to NSE:NIFTY.
Clean Interface: No messy lines or labels on the price chart. The information is conveyed purely through background color shifts.
Customizable: Change the MA types (EMA/SMA) and lengths (e.g., 10/20 or 20/50) in the settings.
Macro Dashboard: A small, transparent table in the top-right corner displays exactly which timeframe is currently controlling the background color.
How to Use for Nifty Strategy
Stay Out: If the chart is Deep Maroon or Dark Red, do not look for "buying the dip." Wait for the macro health to return.
Take Exits: If the background is Light Green and suddenly turns Light Red, it means the Daily Daily 10/20 cross has happened. Exit your Nifty-sensitive positions immediately.

Intermarket SSMT Table [Pogiest]General
Intermarket Sequential Smart Money Technique (IMSSMT) is a Quarterly Theory concept that identifies divergences (extreme highs/lows) when comparing different market triads to another market triad in two consecutive quarters.
SSMT involves identifying divergences in a correlated asset triad that occurs consecutively from the previous quarter to the current quarter to predict new phases of price, a shift in market sentiment, and also potential trend reversals. An SSMT divergence occurs when one or two assets makes a new high or low, but the other asset or assets does not, signaling a potential shift in market direction. A Hidden SSMT Divergence occurs when one or two assets’ closing price closes higher or lower than the other one or two assets’ closing price. However, with potential gaps in price, an opening price can also be the extreme when comparing assets for divergences. Hidden SSMT divergence compares the candle bodies while a Standard SSMT divergence compares the highs and lows. Both types of SSMTs are considered to be cracks in correlation and can be used to identify potential new phases of price whether it be a reversal, retracement, consolidation, and continuation.
Credit of concepts/ideas: ICT & TraderDaye
What Makes This Indicator Unique
The indicator table is designed to be used on any symbol the trader is viewing. For example, the indicator is shown on an NQ chart while selecting three symbols in the Forex triad in settings. The indicator will request the separate data from the symbols selected and display the data within the table. The table does not rely on data on the chart being viewed. Instead of switching charts, the table is used to track other market triads for SSMTs (standard & hidden) while viewing other markets simultaneously.
The indicator has the ability to display Standard SSMTs, Hidden SSMTs, or both simultaneously in real-time, tick by tick in the time period selected in a correlated asset triad within the table. Toggle modes for each type of SSMT will run independently (runs when enabled) and therefore, optimizes performance. The user is able to select three different tickers in settings instead of limiting to pairs. In addition, the indicator has “Invert” toggle options to track both Standard and Hidden SSMTs for assets with negative correlations.
How the Indicator Table Works
The indicator functions to track any divergences from the previous quarter to the current quarter. In addition, the indicator tracks the current status even when there are no divergences (see phase column below).
Timeframe Column:
1. Displays up to two different timeframes to monitor.
Asset Columns:
1. Display up to three different assets to monitor.
2. Cells display “Bull” in green background color or “Bear” in red background color showing the current state of each candle and updates in real-time tick by tick.
Phase Column:
Displays the current status from the previous quarter to the current quarter. The status updates in real-time tick by tick.
1. “F/S” indicates there are no current SSMT divergences between the previous quarter to the current quarter and all assets have not swept the previous quarter, a “failure swing”.
2. “HH” is displayed when all assets have swept the previous quarter’s extreme high. (Higher High)
3. “LL” is displayed when all assets have swept the previous quarter’s extreme low. (Lower Low) See screenshot with drawings below.
4. SSMT indicates there is an SSMT from the previous quarter to the current quarter. Red background is a bearish SSMT (divergence at the highs) or green background is a bullish SSMT (divergence at the lows). If the SSMT becomes invalid (i.e. the last asset sweeps the extreme high/low), then the table will update to display either “HH” or “LL” depending on the extreme it swept. See screenshot with drawings below.
5. “Both” indicates there are SSMT divergences at both the extremes highs and lows. If an SSMT on one side gets deleted, then the cell will automatically update to display the SSMT that is still intact. See screenshot with drawings below.
Invert Toggle Option:
When this setting is turned on, the asset column cells will display the inverted color of the live chart to show assets are in-sync. It will track the inverted swing points for SSMTs, higher highs, lower lows, etc. For example, if EUR and GBP are making lower highs, while DXY (Inverted toggle on), makes a lower low on the actual live chart, it will display “SSMT”.
NOTE:
Scanning function per timeframe to detect SSMTs:
Weekly HTF: Scans 4HR bars
Daily HTF: Scans 1HR bars
6HR/4HR HTF: Scans 15m bars
1HR HTF: Scans 5m bars
5m HTF: Scans 1m bars
The script has fixed lookback periods for bars to ensure the appropriate data is being captured. The higher the timeframe the user selects in settings while viewing on an extremely lower timeframe, the indicator may give inaccurate readings:
Recommended Chart Timeframes:
For best performance and accuracy, view your chart on a timeframe close to or lower than the scan timeframe:
Weekly HTF → View on 1H-4H chart
Daily HTF → View on 1H-4H chart
6HR/4HR HTF → View on 5m-15m chart
90M HTF → View on 3m-15m chart
1H HTF → View on 1m-15m chart
The indicator will attempt to scan further back if needed, but extremely low chart timeframes (e.g., 1m) with high HTF (e.g., Weekly) may still have limitations.
In addition, the indicator bases the SSMT off the previous quarter’s time range to the current quarter’s time range. If there are discrepancies in the time ranges (start to end of higher timeframe period selected), the SSMTs may display differently than what is viewed on the chart. For example, indices open at 18:00 est on a new trading day, so the time ranges matches throughout the day. However, in Forex, EUR and GBP opens at 17:00 est while DXY opens later, so the time ranges may be off (i.e. 6 hour timeframe). For best use, select time periods that matches throughout the day.
Usage
Traders can use both types of SSMT divergences to anticipate potential reversals in points of interest such as higher timeframe swing points, supply/demand zones, higher timeframe imbalances, key levels, etc. This indicator can also be beneficial in identifying cracks in correlation via Hidden SSMT when there are no divergences off the highs and lows. Divergences can come in different forms relating to Intermarket SSMT. For example, if one market triad is all making lower lows while the other market triad is making higher highs, this can be deemed a divergence between the two markets. Another example would be one market triad all makes lower lows while another market triad makes a bullish SSMT. This can potentially signal a bullish move up. SSMT divergences (standard and hidden) can be used as a confirmation tool with other confluences to identify trend direction with respect to points of interest, higher timeframe order-flow, lower timeframe order-flow, etc. In addition, having both a Standard SSMT and Hidden SSMT divergence display could potentially signal a reversal. It is up to the trader to gauge the price action at the time.
Settings
1. Choose up to three different assets to monitor.
Note: If only two are selected, the indicator will only display the two selected and compare the two assets for divergences. If one is selected, a warning sign will be displayed to select at least two assets.
2. Choose up to two different timeframes. Option to deselect timeframes.
3. Enable/disable standard or hidden SSMT.
4. Option to enable alerts. Alerts include the different phases in the table (i.e. SSMT, HH, LL, and Dual SSMT [both standard & hidden) for each timeframe.
5. Toggle option to show/hide the table. Toggle option to show/hide the “Title Row” which is the first row at the top of the table.
6. Adjust the table positioning to be displayed on the chart.
7. Option to change text size in the table cells. This will also increase/decrease the size of the table.
Risk Disclaimer
This indicator is for educational and informational purposes only and does not constitute financial advice. All trading and investment decisions remain solely the responsibility of the user.
Trading involves a high degree of risk, and past performance is not indicative of future results.
Always conduct your own research and consult with a qualified financial professional before making any trading decisions.
By using this indicator, users acknowledge they understand these risks and accept full responsibility for their trading decisions and outcomes.

Stepped Multi Timeframe MAs with PDH PDL TDH TDL Dynamic Labels
Plots stepped (blocky) higher‑timeframe moving averages and VWAP on the current chart (HMA/EMA/VWMA/SMA/VWAP toggles).
Automatically switches MA source to the chart’s timeframe on Daily/Weekly/Monthly (e.g., Weekly chart shows weekly MAs), while intraday charts can use a user-selected higher timeframe.
Draws Previous Day High/Low (PDH/PDL) anchored from the exact candle that formed the level, then extends the line across the chart up to the latest bar.
Draws Today’s High/Low (TDH/TDL) the same way, and updates dynamically as new intraday highs/lows are made (the anchor shifts to the new wick candle).
Keeps labels readable by placing them above/below each line with no background and a clean grey style, and repositions label X based on the visible chart window (so labels stay at a consistent % from the right edge while you pan/zoom)

DeltaPulseDeltaPulse: Professional Cumulative Volume Delta Indicator
DeltaPulse is a free cumulative volume delta (CVD) indicator engineered for modern traders who demand precision, adaptability, and visual clarity. Unlike traditional CVD tools that often suffer from scaling issues, excessive noise, or poor responsiveness across timeframes, DeltaPulse delivers a streamlined, professional-grade solution that "just works" – providing actionable insights into buying and selling pressure with minimal setup.
This indicator accumulates the net difference between buying and selling volume (inferred from candle direction), normalizes it intelligently for consistent readability, and applies advanced smoothing to filter out market noise while preserving momentum signals. The result is a clean, momentum-colored line in a dedicated pane, enhanced by subtle visual cues that highlight key market dynamics.
Whether you're a day trader scalping intraday moves, a swing trader analyzing weekly trends, or an institutional analyst reviewing futures contracts, DeltaPulse adapts seamlessly to your workflow. It's designed to be your go-to tool for confirming trends, spotting divergences, and identifying order flow imbalances – all without the bloat of overcomplicated features.
Key Features
Intelligent Normalization for Universal Compatibility
Automatically adjusts scaling based on chart timeframe and symbol volume profile.
Intraday (1-5 min): Uses a 100-period volume average for responsive, lively signals.
Intraday (15+ min): 50-period average for balanced sensitivity.
Daily/Weekly+: 20-period average for clean, long-term perspective.
Ensures the indicator remains visually meaningful and non-flat on any asset – from low-volume penny stocks to high-liquidity indices like ES or NQ.
Advanced Smoothing Options
Six moving averages to match your trading style:
EMA - Quick reactions to recent delta shifts
SMA - Simple Moving Average - Stable, noise-resistant baseline
WMA - Weighted Moving Average - Emphasizes recent data with linear weighting
HMA - Hull Moving Average - Ultra-smooth yet lag-free – ideal for momentum trading
RMA - Running Moving Average (Wilder's) - Trend-following with minimal whipsaws
VWMA - Volume-Weighted Moving Average - Highlights high-volume delta moves
Lower values increase reactivity; higher values enhance smoothness.
Flexible Reset Mechanisms
Session Reset: Clears CVD at the first regular trading bar each day – perfect for intraday analysis.
Weekly Reset: Resets at the start of each new week – suited for swing and position trading.
No manual intervention required; the indicator handles resets reliably across all timeframes.
Background Shading:
Light green tint above zero; light red below.
Extreme highlights when smoothed CVD exceeds 90% of its 80-bar high/low – flags potential exhaustion or absorption zones.
How It Works
DeltaPulse calculates a simple yet effective volume delta on each bar:
Bullish Bar (close ≥ open): Adds full volume as positive delta.
Bearish Bar (close < open): Subtracts full volume as negative delta.
This raw delta accumulates into a running total (CVD), resetting based on your chosen mode. The total is then:
Normalized against a timeframe-adaptive volume average to ensure consistent scaling.
Smoothed using your selected MA type for noise reduction and trend clarity.
Plotted with momentum-based coloring and visual enhancements.
The output is a single, intuitive line that reveals the underlying battle between buyers and sellers – far more reliably than raw volume bars or basic oscillators.
Trading Applications
DeltaPulse shines in revealing order flow dynamics that price action alone often conceals. Here are proven ways to integrate it:
Trend Confirmation & Momentum Trading
Bullish Setup: Rising green line above zero confirms buyer control – enter longs on pullbacks to support.
Bearish Setup: Falling red line below zero signals seller dominance – short on rallies to resistance.
Zero Line Crosses as Reversal Signals
A crossover from negative to positive territory often marks a sentiment shift – use for entry triggers.
Combine with volume spikes or key levels for high-probability setups.
Enhancement: VWMA mode amplifies signals on high-volume breakouts.
Absorption & Exhaustion Zones
Watch for extreme background highlights: A spike to highs followed by reversal suggests large players absorbing supply.
Ideal for fade trades near overextended levels (e.g., after news events).
Avoid low-volume or illiquid symbols, as delta inference relies on reliable candle data.
Timeframe-Agnostic: Solves the common CVD pitfall of being "dead" on intraday charts or erratic on daily ones through smart, automatic normalization.
Lag-Free Responsiveness: The default HMA smoothing strikes a rare balance – smoother than EMA, faster than SMA – without the computational overhead of exotic filters.
Zero Clutter: No histograms, no extraneous plots, no overwhelming alerts. Just pure, distilled order flow intelligence.

VWAP Flow ParmezanThe "Official Bank Flow VWAP" is a comprehensive trading suite designed for institutional Forex traders.
This indicator solves the problem of chart clutter by combining two critical components of liquidity: Price (Value) and Time (Sessions). It is specifically optimized for EUR/USD and GBP/USD on intraday timeframes (M5, M15), helping you identify high-probability setups where "Fair Value" meets "Volatility."
Key Features
1. Multi-Timeframe VWAP Hierarchy Unlike standard indicators, this tool visualizes the interaction between three distinct timeframes:
Daily VWAP (Dynamic Color): Your primary trend filter. Green when Bullish (Price > VWAP), Red when Bearish (Price < VWAP).
Weekly VWAP (Orange Dots): Represents the medium-term balance. Acts as a magnet for mean reversion mid-week.
Monthly VWAP (Purple Line): The institutional "line in the sand." Major support/resistance level.
2. Standard Deviation Bands (Market Balance) The indicator plots SD1 and SD2 bands around the Daily VWAP:
Inner Zone (SD1): Represents the "Fair Value" area.
Outer Bands (SD2): Represents overbought/oversold conditions. Useful for identifying mean reversion plays back to the center.
3. Official Exchange Sessions (Time) Forget confusing "killzones." This tool highlights the Official Open times for major exchanges, adjusted for Daylight Savings via New York time:
London Open (08:00 LDN): The start of European volume.
New York Open (08:00 NY): The injection of US liquidity.
London Close/Fix: The daily overlap close, often marking trend reversals.
Note: Sessions are visualized with non-intrusive black "shadow" backgrounds to keep your chart clean.
4. "Ghost" Levels (Previous VWAP) A unique feature that plots the closing VWAP level of the previous day. Institutional algorithms often target these "untested" levels as Take Profit targets or liquidity pools.
How to Use
Trend Following: If Price is above the Daily VWAP (Green) during the London Open, look for Long entries targeting the SD1/SD2 upper bands.
Mean Reversion: If Price hits the SD2 Band while far away from the Weekly VWAP, look for a reversal back to the mean.
Confluence: The strongest signals occur when price touches a key VWAP level (e.g., Weekly VWAP) specifically during the highlighted Session Start times.
Settings
Timezone: Defaults to America/New_York to automatically handle DST shifts for London/NY opens.
Visuals: Fully customizable colors and transparency. Default is set to a "Dark Mode" friendly professional palette.

Worstfx Key Time Windows + 5 Day Journal🕒 Key Time Windows — Features & Purpose
✔️ Includes 6 Major Time Windows:
• 7:45 PM (Asia Open Overview)
• 12:00 AM (Daily Reset Liquidity Shift)
• 2:00 AM (London Accumulation / Manipulation)
• 7:00 AM (Pre-NY / Expansion Setup)
• 10:00 AM (NY Reversal Window)
• 2:00 PM (NY Power Move / Final Push) ← added
These windows are not random — they are the exact points in the day where:
• Liquidity resets
• Volatility compresses or expands
• Session trends form or reverse
• Market makers reposition
• High-probability setups appear
The panel shows:
➤ INSIDE
You are currently in the window.
Expect movement, structure breaks, or trap/reversal behavior.
➤ NEAR
Approaching a key window.
Prepare, observe order flow, plan entries.
➤ FAR
Out of the actionable range.
Ideal for reducing screen time and avoiding emotional trades.
➤ IDLE
The window passed.
High-probability moment is over — walk away or wait for the next one.
⚡ Why this matters
Most blown accounts come from trading outside high-probability times.
Your edge comes from timing, not randomness.
This panel keeps your brain aligned with the correct moments — not boredom, FOMO, or impulse.
📊 5-Day Performance Journal — Features
✔️ Enter daily P/L manually
• Monday → Friday
• Accepts positive or negative values
• Example: +2500, -300, 0
✔️ Auto-Calculated Weekly Total
• Shown right next to Friday
• Colored based on profit or loss
• Light highlight tint to stand out without distractions
✔️ Two Clean Layouts
• Vertical → For corner placement
• Horizontal → For header-like week summaries
✔️ Psychology Through Design
• Green = rewarded discipline
• Red = consequence of breaking plan
• White-dim = zero day → neutral, no shame, no heat
The goal is not the number —
It’s accountability, awareness, and emotional grounding.
🧠Consistency Over Drama
The weekly total next to Friday forces your brain to think in weeks, not minutes.
Bad day?
You stop early to protect weekly total.
Good day?
You don’t overtrade because the number is already green.
This shifts your psychology from:
“I need to win right now.”
to:
“I need to preserve my weekly edge.
🔋To unlock the full power of the framework, run this together with Worstfx Fractal Sessions🔋

Majors FX-REER/NEER Suite [BIG]═══════════════════════════════════════════════════════════════════════════════
BIG MAJORS FX-REER/NEER SUITE
═══════════════════════════════════════════════════════════════════════════════
OVERVIEW
The BIG Majors FX-REER/NEER Suite is a multi-currency valuation framework designed for institutional FX traders, macro strategists, and systematic currency allocators. This indicator calculates Real Effective Exchange Rates (REER) and Nominal Effective Exchange Rates (NEER) for the seven major currency pairs (G7 FX), integrating macroeconomic fundamentals (CPI inflation differentials) with technical trend analysis to identify structural currency misvaluations and mean-reversion opportunities.
Unlike standard FX indicators that only analyze bilateral price action, this suite constructs trade-weighted basket indices that measure each currency's strength against a portfolio of its major trading partners, adjusted for inflation differentials. This approach mirrors central bank and sovereign wealth fund methodologies for assessing equilibrium exchange rate levels.
The framework combines:
- Fundamental valuation metrics – REER/NEER indices with Z-score normalization
- Technical trend filters – Ichimoku Cloud and Aroon oscillator confluence
- Signal classification system – Long/Short/Watch/Conflict regime identification
- Quantitative confidence scoring – 0-100% signal reliability weighting
═══════════════════════════════════════════════════════════════════════════════
CORE METHODOLOGY
═══════════════════════════════════════════════════════════════════════════════
• NEER Calculation (Nominal Effective Exchange Rate)
The NEER measures a currency's value against a trade-weighted basket of its seven major trading partners, geometrically averaged in log-space to ensure symmetry:
1. All seven G7 FX pairs are normalized to USD-pivot (A/USD format)
2. Each currency's log-normalized rate is compared to the arithmetic mean of the other six
3. Formula: NEER_i = (8/7) × log(CCY_i/USD) - mean(log(CCY_others/USD))
This construction ensures that:
- A rising NEER indicates currency appreciation against the basket
- The methodology is symmetric and avoids base-currency bias
- Changes reflect multilateral competitive dynamics, not just bilateral moves
• REER Calculation (Real Effective Exchange Rate)
The REER adjusts the NEER for inflation differentials using Consumer Price Index (CPI) data:
Formula: REER_i = NEER_i + log(CPI_i) - mean(log(CPI_others))
By incorporating CPI differentials, the REER provides a purchasing-power-parity-adjusted valuation metric that accounts for relative inflation rates. This is the institutional standard for assessing fundamental currency equilibrium levels.
Data Sources :
- FX rates: TradingView composite feed (FX:), OANDA, FXCM, FOREXCOM
- CPI data: ECONOMICS namespace (monthly frequency, official statistical releases)
- Supported currencies: USD, EUR, JPY, GBP, CHF, AUD, CAD, NZD
• Valuation Bias Detection
Each currency pair is classified as overvalued (bias = -1, "Short") or undervalued (bias = +1, "Long") based on two independent criteria:
1. Percentage Band Deviation – Relative Index distance from 100 baseline
• Overvalued: Index > 100 × (1 + deviation%), default +5%
• Undervalued: Index < 100 × (1 - deviation%), default -5%
2. Z-Score Threshold – Statistical extremes in rolling lookback window
• Overvalued: Z-Score > +1.5 (default)
• Undervalued: Z-Score < -1.5 (default)
Either condition triggers a bias classification. This dual-filter approach captures both absolute deviations and relative extremes within recent historical context.
• Trend Confirmation (Ichimoku + Aroon)
To avoid counter-trend entries in strong momentum regimes, the suite integrates two independent trend filters:
Ichimoku Cloud
- Bull: Price > Cloud AND Conversion > Base Line
- Bear: Price < Cloud AND Conversion < Base Line
- Parameters: Conv(9), Base(26), Span B(52), Displacement(26)
Aroon Oscillator
- Bull: Aroon Up > 70 AND Aroon Down < 30
- Bear: Aroon Down > 70 AND Aroon Up < 30
- Default lookback: 25 periods
Trend is confirmed only when both indicators agree (Ichimoku + Aroon ≥ +1 for bull, ≤ -1 for bear).
• Setup Classification Logic
The framework combines Bias (fundamental valuation) with Trend (technical momentum) to generate four distinct setup types:
- Long↗︎ (Setup = 1) – Undervalued + Bullish Trend
Context : Mean reversion opportunity with momentum confirmation. Currency trading at fundamental discount while technical trend supports upside.
- Short↘︎ (Setup = -1) – Overvalued + Bearish Trend
Context : Mean reversion opportunity with momentum confirmation. Currency trading at fundamental premium while technical trend supports downside.
- Watch (Setup = 2) – Valuation bias present, but no clear trend
Context : Fundamental mispricing without directional conviction. Monitor for trend emergence before entering.
- Conflict (Setup = 3) – Bias and trend pointing opposite directions
Context : Overvalued currency in uptrend OR undervalued currency in downtrend. Avoid—either trend continuation or valuation mean reversion, but unclear which dominates.
• Confidence Score (0-100%)
Each setup receives a quantitative confidence weighting based on three factors:
1. Band Distance (40%) – How far the Relative Index deviates from 100 baseline
2. Z-Score Magnitude (40%) – Statistical extremeness within lookback window
3. Trend Confluence (20%) – Agreement between Ichimoku and Aroon signals
Score interpretation:
- 70-100% = High confidence (both valuation and trend extremes aligned)
- 40-69% = Moderate confidence (one factor strong, others weak)
- 0-39% = Low confidence (marginal signals, questionable reliability)
═══════════════════════════════════════════════════════════════════════════════
VISUAL COMPONENTS
═══════════════════════════════════════════════════════════════════════════════
• Dashboard Table (Top-Right)
Displays real-time valuation metrics for all seven major pairs:
Column 1: Pair – Currency pair identifier
Column 2: RelIdx – Relative Index (100 = baseline at first valid bar)
Column 3: Z – Z-Score vs. rolling lookback window
Column 4: Bias – Long/Short/Neutral valuation classification
Column 5: Trend – ↑/↓/– trend direction (Ichimoku + Aroon)
Column 6: Setup – Long↗︎/Short↘︎/Watch/Conflict (color-coded)
Column 7: Conf – Confidence score 0-100% (color-coded)
Column 8: Quelle – REER (inflation-adjusted) or NEER (nominal only)
Color coding :
- Green = Long↗︎ setup
- Red = Short↘︎ setup
- Orange = Watch (no trend)
- Purple = Conflict (bias/trend divergence)
• Optional Chart Plot
Select any of the seven pairs to plot its Relative Index on the chart with:
- Baseline at 100 (horizontal gray line)
- +Band at 100 × (1 + deviation%), dashed red
- -Band at 100 × (1 - deviation%), dashed green
- Aqua line tracking the selected pair's Relative Index evolution
• Signal Labels
When a pair transitions into Long↗︎ or Short↘︎ setup:
- Green label below bar = Long↗︎ entry signal
- Red label above bar = Short↘︎ entry signal
- Positioned using ATR offset for visibility
═══════════════════════════════════════════════════════════════════════════════
KEY FEATURES
═══════════════════════════════════════════════════════════════════════════════
- Institutional valuation methodology – REER/NEER framework used by central banks and sovereign wealth funds
- Macro-fundamental integration – CPI inflation differentials adjust for purchasing power parity
- Multi-timeframe flexibility – Daily (D), Weekly (W), Monthly (M) resolution options
- Seven simultaneous pairs – Monitors all G7 FX majors in single unified dashboard
- No repainting – All signals confirm on bar close
- Automated alerts – TradingView notifications when setups transition (Long/Short triggers)
- Confidence weighting – Quantitative scoring allows position sizing calibration
- Fallback logic – Automatically switches to NEER if CPI data incomplete
═══════════════════════════════════════════════════════════════════════════════
HOW TO USE
═══════════════════════════════════════════════════════════════════════════════
1. Apply to any chart – The indicator pulls multi-security data; chart symbol does not matter (commonly applied to SPY or DXY for reference)
2. Select data feed – Default FX: (TradingView composite) is recommended; alternatives: OANDA, FXCM, FOREXCOM
3. Choose timeframe :
• Daily (D) = Swing trading, medium-term mean reversion (2-8 week horizons)
• Weekly (W) = Position trading, macro regime shifts (1-6 month horizons)
• Monthly (M) = Strategic allocation, long-term equilibrium analysis (6-24 month horizons)
4. Configure parameters :
• Z-Score Lookback : Default 252 (one trading year on Daily); adjust for timeframe (52 for Weekly, 36 for Monthly)
• Deviation Band : Default ±5%; tighten to ±3% for more signals, widen to ±7% for higher conviction
• Z-Threshold : Default ±1.5; increase to ±2.0 for extreme-only signals
5. Monitor dashboard table :
• Focus on pairs showing Long↗︎ or Short↘︎ setups with Conf ≥ 70%
• Watch for Watch setups transitioning to directional signals
• Avoid Conflict setups unless you have strong macro conviction
6. Execute mean-reversion trades :
• Long↗︎ = Buy undervalued currency (e.g., EURUSD Long if EUR undervalued)
• Short↘︎ = Sell overvalued currency (e.g., USDJPY Short if JPY overvalued)
• Target: Mean reversion toward 100 baseline or opposite band
7. Position sizing by confidence :
• High confidence (70-100%) → Standard position size
• Moderate confidence (40-69%) → Reduce size by 50%
• Low confidence (<40%) → Avoid or use minimal pilot size
8. Risk management :
• Stop loss: Place beyond recent swing high/low or 1.5× ATR
• Take profit: Opposite valuation band or 100 baseline
• Time stop: Exit if setup reverses (Long→Neutral→Short or vice versa)
═══════════════════════════════════════════════════════════════════════════════
LIMITATIONS
═══════════════════════════════════════════════════════════════════════════════
- CPI data lag – Consumer Price Index releases are monthly and report with 2-4 week delay. REER calculations may lag real-time inflation dynamics.
- Structural shifts ignored – The baseline (100) is set at first valid bar. Long-term structural appreciation/depreciation (e.g., 20-year USD bull market) is not accounted for. Suitable for cyclical mean reversion, not secular trend analysis.
- Equal-weighting assumption – All seven currencies are equally weighted in basket construction. Actual trade-weighted indices use GDP or trade volume weights, which this framework simplifies.
- No emerging market currencies – Limited to G7 majors (USD, EUR, JPY, GBP, CHF, AUD, CAD, NZD). Does not cover EM FX (e.g., CNY, BRL, MXN).
- Technical filter limitations – Ichimoku and Aroon are lagging indicators. In fast-moving markets (e.g., central bank interventions, geopolitical shocks), trend signals may arrive late.
- Mean reversion assumption – The framework assumes currencies revert to equilibrium. During regime changes (e.g., monetary policy divergence, crisis flows), deviations can persist or expand before eventual reversal.
═══════════════════════════════════════════════════════════════════════════════
TECHNICAL SPECIFICATIONS
═══════════════════════════════════════════════════════════════════════════════
- Pine Script v6
- Non-repainting (signals confirmed on bar close)
- Multi-security data feeds (7 FX pairs + 8 CPI series)
- Automated alert system (transitions to Long↗︎/Short↘︎)
- Real-time dashboard table (8 columns × 8 rows)
- Maximum 500 labels supported (100 per pair direction)
- Fallback logic: NEER used if CPI data unavailable
═══════════════════════════════════════════════════════════════════════════════
NOTES
═══════════════════════════════════════════════════════════════════════════════
This indicator is designed for experienced FX traders, macro strategists, and portfolio managers familiar with:
- Real and nominal effective exchange rate concepts
- Purchasing power parity theory and inflation differentials
- Multi-currency portfolio construction and basket hedging
- Carry trade and convergence strategies
- Central bank policy impacts on FX equilibrium levels
The framework provides objective valuation signals but does not account for:
- Interest rate differentials (carry)
- Capital flow dynamics (risk-on/risk-off)
- Central bank intervention zones
- Geopolitical risk premiums
Always combine REER/NEER valuation analysis with macro event calendars, positioning data (CFTC COT reports), and fundamental policy divergence assessments.
═══════════════════════════════════════════════════════════════════════════════
Developed for institutional FX valuation analysis based on central bank REER/NEER methodologies.
