Auto Trendline Indicator (based on fractals)A tool that automatically draws out trend lines by connecting the most recent fractals.
Description:
The process of manual drawing out trend lines is highly subjective. Many times, we don’t trade what we see, but what we “want to see”. As a result, we draw lines pointing to the direction that we wishfully want price to move towards. While there are no right/wrong ways to draw trend lines, there are, however, systematic/unsystematic ways to draw trend lines. This tool will systematically draw out trend lines based on fractals.
Additional feature:
This tool will also plot out symbols (default symbol “X”) to signify points of crossings. This can be useful for traders considering to use trend lines as part of their trading strategies.
Here is an interesting observation on the price actions of NASDAQ futures on a 5 second chart during regular trading hours on July 14, 2022.
It’s a phenomenon. People like to see straight lines connecting HL/LH, etc., so it's possible for the market as a whole to psychologically react to these lines. However, it is important to note that is is impossible to predict the direction of price. In the case above, price could have tanked below auto-drawn trend line. Fractal based trend lines should only be taken as references and regarded as price levels. No studies have ever proven that the slope of trend lines can indicate price's future direction.
More about fractals:
To understand more about fractals:
www.investopedia.com
www.tradingview.com
Contrary to what it sounds like, fractal in "technical analysis" does not refer to the recursive self-repeating patterns that appear in nature, such as the mesmerizing patterns found in snowflakes. The Fractal Markets Hypothesis claims that market prices exhibit fractal properties over time. Assuming this assertion to be true, then fractals can be used a tool to represent the chaotic movements of price is a simplified manner.
The purpose of this exercise is to take a tool that is readily available (ie. in this case, TradingView’s built-in fractals tool), and to create a newer tool based on it.
Parameters:
Fractal period (denoted as ‘n’ in code): It is the number of bars bounding a high/low point that must be lower/higher than it, respectively, in order for fractal to be considered valid. Period ‘n’ can be adjusted in this tool. Traditionally, chartists pick the value of 5. The longer it is, the less noise seen on the chart, and the pivot point may also be exhibited in higher timeframes. The drawback is that it will increase the period of lag, and it will take more bars to confirm the printed fractal.
Others: Intuitive parameters such as whether to draw historical trend lines, what color to use, which way to extend the lines, and whether or not to show points of crossings.
חפש סקריפטים עבור "williams"

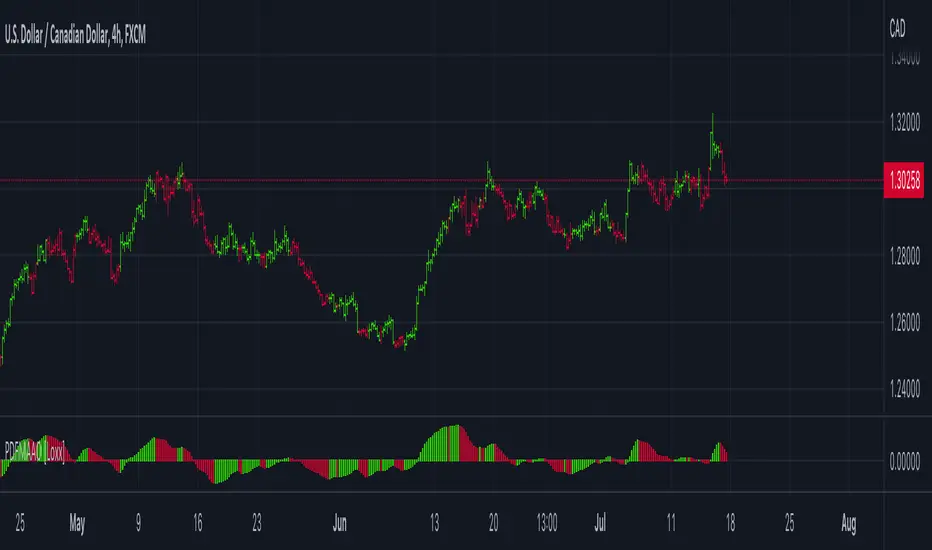
PDFMA Awesome Oscillator [Loxx]Theory:
Bill Williams's Awesome Oscillator Technical Indicator (AO) is a 34-period simple moving average, plotted through the bars midpoints (H+L)/2, which is subtracted from the 5-period simple moving average, built across the bars midpoints (H+L)/2. It shows us quite clearly what’s happening to the market driving force at the present moment.
This version uses PdfMA (Probability Density Function weighted Moving Average) instead of SMA (Simple Moving Average). This is a deviation from the original AO since in the AO since there is no parameter that you can change, but with this version, you can change the variance part of the PdfMA calculation. That way you can get different values for the AO even without changing periods of calculation (the general rule of thumb is: the greater the variance, the smoother the result)
Usage:
You can use color changes (mainly on zero cross) for trend change signals
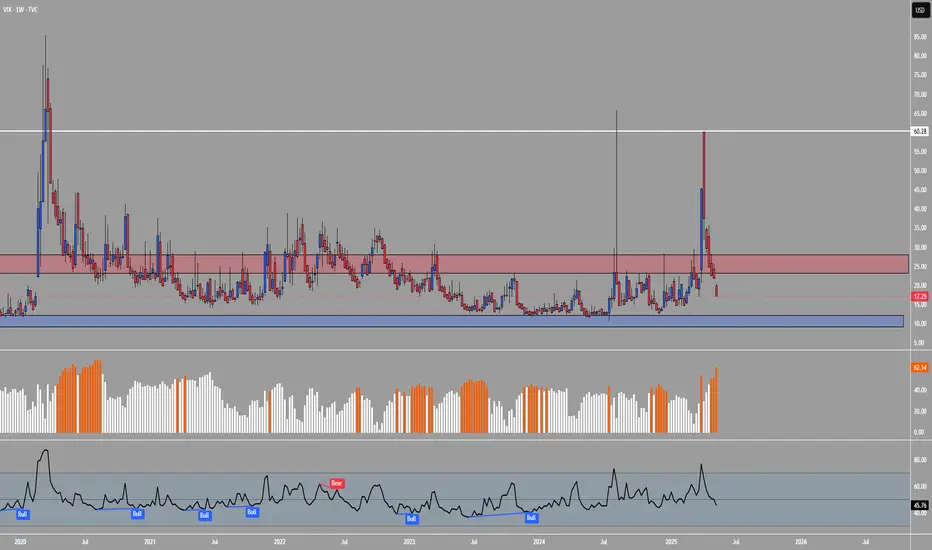
DCVIXThe DCVIX is a modified version of the Williams Vix Fix indicator.
It is a volatility based indicator based on Bollinger Bands and Standard Deviations. It is designed to assist you in identifying times of high and low volatility.
During times of high volatility (squeeze), price action often finds a local bottom. During times of low volatility, price action often finds a local top.
The DCVIX will print aqua bars on the histogram during times of high volatility (squeeze). This will assist you in identifying potential price action bottom.
The DCVIX also shows the changes in volatility based on the size of the bars. This may also assist you in identifying breakouts and even potential market tops.
This indicator is designed to be used in conjunction with other forms of confluence.
VSA with Smart Volume-Atropine
Volume spread analysis is a new way of looking at the market. It more like the candlestick analysis taking into consideration the volume . Volume Spread Analysis is one of the most important concepts of technical analysis .
Volume plays a very important role for traders. It is one of the key movers of the market because the market is mostly moved by fear and greed among the participants. Volume is also important in confirming a trend and chart patterns.
How Does This Indicator Works ?
1. It indicates Strengths and Weakness Signals on the basis of Tom Williams Volume Spread Analysis.
2. It Automatically Draws Potential Zones and you can extend them.
3. It Draws zones over Strength or Weakness Signal for whole session.
4. Gives Options to hide Historical Action to avoid noise over the chart.
5. Shows Cumulative Volume over the Candle to get clear Picture of buyer and seller.
6. It Indicates most important signal of Effort vs Result.
7. Automatically draws zone of High Volume Candle from Higher Time frame.
8. Draws 60min(1Hr) Initial Balance Range.

Fractal BreakoutThis indicator prints channels based on Williams Fractals creating an upper and a lower channel. Breakouts of these channels are marked as buy or sell signal including the respective alerts. Furthermore the indicator includes a Moving Average which can be toggled on to be used as a trendfilter (buy above, sell below).

KINSKI Multi Trend OscillatorThe Multi Trend Oscillator is a tool that combines the ratings of several indicators to facilitate the search for profitable trades. I was inspired by the excellent indicator "Technical Ratings" from Team TradingView to create an alternative with a technically new approach. Therefore, it is not a modified copy of the original, but newly conceived and implemented.
The recommendations of the indicator are based on the calculated ratings from the different indicators included in it. The special thing here is that all settings for the individual indicators can be changed according to your own needs and displayed as a histogram and MA line. This provides an excellent visual control of your own settings. Alarms are also triggered.
Criteria for determining the rating
Relative Strength Index (RSI)
Buy - Crossover oversold level and indicator < oversold level and rising
Sell - Crossunder oversold level and indicator >= oversold level and falling
Neutral - neither Buy nor Sell
Relative Strength Index (RSI) Laguerre
Buy - Crossover Oversold Level and Indicator < Oversold Level and rising
Sell - Crossunder oversold level and indicator >= oversold level and falling
Neutral - neither Buy nor Sell
Noise free Relative Strength Index (RSX)
Buy - Crossover Oversold Level and Indicator < Oversold Level and rising
Sell - Crossunder oversold level and indicator >= oversold level and falling
Neutral - neither Buy nor Sell
Money Flow Index (MFI)
Buy - Crossover Oversold Level and Indicator < Oversold Level and rising
Sell - Crossunder oversold level and indicator >= oversold level and falling
Neutral - neither Buy nor Sell
Commodity Channel Index (CCI)
Buy - Crossover Oversold Level and Indicator < Oversold Level and rising
Sell - Crossunder oversold level and indicator >= oversold level and falling
Neutral - neither Buy nor Sell
Moving Average Convergence/Divergence (MACD)
Buy - values of the main line > values of the signal line and rising
Sell - values of the main line < values of the signal line and falling
Neutral - neither Buy nor Sell
Klinger
Buy - indicator >= 0 and rising
Sell - indicator < 0 and falling
Neutral - neither Buy nor Sell
Average Directional Index (ADX)
Buy - indicator > 20 and +DI line crosses over the -DI line and rising
Sell - indicator > 20 and +DI line crosses below the -DI line and falling
Neutral - neither Buy nor Sell
Awesome Oscillator
Buy - Crossover 0 and values are greater than 0, or exceed the zero line
Sell - Crossunder 0 and values are lower than 0, or fall below the zero line
Neutral - neither Buy nor Sell
Ultimate Oscillator
Buy - Crossover oversold level and indicator < oversold level and rising
Sell - Crossunder oversold level and indicator >= oversold level and falling
Neutral - neither Buy nor Sell
Williams Percent Range
Buy - Crossover Oversold Level and Indicator < Oversold Level and rising
Sell - Crossunder Oversold Level and Indicator >= Oversold Level and falling
Neutral - neither Buy nor Sell
Momentum
Buy - Crossover 0 and indicator levels rising
Sell - Crossunder 0 and indicator values falling
Neutral - neither Buy nor Sell
Total Ratings
The numerical value of the rating "Sell" is 0, "Neutral" is 0 and "Buy" is 1. The total rating is calculated as the average of the ratings of the individual indicators and are determined according to the following criteria:
MaxCount = 12 (depending on whether other oscillators are added).
CompareSellStrong = MaxCount * 0.3
CompareMid = MaxCount * 0.5
CompareBuyStrong = MaxCount * 0.7
value <= CompareSellStrong - Strong Sell
value < CompareMid and value > CompareSellStrong - Sell
value == 6 - Neutral
value > CompareMid and value < CompareBuyStrong - Buy
value >= CompareBuyStrong - Strong Buy
Understanding the results
The Multi Trend Oscillator is designed so that its values fluctuate between 0 and currently 12 (maximum number of integrated indicators). Its values are displayed as a histogram with green, red and gray bars. The bars are gray when the value of the indicator is at half of the number of indicators used, currently 12. Increasingly saturated green bars indicate increasing values above 6, and increasingly saturated red bars indicate increasingly decreasing values below 6.
The table at the end of the histogram shows details (can be activated in the settings) about the overall rating and the individual indicators. Its color is determined by the rating value: gray for neutral, green for buy or strong buy, red for sell or strong sell.
The following alarms are triggered:
Multi Trend Oscillator: Sell
Multi Trend Oscillator: Strong Sell
Multi Trend Oscillator: Buy
Multi Trend Oscillator: Strong Buy

Ichimoku Cloud MasterIchimoku Cloud Master aims to provide the ichimoku trader with easy alert functionality to not miss out on valuable trade setups. The key purpose of this script is to better visualise crucial moments in Ichimoku trading. These alerts should not be used for botting in my opinion as they always need a human to confirm the ichimoku market structure. For example, is the Kijun-Sen flat and too far away from price? A good ichimoku trader will not enter at such a point in time.
Explanation of script:
Chikou(lagging span): pink line, this is price plotted 26 bars ago. People ignore the power of this it is crucial to see how chikou behaves towards past price action as seen in the chart below where we got an entry at red arrow because chikou bounced from past fractal bottom.
Kijun-Sen(base line): Black line or color coded line. This is the equilibrium of last 26 candles. To me this is the most important line in the system as it attracts price.
Kijun = (Highest high of 26 periods + Lowest low of 26 periods) ÷ 2
Tenkan-Sen(conversion line): Blue line. This is the equilibrium of last 9 candles. In a strong uptrend price stays above this line.
Tenkan = (Highest high of 9 periods + Lowest low of 9 periods) ÷ 2
Senkou A (Leading span A)= Pink cloud line, this is the average of the 2 components projected 26 bars in the future.
Senkou A = (Tenkan + Kijun) ÷ 2
Senkou B (Leading span B) = Green cloud line, this is the 52 day equilibrium projected 26 bars in the future.
Senkou B = (Highest high of prior 52 periods + Lowest low of prior 52 periods) ÷ 2
Notice how the distance between Chikou and the cloud is also 52 bars. This is all part of Hosoda's numbers which I am not going to explain here.
Fractals: These are the black triangles you find at key turning point. If you want to know how they work reseach williams fractals. I've used fractals with a period of 9 as it is an ichimoku number. These fractals are useful when working with ichimoku wave theory. Again I will not explain that here but in further education
Fractal Support: Ability to extend lines from the fractals which can be used as an entry/exit mechanism in your trading. For example wait for tenkan to cross kijun and then enter on fractal breakout.
Signals:
Crossing of Chikou (lagging span) with past Kijun-Sen: this will color code the Bars / Kijun-Sen (you can turn this off in options)
The script also has a signal for this, this will be the green and purple diamonds. Where green is bullish and purple is bearish.
wy is this important?
When current price plotted 26 candles back (chikou) crosses over the past equilibrium (kijun-sen) this usualy means price has moved past resistance levels where sellers come in. This indicates a switch in market structure and price is bullish from this point, this is the same in the other direction.
Kumo Twist: when the kumo cloud (future) has a crossover from for example green to red (bull to bear). The script plots these using the colored cross symbols as seen in the picture above. A chikou cross + a Kumo twist at same bar of next to eachother below the cloud can be a great entry sign: this would be an entry after cross in the chart above.
Kijun Bounce: when in an uptrend the price retraces back to Kijun-Sen and starts to go back up. These are marked by the yellow circles as seen in chart below:
low below Kijun-Sen and close above it
Strong Trend: when Tenkan is above Kijun, price above cloud, future cloud green, chikou above close, chikou above Kijun we establish a strong bullish trend. For bearish the exact opposite. The script has a function to send an alert at the start of such trends and to plot them with small colored circles above the bars.
Customisation:
I've added options to disable specific aspects of the indicator for those traders who do not want to use all aspects of the indicator. In the customisation tab I've given each part a clear title so you can use your own colors/shapes.
The perfect entry?
Further info:
Look into my education pane, I will be adding education in the future. The chance of me making a more advanced version of the script including line forecasting etc is rather high so watch out for that.
For those who want to master this system I recommend reading the book:
How to make money with the ichimoku system by Balkrishna M. Sadekar
Or the originals books by Hosoda the inventor of Ichimoku if you can get your hands on them and can read Japanese.
Almost all info about the ichimoku system you find on the internet will lose you money because they reduce the system to simple signals that do not generate money.
I will be providing educational material on tradingview using this indicator.

TRADING MADE SIMPLEThis indicator shows market structure. The standard method of using Williams Highs and Lows as pivots, is something of an approximation.
What's original here is that we follow rules to confirm Local Highs and Local Lows, and strictly enforce that a Low can only follow a confirmed High and vice-versa.
-- Highs and Lows
To confirm a candle as a Local High, you need a later candle to Close below its Low. To confirm a Local Low, you need a Close above its High.
A Low can only follow a High (after it's been confirmed). You can't go e.g High, High, Low, Low, only High, Low, High, Low.
When price makes Higher Highs and Higher Lows, market structure is said to be bullish. When price makes Lower Lows and Lower Highs, it's bearish.
I've defined the in-between Highs and Lows as "Ranging", meaning, neutral. They could be trend continuation or reversal.
-- Bullish/Bearish Breaks
A Bullish break in market structure is when the Close of the current candle goes higher than the previous confirmed Local High.
A Bearish Break is when the Close of the current candle goes lower than the most recent confirmed Local Low.
I chose to use Close rather than High to reduce edge case weirdness. The breaking candle often ends up being a big one, thus the close of that candle can be a poor entry.
You can get live warnings by setting the alert to Options: Only Once, because during a candle, the current price is taken as the Close.
Breaks are like early warnings of a change in market bias, because you're not waiting for a High or Low to be formed and confirmed.
Buy The Dip / Sell The Rally
Buy The Dip is a label I gave to the first Higher Low in a bullish market structure. Sell The Rally is the first Lower High in a bearish market structure.
These *might* be good buying/selling opportunities, but you still need to do your own analysis to confirm that.
== USAGE ==
The point of knowing market structure is so you don't make bullish bets in a bearish market and vice versa -
or if you do at least you're aware that that's what you're doing, and hopefully have some overwhelmingly good reason to do so.
These are not signals to be traded on their own. You still need a trade thesis. Use with support & resistance and your other favourite indicators.
Works on any market on any timeframe. Be aware that market structure will be different on different timeframes.
IMPORTANT: If you're not seeing what you expect, check your settings and re-read this entire description carefully. Confirming Highs and Lows can get deceptively complex.

poopivs [ULTIMATE PIVOT HIGHS AND LOWS]Big thanks to @LudaCode for the missing pivots script. Carried my dumpy trucky badoinkadoink.
This is an elevated pivot script that follows the 3 candle pivot rule (strictly) and does not miss pivots like williams fractals.
Missing pivots marked by transparent circles are derived pivots, giving you a higher resolution for price action.
Colored bars show potential problem areas for pivots (drawing zigzags in particular) and indicate a pivot high and low on the same candle.
Will potentially upgrade this script to include auto zig zags, trend, and intermediate highs and lows finder.
Let me know if you have any suggestions ideas in the comments.
Best,
P

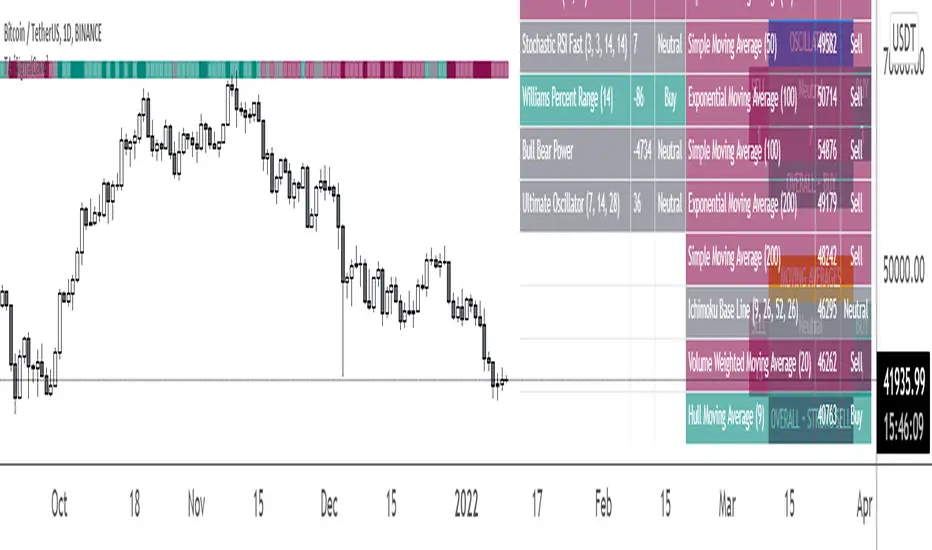
Technical Analysis & Ratings [SignalCave]Technical Analysis, Technical Ratings
Technical analysis display real-time ratings. It based on the most popular technical indicators such as RSI, Stochastic, CCI, ADX, AO, Momentum, MACD, Stochastic RSI, Williams %, Ichimoku Cloud, SMA, EMA, VWMA and HMA.
Technical analysis is a built-in function on TradingView. You can access any asset’s technical analysis page and see it’s performance in real time.
"Technical Analysis & Ratings Indicator" brings this function into your TradingView charting screen. Indicator allows you to see the same output without visiting any external web page in TradingView. Indicator also works on every timeframe and asset class.
Technical Ratings is a technical analysis tool that combines the ratings of several technical indicators to make it easier for traders and investors to find profitable trades.
Technical Ratings can be a valuable technical analysis tool for many analysts or traders. Many traders use a selection of complementary indicators to make better decisions. Technical Ratings simplifies this task by combining the most popular indicators and their signals.
Alerts are available for "Strong Buy, Buy, Natural, Sell and Strong Sell" conditions.
Type asset name on symbol search area.
Adjust your timeframe that you wish to track.
Click "Create Alert"
Select one of the condition that you wish to get inform from create alert panel.
Select "Once Per Bar Close" option.
Click "Create" .
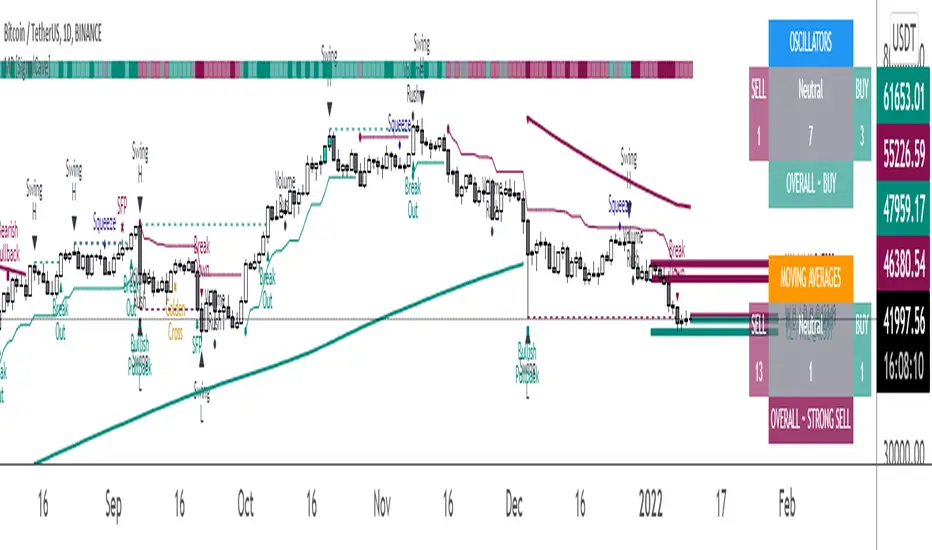
Multi-Purpose All in One [SignalCave]Multi-Purpose All in One Indicator Functions
1) Technical Analysis, Technical Ratings
2) Pivots, Primary & Secondary Trends
3) Swings, Engulfs, Golden & Death Crosses, Price Squeezes, Pullbacks, Breakout & Breakdowns, Volume Rushes
4) Momentum Strength
1) Technical Analysis, Technical Ratings
Technical analysis display real-time ratings. It based on the most popular technical indicators such as RSI, Stochastic, CCI, ADX, AO, Momentum, MACD, Stochastic RSI, Williams %, Ichimoku Cloud, SMA, EMA, VWMA and HMA.
Technical analysis is a built-in function on TradingView. You can access any asset’s technical analysis page and see it’s performance in real time.
"Multi-Purpose All in One" indicator brings this function into your TradingView charting screen. Indicator allows you to see the same output without visiting any external web page in TradingView. Indicator also works on every timeframe and asset class.
Technical Ratings is a technical analysis tool that combines the ratings of several technical indicators to make it easier for traders and investors to find profitable trades.
Technical Ratings can be a valuable technical analysis tool for many analysts or traders. Many traders use a selection of complementary indicators to make better decisions. Technical Ratings simplifies this task by combining the most popular indicators and their signals.
2) Pivots, Primary & Secondary Trends
Helps you to identify primary and secondary trends and potential support/resistance zones.
Trend detection have three modes which are “Aggressive, Moderate and Conservative” . You can customize the mode on settings screen.
3) Swings, Engulfs, Golden & Death Crosses, Price Squeezes, Pullbacks, Breakout & Breakdowns, Volume Rushes
A swing low is when price makes a low and is immediately followed by consecutive higher lows. Likewise, a swing high is when price makes a high and is followed by consecutive lower highs.
Swing Failure Pattern (SFP) is a type of reversal pattern that can be used as buy or sell signals.
Engulfing candles tend to signal a reversal of the current trend in the market. This specific pattern involves two candles with the latter candle 'engulfing' the entire body of the candle before it.
On this indicator, bullish engulfs visible only on downtrend and oversold conditions. Bearish engulfs visible only on uptrend and overbought conditions.
The death cross and golden cross are technical analysis terms for when a moving average (MA) intersects with another from either above or below.
The cross, depending on which it is, can signal the start of a new trend or the end of one.
Squeeze signs signifies low volatility, market preparing itself for an explosive move up or down direction.
Bullish Pullbacks are widely seen as buying opportunities after an asset has experienced a large upward price movement. Most pullbacks involve an asset's price moving to an area of technical support , such as a moving average, before resuming their uptrend.
Bearish Pullbacks are widely seen as selling opportunities after an asset has experienced a large downward price movement. Most pullbacks involve an asset's price moving to an area of technical resistance , such as a moving average, before resuming their downtrend.
A breakout refers to when the price of an asset moves above a resistance area, breakdown refers to when the price of an asset moves below a support area.
Breakouts/breakdowns indicate the potential for the price to start trending in the breakout direction.
For example, a breakout to the upside from a chart pattern could indicate the price will start trending higher.
Volume rush signs appears when the trading volume increases more then a usual period. It can be useful with combining breakout signals as a confirmation.
4) Momentum Strength
Momentum Indicator helps you to identify potential reversal areas .
Calculation done with using Relative Strength Index (RSI), Money Flow Index (MFI) and Average Directional Movement Index (ADX) indicators.
On full strength bearish movement bars paints as light red , full strength bullish movement bars paints as light green color.
They indicates that trend can be change to opposite direction in a short period of time.
Momentum Strength have three modes which are "Aggressive, Moderate and Conservative" . You can customize the mode on settings screen.
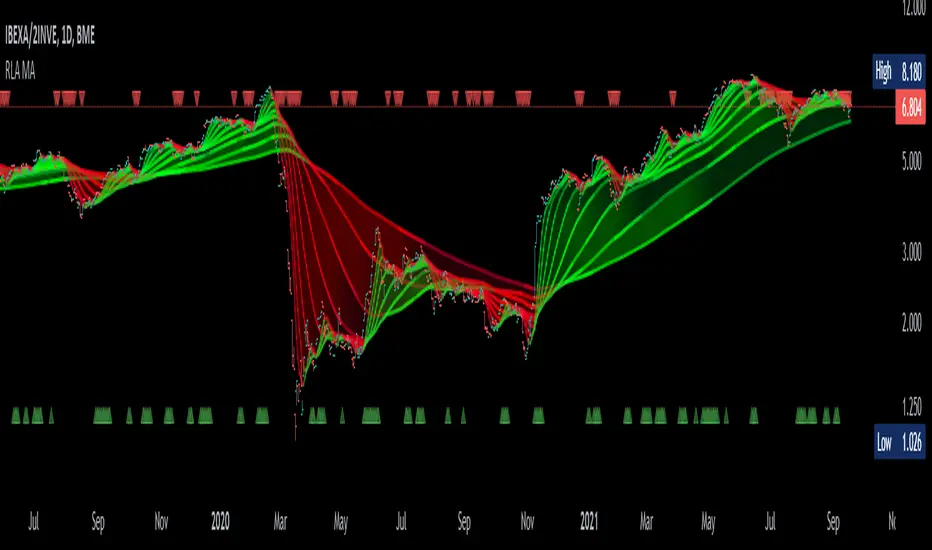
Meu Script 44My script 44.
The indicator uses 4 Arnaud Legaux moving averages calibrated by myself. It uses the following periods 17, 72 ,305 and 1292.
It is based on the work of Bo Williams (PhiCube) and the fractal 5-3.
When the moving averages are aligned up 17 > 72 > 305 > 1292 look for a buy. Above the green region or inside the green region.
When the moving averages are aligned down 17 < 72 < 305 < 1292 look for a sell. Under the green region or inside the green region.
If between the MAs wait for the end of the consolidation.
The color show in a diferent manner the moving averages and the regions proper to trade and to avoid.

Trendalix EntriesThis script is made to simplify the analysis of trends. It changes the mas based on whether you're looking at stocks or crypto. As these 2 markets currently move differently, they need a slightly different approach.
Crypto trends:
Can move much faster than stocks. Ideally the price should be bouncing above the williams alligators (about the 20-30 MAs).
Stocks:
These swing more than crypto so you need to get deep into these swing to be buying at the bottom of a move. The MAs are much larger, between the 50ma and 400ma. It's much more important here that the slower MAs are strong, i.e 200ma is above the 400ma, than it is that the faster MAs are okay.
For stocks an entry and stop line is drawn. These are only visible when the market is sufficiently in a pullback.

Smart Swing Strategy for StockSpecial indicator for stock but you can try another instrument.
Trend determination and buy/sell signals are using the Alligator system from Bill Williams .
To get maximum profit, the system uses the trailing stop technique using Average True Range (ATR) with 4 moving average options (RMA, SMA , EMA , WMA ).
Please leave comments if any opinions.
Disclaimer
The content is in any event provided with the intention of being for general circulation and availability only. As such it is not intended to and does not form part of any offer or recommendation directed at you specifically, or have any regard to your investment objectives, financial situation, or needs of yourself or any other specific person. Before committing to a trade or investment, please seek advice from financial or other professional advisers regarding the suitability of the trade for you. If you do not wish to seek such financial advice, please consider carefully whether the product is suitable for you as you alone remain responsible for your trading gains and losses.

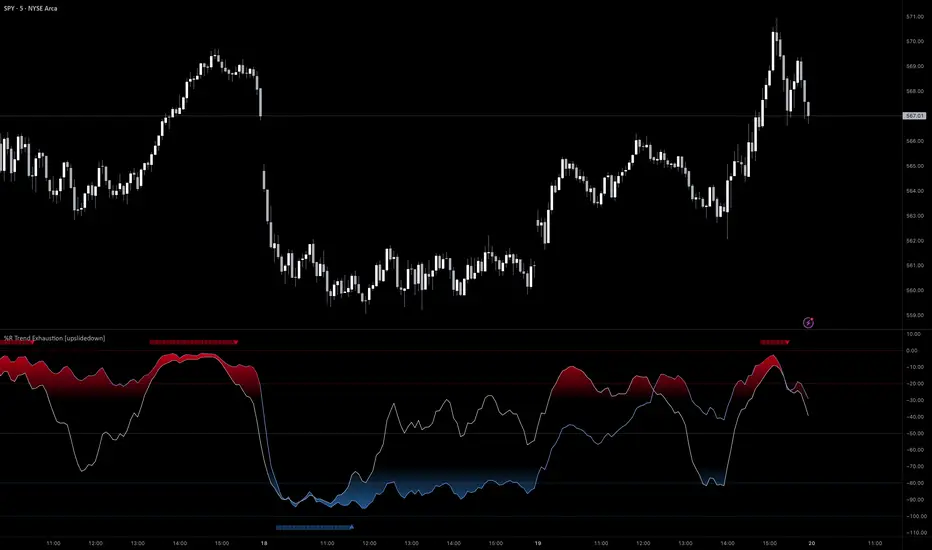
%R Trend Exhaustion [upslidedown]I love Williams %R! This indicator mixes two %R periods... a standard %R with a longer period %R. The longer period of 112 has interesting results for trend following strategies in the crypto market through backtesting.
Alone these are fairly ordinary but together they provide a very interesting trend exhaustion/reversal system while filtering out some noise. I have highlighted key areas of interest with filled boxes. An "area of interest" is when there is confluence between the short and long period %R values along with being overbought or oversold. Once there is a break in the overbought or oversold trend, an arrow will print.
This is one of my odder ideas that appears to have some merit and detects interesting tops or bottoms (or confirms a trend reversal) so I'm publicly publishing for the community to find. If you find this useful please reach out and let me know how you use it as it's fairly unique... and thus different than anything I've ever seen or used.
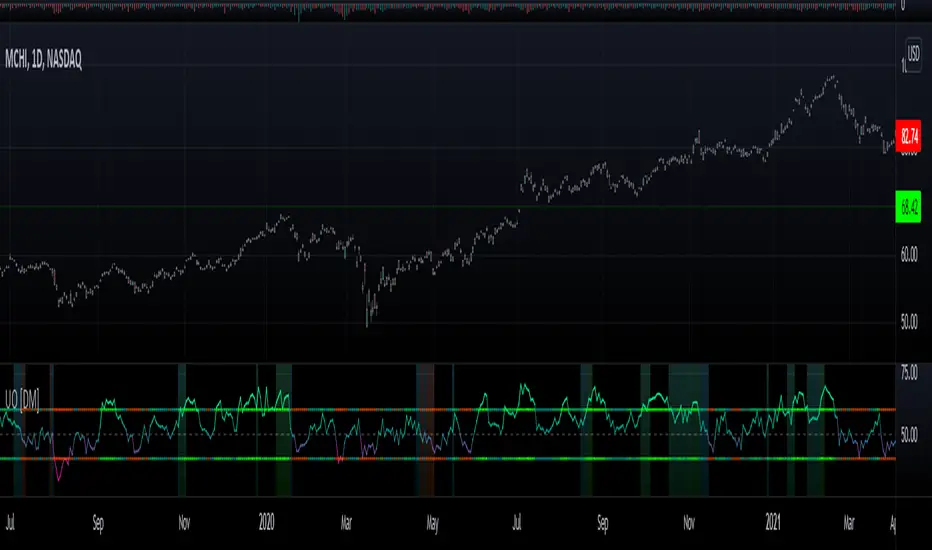
Willians Ultimate Oscillator [DM]Hello colleagues
I share the Williams Ultimate Oscillator
You can select betwen:
1.Average signal of 9 lengths (3 X UO).
2. Three independent signals UO.
You can also customize the oversold and oversold bands.
Some alerts were added.
The gradient colors of the background warn us of a squeeze in the movement of the indicator.
If there is something that can be improved (it is certain that it is) please leave it in comments.
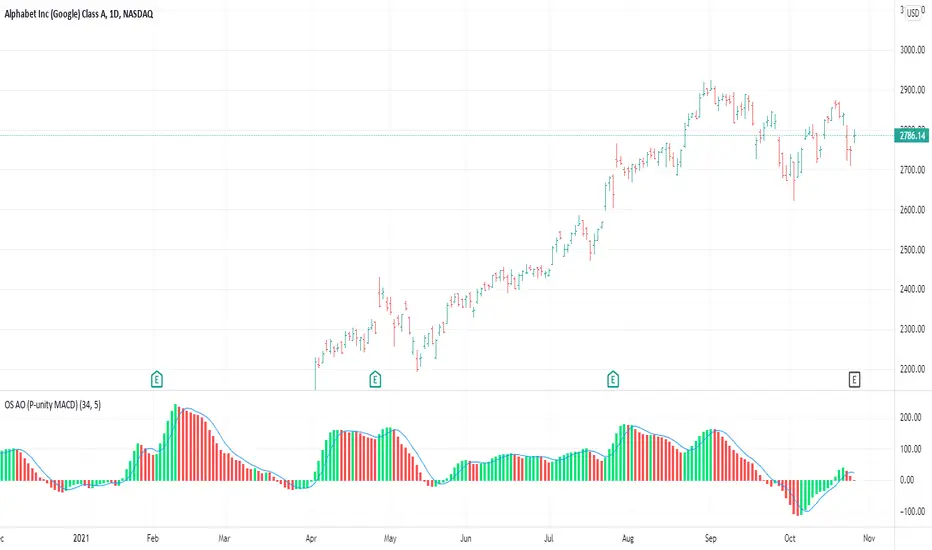
OS AO (P-unity MACD)This is both the Awesome Oscillator (AO) as described in New Trading Dimensions ( NTD , book by Bill Williams ), and the Profitunity MACD described in the first edition of Trading Chaos.
The calculation for both is the same. In this case I added the 5 day SMA which is the blue line. The difference between the blue line and the AO is the AC which is also described in NTD and is usually plotted in a different indicator (AC).
This is the base for the following signals:
Zone Bar
2nd Wise Man
The signals are triggered and shown on the main chart screen through the use of OS Alligator . This indicator (AO) provides further insight in analyzing those signals by reading the AO, its current position and evolution directly.
Rainbow FractalsThis Indicator uses the Bill Williams Fractals with coloring based on the Peak High/Low of the most recent RSI Value.
This helps quickly identify RSI bearish and bullish divergence without having a RSI lower indicator loaded onto the chart.
When the RSI is between 40 and 60 no fractals are posted. Lighter colored fractals are closer to a RSI value of 50 and darker fractals or further away from a RSI value of 50.

Argo I (alerts for 3commas single bots)This script lets users create BUY/SELL alerts for 3commas single bots in a simple way, based on a built in set of indicators that can be tweaked to work together or separately through the study settings. Indicators include Bollinger Bands, Williams %R, RSI, EMA, SMA , Market Cipher, Inverse Fisher Transform.
If the user choses to create both BUY and SELL signals from the study settings, the alert created will send both BUY and SELL signals for the selected pair. Note the script will only send alerts for the pair selected in the study settings, not for the current chart (if different).
How to use:
- Add the script to the current chart
- Open the study settings , insert bot details. Pairs MUST be in capital letters or 3commas will not recognize them.
- Still in the study settings, tweak the deal start/close conditions from various indicators until happy. The study will plot the entry / exit points below the current chart (1 = buy, 2 = sell)
- Ideally, test the settings with a backtesting script. The present script is compatible with the Trading Parrot's backtester.
- When happy, right click on the "..." next to the study name, then "Add alert'".
- Under "Condition", on the second line, chose "Any alert () function call". Add the webhook from 3commas, give it a name, and "create".
Happy tweaking!

Compound Moving Average [DM]Greetings Colleagues
We always have a problem with the type of moving average and how it is used, here are the two classics that I like the most "together".
I share a moving average composed of:
3 exponential moving averages
3 weighted moving averages
For the initial calculation, the weight has been distributed using the Williams Ultimate Oscillator ultimate oscillator technique but I have added an input to be able to balance the load

TradeGuider VSA Relative VolumeThe TradeGuider VSA Lite package is designed for those traders who want to trade in harmony with the professionals (‘smart money’) and is based on Tom Williams’ Volume Spread Analysis methodology ( VSA ). It works in any market and any time frame. The trader can use it as a standalone toolkit to support their trading decisions, or in conjunction with other trading tools to obtain additional confirmations.
The package consists of two parts:
TradeGuider VSA Lite indicator
TradeGuider Relative Volume indicator
Together with the TradeGuider VSA Lite indicator, the TradeGuider VSA Relative Volume indicator helps to determine the interaction between supply and demand as well as assisting traders in their trading decisions. In the VSA methodology all analysis is based on Relative Volume . This means that the exact values of the volume on the price bars are not nearly as important as their volume in relation to the previous volume bars. The following classifications of Relative Volume are used in VSA:
Ultra High Volume
Very High Volume
High Volume
Average Volume
Low Volume
Very Low Volume
Users can easily see how any volume bar is classified by observing which color band in the volume indicator is reached by the top of any given volume bar.
Price bars where the volume is Ultra High very often begin the VSA Setup, while price bars on Low or Very Low Volume can be the confirmation and end the VSA Setup.
Using this indicator, users may also observe bullish (when price falls and volume decreases) and bearish (when price rises and volume decreases) behavior.
See the Author's instructions below to get access to this package and the accompanying documentation.

TradeGuider VSA LiteThe TradeGuider VSA Lite package is designed for those traders who want to trade in harmony with the professionals (‘smart money’) and is based on Tom Williams’ Volume Spread Analysis methodology (VSA). It works in any market and any time frame. The trader can use it as a standalone toolkit to support their trading decisions, or in conjunction with other trading tools to obtain additional confirmations.
The package consists of two parts:
TradeGuider VSA Lite indicator
TradeGuider Relative Volume indicator
The TradeGuider VSA Lite indicator provides information about the imbalance between supply and demand on the price charts via VSA principles. The VSA principles introduced in this indicator can be divided into two groups: Signs of Strength (SOS) and Signs of Weakness (SOW). The following six VSA principles are implemented:
SOSs: Potential Professional Buying (PB), Shakeout (SO), Test (TE)
SOWs: Potential Professional Selling (PS), Upthrust (UT), No Demand (ND)
VSA principles ARE NOT BUY and SELL SIGNALS on their own, but in combination may create VSA Setups to the long and short sides which are used in the VSA methodology to identify low-risk entries into, and optimal exits from, a trade.
A potential VSA Setup to the long side means that strength is presented on that particular chart at the current moment and the following conditions are present:
Potential Professional Buying (PB) is found in the background.
The price has risen above the high of the Potential Professional Buying (PB).
The price behavior has changed to the upside (the Short Term Trending Tool is changing color from red to gray or green).
The confirmation (a Test) is identified.
With a VSA Setup to the long side and strength on higher time frames, the price very often moves higher and the user may trade it.
A potential VSA Setup to the short side means that weakness is presented on that particular chart at the current moment and the following conditions are present:
Potential Professional Selling (PS) is found in the background.
The price has moved below the low of the Potential Professional Selling (PS).
The price behavior has changed to the downside (the Short Term Trending Tool is changing color from green to gray or red).
The confirmation (a No Demand) is identified.
With a VSA Setup to the short side and weakness on higher time frames, the price very often moves lower and the user may trade it.
The TradeGuider VSA Lite indicator is equipped with alerts which, when set, inform users of VSA Setups as they appear.
See the Author's instructions below to get access to this package and the accompanying documentation.
DISCLAIMER: The TradeGuider VSA Lite package is developed for educational purposes only. None of the content including the alerts should be considered as financial or investment advice. Investments are always made at your own risk and are based on your personal evaluations. We cannot be held responsible for any losses you may have. Please trade sensibly and carefully and only when you have a clear understanding of what is happening in the markets.

Alma Moving Average Ribbon Reverse Length [DM]Greetings Colleagues
Following some recommendations and ideas I share this moving average, put all of them together
The length calculation is automatic there is only one input.
The length is inverse so it will wrap from the longest reference point, hence using phi
Moving averages will wrap around the price.
I've also added gradient color to plots and fill plots
There is an alert selector in case you are interested in a particular crossing, "remember that the order is reversed".
There is an alert visual plotshapes with offset signal.
Finally, after spending a few hours with the Williams alligator moving averages I found nothing special, but I added the individual offset adjustment for each moving average in case someone comes up with something.
Enjoy”
Some references about alma by "tradingview pinecoders"
What to look for
The Arnaud Legoux Moving Average has three elements to it:
Window: This element is the period. By default, the window is set to 9 periods, but it can be customized to fit any trading style.
Offset: This element is the Gaussian that is applied to the combo line and can be aligned to the current price. It’s default is set to 0.85, but by setting it to 1, you can make it align fully to the current price (similar to how an Exponential Moving Average (EMA) with a setting of 0 is like a Simple Moving Average (SMA)). 0.85 is what is recommended, however, you can customize it like with the window element.
Sigma: This element is a standard deviation that is applied to the combo line in order for it to appear more sharp. The default is set to 6 and it is not recommended to change the setting. The value of 6 is inspired by the Six Sigma process.
www.tradingview.com