Economic Crises by @zeusbottradingEconomic Crises Indicator by @zeusbottrading
Description and Use Case
Overview
The Economic Crises Highlight Indicator is designed to visually mark major economic crises on a TradingView chart by shading these periods in red. It provides a historical context for financial analysis by indicating when major recessions occurred, helping traders and analysts assess the performance of assets before, during, and after these crises.
What This Indicator Shows
This indicator highlights the following major economic crises (from 1953 to 2020), which significantly impacted global markets:
• 1953 Korean War Recession
• 1957 Monetary Tightening Recession
• 1960 Investment Decline Recession
• 1969 Employment Crisis
• 1973 Oil Crisis
• 1980 Inflation Crisis
• 1981 Fed Monetary Policy Recession
• 1990 Oil Crisis and Gulf War Recession
• 2001 Dot-Com Bubble Crash
• 2008 Global Financial Crisis (Great Recession)
• 2020 COVID-19 Recession
Each of these periods is shaded in red with 80% transparency, allowing you to clearly see the impact of economic downturns on various financial assets.
How This Indicator is Useful
This indicator is particularly valuable for:
✅ Comparative Performance Analysis – It allows traders and investors to compare how different assets (e.g., Gold, Silver, S&P 500, Bitcoin) performed before, during, and after major economic crises.
✅ Identifying Market Trends – Helps recognize recurring patterns in asset price movements during times of financial distress.
✅ Risk Management & Strategy Development – Understanding how markets reacted in the past can assist in making better-informed investment decisions for future downturns.
✅ Gold, Silver & Bitcoin as Safe Havens – Comparing precious metals and cryptocurrencies against traditional stocks (e.g., SPY) to analyze their performance as hedges during economic turmoil.
How to Use It in Your Analysis
By overlaying this indicator on your Gold, Silver, SPY, and Bitcoin chart (for example), you can quickly spot historical market reactions and use that insight to predict possible behaviors in future downturns.
⸻
How to Apply This in TradingView?
1. Click on Use on chart under the image.
2. Overlay it with Gold ( OANDA:XAUUSD ), Silver ( OANDA:XAGUSD ), SPY ( AMEX:SPY ), and Bitcoin ( COINBASE:BTCUSD ) for comparative analysis.
⸻
Conclusion
This indicator serves as a powerful historical reference for traders analyzing asset performance during economic downturns. By studying past crises, you can develop a data-driven investment strategy and improve your market insights. 🚀📈
Let me know if you need any modifications or enhancements!
חפש סקריפטים עבור "xauusd黄金实时价格"

Shavarie's MCV IndicatorShavarie's MCV Indicator (MACD + CCI + Volume Delta) is a custom-built trend-following and volume-based indicator that helps traders confirm market direction with high accuracy. It combines the MACD (Moving Average Convergence Divergence), CCI (Commodity Channel Index), and Volume Delta, ensuring that all three indicators align before making a trading decision. The goal is to filter out false signals and provide high-probability trade setups.
History & Development
Shavarie's MCV Indicator was developed by Shavarie Gordon, an experienced swing trader, to improve trend confirmation on Gold (XAUUSD) and other markets. After testing various indicators, Shavarie discovered that MACD, CCI, and Volume Delta together provide the best combination of trend strength, momentum, and real-time volume flow. This indicator was designed to eliminate lagging signals, improve win rates, and enhance market timing for both swing and scalping strategies.
How It Works & Calculations
MACD (Moving Average Convergence Divergence)
Measures momentum and trend strength using the difference between a 12-period EMA and a 26-period EMA.
The MACD line and Signal line crossover confirms buy/sell signals.
A rising MACD histogram confirms bullish strength, while a falling histogram confirms bearish strength.
CCI (Commodity Channel Index)
Measures how far the price is from its statistical average.
Above +100 → Overbought (strong trend continuation or reversal).
Below -100 → Oversold (strong trend continuation or reversal).
When CCI aligns with MACD, it confirms momentum strength.
Volume Delta
Measures the difference between buying and selling volume in real time.
A positive delta means more aggressive buying (bullish).
A negative delta means more aggressive selling (bearish).
Helps confirm MACD and CCI trends by showing real volume strength.
Key Takeaways & Features
✅ No false signals: All three indicators must align before entering a trade.
✅ Trend confirmation: Ensures momentum and volume agree before trading.
✅ Works on multiple timeframes: Designed for swing trading on the daily and scalping on 45 min + 5 min.
✅ Great for Gold & Metals: Optimized for XAUUSD, XAUJPY, XAU/AUD, and possibly Palladium (XPDUSD).
✅ Custom-built by a professional trader: Developed by Shavarie Gordon after extensive testing.
Summary
Shavarie’s MCV Indicator is a powerful and reliable trading tool that combines momentum, trend, and volume analysis. By ensuring that MACD, CCI, and Volume Delta align, it eliminates false signals and increases trade accuracy. Whether used for swing trading or scalping, this indicator helps traders enter high-probability trades with confidence.

Twitter Model ICT [TradingFinder] MMXM ERL D + FVG + M15 MSS/SMT🔵 Introduction
The Twitter Model ICT is a trading approach based on ICT (Inner Circle Trader) models, focusing on price movement between external and internal liquidity in lower timeframes. This model integrates key concepts such as Market Structure Shift (MSS), Smart Money Technique (SMT) divergence, and CISD level break to identify precise entry points in the market.
The primary goal of this model is to determine key liquidity levels, such as the previous day’s high and low (PDH/PDL) and align them with the Fair Value Gap (FVG) in the 1-hour timeframe. The overall strategy involves framing trades around the 1H FVG and using the M15 Market Structure Shift (MSS) for entry confirmation.
The Twitter Model ICT is designed to utilize external liquidity levels, such as PDH/PDL, as key entry zones. The model identifies FVG in the 1-hour timeframe, which acts as a magnet for price movement. Additionally, traders confirm entries using M15 Market Structure Shift (MSS) and SMT divergence.
Bullish Twitter Model :
In a bullish setup, the price sweeps the previous day’s low (PDL), and after confirming reversal signals, buys are executed in internal liquidity zones. Conversely, in a bearish setup, the price sweeps the previous day’s high (PDH), and after confirming weakness signals, sells are executed.
Bearish Twitter Model :
In short setups, entries are only executed above the Midnight Open, while in long setups, entries are taken below the Midnight Open. Adhering to these principles allows traders to define precise entry and exit points and analyze price movement with greater accuracy based on liquidity and market structure.
🔵 How to Use
The Twitter Model ICT is a liquidity-based trading strategy that analyzes price movements relative to the previous day’s high and low (PDH/PDL) and Fair Value Gap (FVG). This model is applicable in both bullish and bearish directions and utilizes the 1-hour (1H) and 15-minute (M15) timeframes for entry confirmation.
The price first sweeps an external liquidity level (PDH or PDL) and then provides an entry opportunity based on Market Structure Shift (MSS) and SMT divergence. Additionally, the entry should be positioned relative to the Midnight Open, meaning long entries should occur below the Midnight Open and short entries above it.
🟣 Bullish Twitter Model
In a bullish setup, the price first sweeps the previous day’s low (PDL) and reaches an external liquidity level. Then, in the 1-hour timeframe (1H), a bullish Fair Value Gap (FVG) forms, which serves as the price target.
To confirm the entry, a Market Structure Shift (MSS) in the 15-minute timeframe (M15) should be observed, signaling a trend reversal to the upside. Additionally, SMT divergence with correlated assets can indicate weakness in selling pressure.
Under these conditions, a long position is taken below the Midnight Open, with a stop-loss placed at the lowest point of the recent bearish move. The price target for this trade is the FVG in the 1-hour timeframe.
🟣 Bearish Twitter Model
In a bearish setup, the price first sweeps the previous day’s high (PDH) and reaches an external liquidity level. Then, in the 1-hour timeframe (1H), a bearish Fair Value Gap (FVG) is identified, serving as the trade target.
To confirm entry, a Market Structure Shift (MSS) in the 15-minute timeframe (M15) should form, signaling a trend shift to the downside. If an SMT divergence is present, it can provide additional confirmation for the trade.
Once these conditions are met, a short position is taken above the Midnight Open, with a stop-loss placed at the highest level of the recent bullish move. The trade's price target is the FVG in the 1-hour timeframe.
🔵 Settings
Bar Back Check : Determining the return of candles to identify the CISD level.
CISD Level Validity : CISD level validity period based on the number of candles.
Daily Position : Determines whether only the first signal of the day is considered or if signals are evaluated throughout the entire day.
Session : Specifies in which trading sessions the indicator will be active.
Second Symbol : This setting allows you to select another asset for comparison with the primary asset. By default, "XAUUSD" (Gold) is set as the second symbol, but you can change it to any currency pair, stock, or cryptocurrency. For example, you can choose currency pairs like EUR/USD or GBP/USD to identify divergences between these two assets.
Divergence Fractal Periods : This parameter defines the number of past candles to consider when identifying divergences. The default value is 2, but you can change it to suit your preferences. This setting allows you to detect divergences more accurately by selecting a greater number of candles.
The indicator allows displaying sessions based on various time zones. The user can select one of the following options :
UTC (Coordinated Universal Time)
Local Time of the Session
User’s Local Time
Show Open Price : Displays the New York market opening price.
Show PDH / PDL : Displays the previous day’s high and low to identify potential entry points.
Show SMT Divergence : Displays lines and labels for bullish ("+SMT") and bearish ("-SMT") divergences.
🔵 Conclusion
The Twitter Model ICT is an effective approach for analyzing and executing trades in financial markets, utilizing a combination of liquidity principles, market structure, and SMT confirmations to identify optimal entry and exit points.
By analyzing the previous day’s high and low (PDH/PDL), Fair Value Gaps (FVG), and Market Structure Shift (MSS) in the 1H and M15 timeframes, traders can pinpoint liquidity-driven trade opportunities. Additionally, considering the Midnight Open level helps traders avoid random entries and ensures better trade placement.
By applying this model, traders can interpret market movements based on liquidity flow and structural changes, allowing them to fine-tune their trading decisions with higher precision. Ultimately, the Twitter Model ICT provides a structured and logical approach for traders who seek to trade based on liquidity behavior and trend shifts in the market.

TTZConcept GOLD XAUUSD Lot CalculatorThe Gold Lot Size Calculator for XAU/USD on TradingView is a powerful and user-friendly tool designed by TTZ Concept to help traders calculate the optimal lot size for their Gold trades based on their account size, risk tolerance, and the price movement of Gold (XAU/USD). Whether you're a beginner or an experienced trader, this tool simplifies position sizing, ensuring that your trades align with your risk management strategy.
Key Features:
Accurate Lot Size Calculation: Calculates the optimal lot size for XAU/USD trades based on your specified account balance and the percentage of risk per trade.
Flexible Risk Management**: Input your desired risk percentage (e.g., 1%, 2%) to ensure that you are not risking more than you're comfortable with on any single trade.
Customizable Inputs: Enter your account balance, risk percentage, stop loss (in pips), and leverage to get an accurate lot size recommendation.
Real-Time Data The tool uses real-time Gold price data to calculate the position size, ensuring that your risk management is always up to date with market conditions.
-Simple Interface: With easy-to-use sliders and input fields, you can quickly adjust your parameters and get the required lot size in seconds.
No Complicated Calculations Automatically factors in the pip value and contract specifications for XAU/USD, eliminating the need for manual calculations.
How It Works:
1. Input your trading account balance: The tool calculates based on your total equity.
2. Set your risk percentage: Choose how much of your account you want to risk on a single trade.
3. Define your stop loss in pips: Specify the distance of your stop loss from the entry point.
4. Get your recommended lot size: Based on your inputs, the tool will calculate the ideal lot size for your trade.
Why Use This Tool?
Precise Risk Management: Take control of your trading risk by ensuring that each trade is positioned according to your risk tolerance.
Save Time: No need for manual calculations — let the calculator handle the complex math and focus on your strategy.
Adapt to Changing Market Conditions: As the price of Gold (XAU/USD) fluctuates, your lot size adapts to ensure consistent risk management across different market conditions.
Perfect for:
- Gold traders (XAU/USD)
- Beginners seeking to understand position sizing and risk management
- Experienced traders looking to streamline their trading process
- Anyone who trades Gold futures, CFDs, or spot Gold in their trading account

Candle Ratio Alert**Candle Ratio Alert System for Multi-Pair, 5-Minute Charts**
This Pine Script indicator is designed for traders who want to monitor specific candle patterns across multiple assets on a 5-minute timeframe. The tool calculates the ratio of the candle's body size to its total wick size, allowing you to identify significant candles based on their structure. It is ideal for strategies that rely on candlestick analysis, such as breakout or reversal trading.
### Key Features:
1. **Customizable Threshold**: Set the body-to-wick ratio using an input slider, ensuring flexibility to match your strategy.
2. **Visual Alerts**: The script plots a purple marker above candles that meet the specified criteria, making it easy to spot qualifying patterns at a glance.
3. **Dynamic Alerts**: Integrated alert functionality notifies you via email or app when a candle satisfies the ratio condition. Alerts include the asset's ticker and timeframe for quick action.
4. **Multi-Pair Capability**: Compatible with assets like XAUUSD, BTCUSD, EURUSD, and GBPUSD, making it versatile for Forex and cryptocurrency trading.
### How It Works:
The script calculates the body size and total wick size of each candle. If the ratio exceeds the user-defined threshold, the script triggers a visual marker and sends an alert. The 5-minute timeframe ensures rapid identification of trading opportunities in volatile markets.
With its intuitive interface and powerful alert system, this tool streamlines your trading workflow, helping you stay focused on key market movements. Perfect for both beginners and experienced traders seeking precision and efficiency in their analysis.

Smart Wick Concept (SWC)Smart Wick Concept (SWC)
The Smart Wick Concept (SWC) is a unique trend-following strategy designed to capture precise entry points in trending markets. This indicator identifies trade opportunities based on higher timeframe trends and wick behavior on lower timeframes, making it an effective tool for intraday and swing traders.
Key Features:
Trend Identification:
SWC uses the H1 timeframe to define the primary market trend (bullish or bearish), ensuring alignment with the overall market direction.
Precise Entry Signals:
Entry opportunities are generated on the M15 timeframe when a candle's wick interacts with the prior candle's range. This approach minimizes false signals and enhances accuracy.
Stop Loss and Take Profit Levels:
The indicator automatically calculates suggested stop loss and take profit levels based on market dynamics, providing traders with a clear risk-reward framework.
Customizable Parameters:
SWC allows traders to adjust key settings, such as the higher timeframe and minimum trend range, to align with their trading preferences and market conditions.
How It Works:
Bullish Entry:
Higher timeframe trend must be bullish.
A M15 candle must dip below the previous candle’s low and close back above it, signaling a potential buy opportunity.
Bearish Entry:
Higher timeframe trend must be bearish.
A M15 candle must exceed the previous candle’s high and close back below it, signaling a potential sell opportunity.
Risk Management:
Stop loss is placed at the low (for buys) or high (for sells) of the current M15 candle.
Take profit targets are calculated at twice the risk, ensuring a favorable risk-reward ratio.
Benefits:
Aligns trades with market momentum.
Reduces noise by filtering out weak or sideways trends.
Provides a structured approach to trading XAUUSD and other volatile instruments.
Use Cases:
The Smart Wick Concept is ideal for traders looking for a disciplined and data-driven approach to trading. While it is optimized for XAUUSD, it can also be applied to other trending markets such as major currency pairs or indices with some parameter adjustments.
Disclaimer:
This indicator is a trading tool and should not be used as a standalone strategy. Always backtest the indicator thoroughly and use proper risk management to protect your capital. Past performance does not guarantee future results.

Fractal levels Gold [AstroHub]This indicator detects key fractal points on a price chart and visually marks them with shapes and levels. It helps traders identify potential reversal zones and dynamic support/resistance levels, enhancing market analysis.
Key Features:
Fractal Detection:
The indicator identifies top and bottom fractals using a 5-bar pattern.
A top fractal forms when the middle bar has a higher high compared to the two bars on either side.
A bottom fractal forms when the middle bar has a lower low compared to the two bars on either side.
Fractal Filtering:
The indicator can filter out "pristine" fractals (uninterrupted fractal patterns) based on custom conditions, making it more selective and reducing false signals.
Fractal Plotting:
are plotted as downward triangles.
are plotted as upward triangles.
Users can choose to display or hide fractal points and their corresponding labels.
Fractal Levels:
The indicator automatically plots fractals' levels on the chart, marking potential resistance and support zones.
Fractal levels change dynamically as new fractals are identified.
Customizable Display Options:
Show or hide fractals and levels with adjustable settings.
Choose whether to apply filtering for pristine fractals.
Display the pivot labels to easily track fractal positions.
How It Works:
The indicator uses a simple approach to recognize top and bottom fractals . When a valid fractal is detected, it highlights it on the chart and plots the corresponding price level.
By default, top fractals are shown above the bars (red color), and bottom fractals are shown below the bars (green color).
Fractal levels represent potential reversal points and can act as dynamic support and resistance zones.
Best Use:
The indicator is particularly useful in identifying reversal points and trend changes, helping traders to spot key price levels.
It can be used across various timeframes and markets, particularly for trend-following or reversal strategies.
Customizable Settings:
Show Pivots: Toggle the display of pivot points.
Show Pivot Labels: Display labels for pivot levels.
Show Fractals: Toggle fractal points on the chart.
Show Fractal Levels: Show or hide the levels corresponding to the detected fractals.
Filter for Pristine Fractals: Enable this option to filter out non-pristine fractals for higher accuracy.
Conclusion:
This indicator provides clear, actionable fractal signals, helping traders easily identify critical levels for entry and exit. With customizable settings and visual cues, it's suitable for both novice and expe

Precision Trading Strategy: Golden EdgeThe PTS: Golden Edge strategy is designed for scalping Gold (XAU/USD) on lower timeframes, such as the 1-minute chart. It captures high-probability trade setups by aligning with strong trends and momentum, while filtering out low-quality trades during consolidation or low-volatility periods.
The strategy uses a combination of technical indicators to identify optimal entry points:
1. Exponential Moving Averages (EMAs): A fast EMA (3-period) and a slow EMA (33-period) are used to detect short-term trend reversals via crossover signals.
2. Hull Moving Average (HMA): A 66-period HMA acts as a higher-timeframe trend filter to ensure trades align with the overall market direction.
3. Relative Strength Index (RSI): A 12-period RSI identifies momentum. The strategy requires RSI > 55 for long trades and RSI < 45 for short trades, ensuring entries are backed by strong buying or selling pressure.
4. Average True Range (ATR): A 14-period ATR ensures trades occur only during volatile conditions, avoiding choppy or low-movement markets.
By combining these tools, the PTS: Golden Edge strategy creates a precise framework for scalping and offers a systematic approach to capitalize on Gold’s price movements efficiently.

faiz MACDMACD: Moving Average Convergence Divergence
The Moving Average Convergence Divergence (MACD) is a popular momentum indicator used in technical analysis to gauge the strength, direction, and potential reversal points of a trend in a financial asset's price movement. Developed by Gerald Appel in the late 1970s, MACD is particularly favored by traders for its ability to capture both trend-following and momentum aspects of price behavior.
Components of the MACD
The MACD is derived from two exponential moving averages (EMAs) of a security's price:
MACD Line: This is the difference between the 12-day and 26-day EMAs. The shorter 12-day EMA reacts more quickly to price changes, while the 26-day EMA smooths out price fluctuations, offering a longer-term perspective.
Formula: MACD Line = 12-day EMA - 26-day EMA
Signal Line: This is the 1-day EMA of the MACD Line itself. The signal line is used to generate buy and sell signals when it crosses the MACD line.
Formula: Signal Line = 1-day EMA of the MACD Line
MACD Histogram: The histogram represents the difference between the MACD Line and the Signal Line. It is displayed as bars that oscillate above and below a zero line, helping to visualize the convergence or divergence between the two lines.
Formula: Histogram = MACD Line - Signal Line
Interpretation of MACD
The MACD indicator is used to identify potential buy and sell signals based on the following observations:
MACD Line and Signal Line Crossovers:
Bullish Crossover: A buy signal occurs when the MACD Line crosses above the Signal Line. This suggests that the momentum is shifting in favor of the bulls, indicating a potential upward price movement.
Bearish Crossover: A sell signal occurs when the MACD Line crosses below the Signal Line. This suggests a bearish trend may be emerging, signaling a potential downward movement.
Divergence:
Bullish Divergence: Occurs when the price of the asset is making new lows, but the MACD is forming higher lows. This suggests that the downward momentum is weakening and a potential reversal to the upside may be imminent.
Bearish Divergence: Occurs when the price is making new highs, but the MACD is forming lower highs. This suggests that the upward momentum is weakening and a reversal to the downside may occur.
Only use it in timeframe m1, and solely use for XAUUSD pair.
Advisable to use it as a confirmation with other indicator such as
BBMA, SMC, SUPPORT RESISTANCE, SUPPLY AND DEMAND.
how to use :
MA 5 Crossing above MA9, will generate BUY signals
MA 5 Crossing below MA9, will generate SELL signals
Trade at your own SKILLS.
I dont mind people using this script for free.
All I want is just prayer for me and my family success.
Thank You and Have a nice and pleasant day :-)

Gold Friday Anomaly StrategyThis script implements the " Gold Friday Anomaly Strategy ," a well-known historical trading strategy that leverages the gold market's behavior from Thursday evening to Friday close. It is a backtesting-focused strategy designed to assess the historical performance of this pattern. Traders use this anomaly as it captures a recurring market tendency observed over the years.
What It Does:
Entry Condition: The strategy enters a long position at the beginning of the Friday trading session (Thursday evening close) within the defined backtesting period.
Exit Condition: Friday evening close.
Backtesting Controls: Allows users to set custom backtesting periods to evaluate strategy performance over specific date ranges.
Key Features:
Custom Backtest Periods: Easily configurable inputs to set the start and end date of the backtesting range.
Fixed Slippage and Commission Settings: Ensures realistic simulation of trading conditions.
Process Orders on Close: Backtesting is optimized by processing orders at the bar's close.
Important Notes:
Backtesting Only: This script is intended purely for backtesting purposes. Past performance is not indicative of future results.
Live Trading Recommendations: For live trading, it is highly recommended to use limit orders instead of market orders, especially during evening sessions, as market order slippage can be significant.
Default Settings:
Entry size: 10% of equity per trade.
Slippage: 1 tick.
Commission: 0.05% per trade.

COT Report Indicator with Selectable Data TypeOverview
The COT Report Indicator with Selectable Data Types is a powerful tool for traders who want to gain deeper insights into market sentiment using the Commitment of Traders (COT) data. This indicator allows you to visualize the net positions of different participant categories—Commercial, Noncommercial, and Nonreportable—directly on your chart.
The indicator is fully customizable, allowing you to select the type of data to display, sync with your chart's timeframe, or choose a custom timeframe. Whether you're analyzing gold, crude oil, indices, or forex pairs, this indicator adapts seamlessly to your trading needs.
Features
Dynamic Data Selection:
Choose between Commercial, Noncommercial, or Nonreportable data types.
Analyze the net positions of market participants for more informed decision-making.
Flexible Timeframes:
Sync with the chart's timeframe for quick analysis.
Select a custom timeframe to view COT data at your preferred granularity.
Wide Asset Coverage:
Supports various assets, including gold, silver, crude oil, indices, and forex pairs.
Automatically adjusts to the ticker you're analyzing.
Clear Visual Representation:
Displays Net Long, Net Short, and Net Difference (Long - Short) positions with distinct colors for easy interpretation.
Error Handling:
Alerts you if the symbol is unsupported, ensuring you know when COT data isn't available for a specific asset.
How to Use
Add the Indicator:
Click "Indicators" in TradingView and search for "COT Report Indicator with Selectable Data Types."
Add it to your chart.
Customize the Settings:
Data Type: Choose between Commercial, Noncommercial, or Nonreportable positions.
Data Source: Select "Futures Only" or "Futures and Options."
Timeframe: Sync with the chart's timeframe or specify a custom one (e.g., weekly, monthly).
Interpret the Data:
Green Line: Net Long Positions.
Red Line: Net Short Positions.
Black Line: Net Difference (Long - Short).
Supported Symbols:
Gold, Silver, Crude Oil, Natural Gas, Forex Pairs, S&P 500, US30, NAS100, and more.
Who Can Benefit
Trend Followers: Identify the buying/selling trends of Commercial and Noncommercial participants.
Sentiment Analysts: Understand shifts in sentiment among major market players.
Long-Term Traders: Use COT data to confirm or contradict your fundamental analysis.
Example Use Case
For example, if you're trading gold (XAUUSD) and select Noncommercial Positions, you’ll see the long and short positions of speculators. An increase in net long positions may signal bullish sentiment, while an increase in net short positions may indicate bearish sentiment.
If you switch to Commercial Positions, you'll get insights into how hedgers and institutions are positioning themselves, helping you confirm or counterbalance your current trading strategy.
Limitations
The indicator only works with supported symbols (COT data availability is limited to specific assets).
The COT data is updated weekly, so it is not suitable for short-term intraday trading.

SMB MagicSMB Magic
Overview: SMB Magic is a powerful technical strategy designed to capture breakout opportunities based on price movements, volume spikes, and trend-following logic. This strategy works exclusively on the XAU/USD symbol and is optimized for the 15-minute time frame. By incorporating multiple factors, this strategy identifies high-probability trades with a focus on risk management.
Key Features:
Breakout Confirmation:
This strategy looks for price breakouts above the previous high or below the previous low, with a significant volume increase. A breakout is considered valid when it is supported by strong volume, confirming the strength of the price move.
Price Movement Filter:
The strategy ensures that only significant price movements are considered for trades, helping to avoid low-volatility noise. This filter targets larger price swings to maximize potential profits.
Exponential Moving Average (EMA):
A long-term trend filter is applied to ensure that buy trades occur only when the price is above the moving average, and sell trades only when the price is below it.
Fibonacci Levels:
Custom Fibonacci retracement levels are drawn based on recent price action. These levels act as dynamic support and resistance zones and help determine the exit points for trades.
Take Profit/Stop Loss:
The strategy incorporates predefined take profit and stop loss levels, designed to manage risk effectively. These levels are automatically applied to trades and are adjusted based on the market's volatility.
Volume Confirmation:
A volume multiplier confirms the strength of the breakout. A trade is only considered when the volume exceeds a certain threshold, ensuring that the breakout is supported by sufficient market participation.
How It Works:
Entry Signals:
Buy Signal: A breakout above the previous high, accompanied by significant volume and price movement, occurs when the price is above the trend-following filter (e.g., EMA).
Sell Signal: A breakout below the previous low, accompanied by significant volume and price movement, occurs when the price is below the trend-following filter.
Exit Strategy:
Each position (long or short) has predefined take-profit and stop-loss levels, which are designed to protect capital and lock in profits at key points in the market.
Fibonacci Levels:
Fibonacci levels are drawn to identify potential areas of support or resistance, which can be used to guide exits and stop-loss placements.
Important Notes:
Timeframe Restriction: This strategy is designed specifically for the 15-minute time frame.
Symbol Restriction: The strategy works exclusively on the XAU/USD (Gold) symbol and is not recommended for use with other instruments.
Best Performance in Trending Markets: It works best in trending conditions where breakouts occur frequently.
Disclaimer:
Risk Warning: Trading involves risk, and past performance is not indicative of future results. Always conduct your own research and make informed decisions before trading.

Silver Bullet ICT Strategy [TradingFinder] 10-11 AM NY Time +FVG🔵 Introduction
The ICT Silver Bullet trading strategy is a precise, time-based algorithmic approach that relies on Fair Value Gaps and Liquidity to identify high-probability trade setups. The strategy primarily focuses on the New York AM Session from 10:00 AM to 11:00 AM, leveraging heightened market activity within this critical window to capture short-term trading opportunities.
As an intraday strategy, it is most effective on lower timeframes, with ICT recommending a 15-minute chart or lower. While experienced traders often utilize 1-minute to 5-minute charts, beginners may find the 1-minute timeframe more manageable for applying this strategy.
This approach specifically targets quick trades, designed to take advantage of market movements within tight one-hour windows. By narrowing its focus, the Silver Bullet offers a streamlined and efficient method for traders to capitalize on liquidity shifts and price imbalances with precision.
In the fast-paced world of forex trading, the ability to identify market manipulation and false price movements is crucial for traders aiming to stay ahead of the curve. The Silver Bullet Indicator simplifies this process by integrating ICT principles such as liquidity traps, Order Blocks, and Fair Value Gaps (FVG).
These concepts form the foundation of a tool designed to mimic the strategies of institutional players, empowering traders to align their trades with the "smart money." By transforming complex market dynamics into actionable insights, the Silver Bullet Indicator provides a powerful framework for short-term trading success
Silver Bullet Bullish Setup :
Silver Bullet Bearish Setup :
🔵 How to Use
The Silver Bullet Indicator is a specialized tool that operates within the critical time windows of 9:00-10:00 and 10:00-11:00 in the forex market. Its design incorporates key principles from ICT (Inner Circle Trader) methodology, focusing on concepts such as liquidity traps, CISD Levels, Order Blocks, and Fair Value Gaps (FVG) to provide precise and actionable trade setups.
🟣 Bullish Setup
In a bullish setup, the indicator starts by marking the high and low of the session, serving as critical reference points for liquidity. A typical sequence involves a liquidity grab below the low, where the price manipulates retail traders into selling positions by breaching a key support level.
This movement is often orchestrated by smart money to accumulate buy orders. Following this liquidity grab, a market structure shift (MSS) occurs, signaled by the price breaking the CISD Level—a confirmation of bullish intent. The indicator then highlights an Order Block near the CISD Level, representing the zone where institutional buying is concentrated.
Additionally, it identifies a Fair Value Gap, which acts as a high-probability area for price retracement and trade entry. Traders can confidently take long positions when the price revisits these zones, targeting the next significant liquidity pool or resistance level.
Bullish Setup in CAPITALCOM:US100 :
🟣 Bearish Setup
Conversely, in a bearish setup, the price manipulates liquidity by creating a false breakout above the high of the session. This move entices retail traders into long positions, allowing institutional players to enter sell orders.
Once the price reverses direction and breaches the CISD Level to the downside, a change of character (CHOCH) becomes evident, confirming a bearish market structure. The indicator highlights an Order Block near this level, indicating the origin of the institutional sell orders, along with an associated FVG, which represents an imbalance zone likely to be revisited before the price continues downward.
By entering short positions when the price retraces to these levels, traders align their strategies with the anticipated continuation of bearish momentum, targeting nearby liquidity voids or support zones.
Bearish Setup in OANDA:XAUUSD :
🔵 Settings
Refine Order Block : Enables finer adjustments to Order Block levels for more accurate price responses.
Mitigation Level OB : Allows users to set specific reaction points within an Order Block, including: Proximal: Closest level to the current price. 50% OB: Midpoint of the Order Block. Distal: Farthest level from the current price.
FVG Filter : The Judas Swing indicator includes a filter for Fair Value Gap (FVG), allowing different filtering based on FVG width: FVG Filter Type: Can be set to "Very Aggressive," "Aggressive," "Defensive," or "Very Defensive." Higher defensiveness narrows the FVG width, focusing on narrower gaps.
Mitigation Level FVG : Like the Order Block, you can set price reaction levels for FVG with options such as Proximal, 50% OB, and Distal.
CISD : The Bar Back Check option enables traders to specify the number of past candles checked for identifying the CISD Level, enhancing CISD Level accuracy on the chart.
🔵 Conclusion
The Silver Bullet Indicator is a cutting-edge tool designed specifically for forex traders who aim to leverage market dynamics during critical liquidity windows. By focusing on the highly active 9:00-10:00 and 10:00-11:00 timeframes, the indicator simplifies complex market concepts such as liquidity traps, Order Blocks, Fair Value Gaps (FVG), and CISD Levels, transforming them into actionable insights.
What sets the Silver Bullet Indicator apart is its precision in detecting false breakouts and market structure shifts (MSS), enabling traders to align their strategies with institutional activity. The visual clarity of its signals, including color-coded zones and directional arrows, ensures that both novice and experienced traders can easily interpret and apply its findings in real-time.
By integrating ICT principles, the indicator empowers traders to identify high-probability entry and exit points, minimize risk, and optimize trade execution. Whether you are capturing short-term price movements or navigating complex market conditions, the Silver Bullet Indicator offers a robust framework to enhance your trading performance.
Ultimately, this tool is more than just an indicator; it is a strategic ally for traders who seek to decode the movements of smart money and capitalize on institutional strategies. With the Silver Bullet Indicator, traders can approach the market with greater confidence, precision, and profitability.

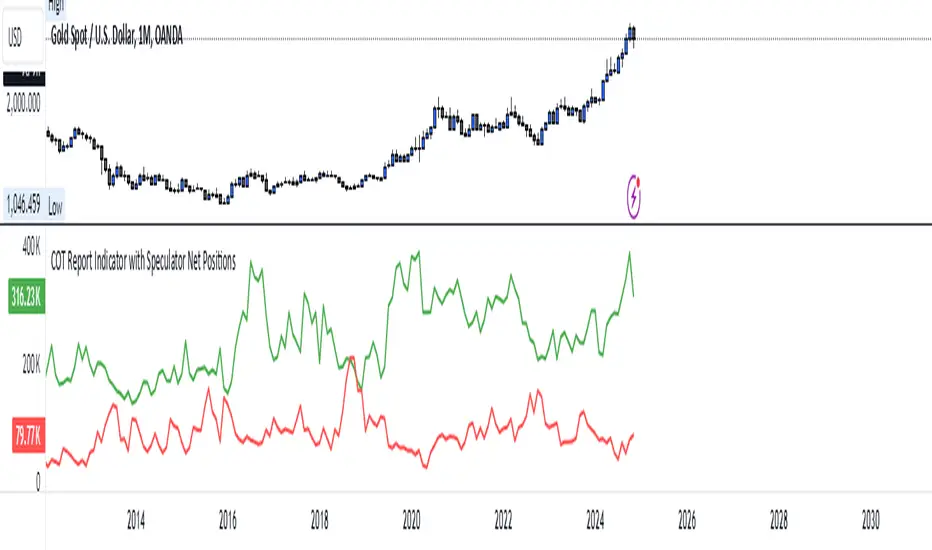
COT Report Indicator with Speculator Net PositionsThe COT Report Indicator with Speculator Net Positions is designed to give traders insights into the behavior of large market participants, particularly speculators, based on the Commitment of Traders (COT) report data. This indicator visualizes the long and short positions of non-commercial traders, allowing users to gauge the sentiment and positioning of large speculators in key markets, such as Gold, Silver, Crude Oil, S&P 500, and currency pairs like EURUSD, GBPUSD, and others.
The indicator provides three essential components:
Net Long Position (Green) - Displays the total long positions held by speculators.
Net Short Position (Purple) - Shows the total short positions held by speculators.
Net Difference (Long - Short) (Yellow) - Illustrates the difference between long and short positions, helping users identify whether speculators are more bullish or bearish on the asset.
Recommended Timeframes:
Best Timeframes: Weekly and Monthly
The COT report data is released on a weekly basis, making higher timeframes like the Weekly and Monthly charts ideal for this indicator. These timeframes provide a more accurate reflection of the underlying trends in speculator positioning, avoiding the noise present in lower timeframes.
How to Use:
Market Sentiment: Use this indicator to gauge the sentiment of large speculators, who often drive market trends. A strong net long position can indicate bullish sentiment, while a high net short position might suggest bearish sentiment.
Trend Reversal Signals: Sudden changes in the net difference between long and short positions may indicate potential trend reversals.
Confirmation Tool: Pair this indicator with your existing analysis to confirm the strength of a trend or identify overbought/oversold conditions based on speculator activity.
Supported Symbols:
This indicator currently supports a range of commodities and currency pairs, including:
Gold ( OANDA:XAUUSD )
Silver ( OANDA:XAGUSD )
Crude Oil ( TVC:USOIL )
Natural Gas ( NYMEX:NG1! )
S&P 500 ( SP:SPX )
Dollar Index ( TVC:DXY )
EURUSD ( FX:EURUSD )
GBPUSD ( FX:GBPUSD )
GBPJPY( FX:GBPJPY )
By providing clear insight into the positions of large speculators, this indicator is a powerful tool for traders looking to align with institutional sentiment and enhance their trading strategy.
ABCD Harmonic Pattern [TradingFinder] ABCD Pattern indicator🔵 Introduction
The ABCD harmonic pattern is a tool for identifying potential reversal zones (PRZ) by using Fibonacci ratios to pinpoint critical price reversal points on price charts.
This pattern consists of four key points, labeled A, B, C, and D. In this structure, the AB and CD waves move in the same direction, while the BC wave acts as a corrective wave in the opposite direction.
The ABCD pattern follows specific Fibonacci ratios that enhance its accuracy in identifying PRZ. Typically, point C lies within the 0.382 to 0.886 Fibonacci retracement of the AB wave, indicating the correction extent of the BC wave.
Subsequently, the CD wave, as the final wave in this pattern, reaches point D with a Fibonacci extension between 1.13 and 2.618 of the BC wave. Point D, which marks the PRZ, is where a potential price reversal is likely to occur.
The ABCD pattern appears in both bullish and bearish forms. In the bullish ABCD pattern, prices tend to increase at point D, which defines the PRZ; in the bearish ABCD pattern, prices typically decrease upon reaching the PRZ at point D.
These characteristics make the ABCD pattern a popular tool for identifying PRZ and price reversal points in financial markets, including forex, cryptocurrencies, and stocks.
Bullish Pattern :
Beaish Pattern :
🔵 How to Use
🟣 Bullish ABCD Pattern
The bullish ABCD pattern is another harmonic structure used to identify a potential reversal zone (PRZ) where the price is likely to rise after a downward movement. This pattern includes four main points A, B, C, and D. In the bullish ABCD, the AB and CD waves move downward, and the BC wave acts as a corrective, upward wave. This setup creates a PRZ at point D, where the price may reverse and move upward.
To identify a bullish ABCD pattern, begin with the downward AB wave. The BC wave retraces upward between 0.382 and 0.886 of the AB wave, indicating the extent of the correction.
After the BC retracement, the CD wave forms and extends from point C down to point D, with an extension of around 1.13 to 2.618 of the BC wave. Point D, as the PRZ, represents the area where the price may reverse upwards, making it a strategic level for potential buy positions.
When the price reaches point D in the bullish ABCD pattern, traders look for upward reversal signals. This can include bullish candlestick formations, such as hammer or morning star patterns, near the PRZ to confirm the trend reversal. Entering a long position after confirmation near point D provides a calculated entry point.
Additionally, placing a stop loss slightly below point D helps protect against potential loss if the reversal does not occur. The ABCD pattern, with its precise Fibonacci structure and PRZ identification, gives traders a disciplined approach to spotting bullish reversals in markets, particularly in forex, cryptocurrency, and stock trading.
Bullish Pattern in COINBASE:BTCUSD :
🟣 Bearish ABCD Pattern
The bearish ABCD pattern is a harmonic structure that indicates a potential reversal zone (PRZ) where price may shift downward after an initial upward movement. This pattern consists of four main points A, B, C, and D. In a bearish ABCD, the AB and CD waves move upward, while the BC wave acts as a corrective wave in the opposite, downward direction. This reversal zone (PRZ) can be identified with specific Fibonacci ratios.
To identify a bearish ABCD pattern, start by observing the AB wave, which forms as an upward price movement. The BC wave, which follows, typically retraces between 0.382 to 0.886 of the AB wave. This retracement indicates how far the correction goes and sets the foundation for the next wave.
Finally, the CD wave extends from point C to reach point D with a Fibonacci extension of approximately 1.13 to 2.618 of the BC wave. Point D represents the PRZ where the potential reversal may occur, making it a critical area for traders to consider short positions.
Once point D in the bearish ABCD pattern is reached, traders can anticipate a downward price movement. At this potential reversal zone (PRZ), traders often wait for additional bearish signals or candlestick patterns, such as engulfing or evening star formations, to confirm the price reversal.
This confirmation around the PRZ enhances the accuracy of the entry point for a bearish position. Setting a stop loss slightly above point D can help manage risk if the price doesn’t reverse as anticipated. The ABCD pattern, with its reliance on Fibonacci ratios and clearly defined points, offers a strategic approach for traders looking to capitalize on potential bearish reversals in financial markets, including forex, stocks, and cryptocurrencies.
Bearish Pattern in OANDA:XAUUSD :
🔵 Setting
🟣 Logical Setting
ZigZag Pivot Period : You can adjust the period so that the harmonic patterns are adjusted according to the pivot period you want. This factor is the most important parameter in pattern recognition.
Show Valid Forma t: If this parameter is on "On" mode, only patterns will be displayed that they have exact format and no noise can be seen in them. If "Off" is, the patterns displayed that maybe are noisy and do not exactly correspond to the original pattern.
Show Formation Last Pivot Confirm : if Turned on, you can see this ability of patterns when their last pivot is formed. If this feature is off, it will see the patterns as soon as they are formed. The advantage of this option being clear is less formation of fielded patterns, and it is accompanied by the latest pattern seeing and a sharp reduction in reward to risk.
Period of Formation Last Pivot : Using this parameter you can determine that the last pivot is based on Pivot period.
🟣 Genaral Setting
Show : Enter "On" to display the template and "Off" to not display the template.
Color : Enter the desired color to draw the pattern in this parameter.
LineWidth : You can enter the number 1 or numbers higher than one to adjust the thickness of the drawing lines. This number must be an integer and increases with increasing thickness.
LabelSize : You can adjust the size of the labels by using the "size.auto", "size.tiny", "size.smal", "size.normal", "size.large" or "size.huge" entries.
🟣 Alert Setting
Alert : On / Off
Message Frequency : This string parameter defines the announcement frequency. Choices include: "All" (activates the alert every time the function is called), "Once Per Bar" (activates the alert only on the first call within the bar), and "Once Per Bar Close" (the alert is activated only by a call at the last script execution of the real-time bar upon closing). The default setting is "Once per Bar".
Show Alert Time by Time Zone : The date, hour, and minute you receive in alert messages can be based on any time zone you choose. For example, if you want New York time, you should enter "UTC-4". This input is set to the time zone "UTC" by default.
🟣 Conclusion
The ABCD harmonic pattern offers a structured approach in technical analysis, helping traders accurately identify potential reversal zones (PRZ) where price movements may shift direction. By leveraging the relationships between points A, B, C, and D, alongside specific Fibonacci ratios, traders can better anticipate points of market reversal and make more informed decisions.
Both the bearish and bullish ABCD patterns enable traders to pinpoint ideal entry points that align with anticipated market shifts. In a bearish ABCD, point D within the PRZ often signals a downward trend reversal, while in a bullish ABCD, this same point typically suggests an upward reversal. The adaptability of the ABCD pattern across different markets, such as forex, stocks, and cryptocurrencies, further highlights its utility and reliability.
Integrating the ABCD pattern into a trading strategy provides a methodical and calculated approach to entry and exit decisions. With accurate application of Fibonacci ratios and confirmation of the PRZ, traders can enhance their trading precision, reduce risks, and boost overall performance. The ABCD harmonic pattern remains a valuable resource for traders aiming to leverage structured patterns for consistent results in their technical analysis.

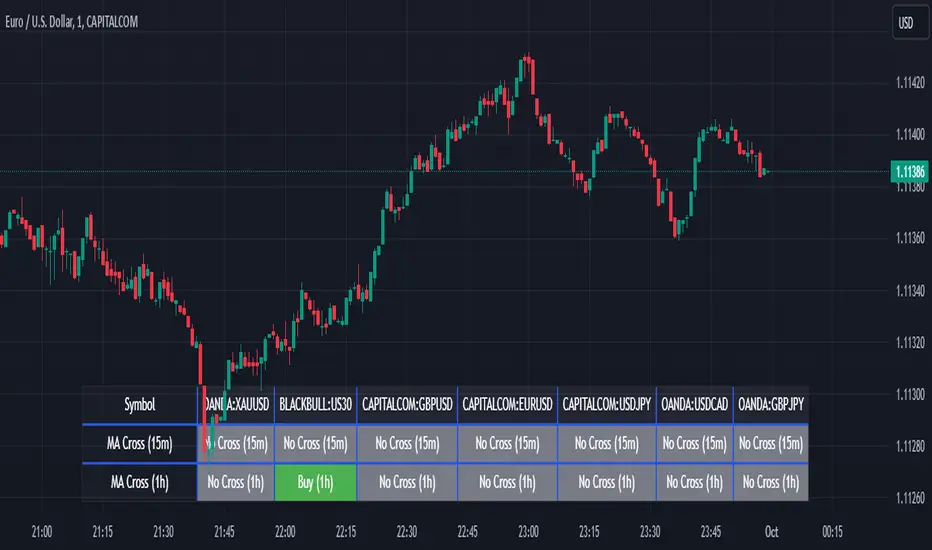
Screener MA CrossThe Screener MA Cross is an efficient tool designed to help traders quickly identify potential buy and sell signals across multiple currency pairs and timeframes. This script monitors the crossover behavior of two moving averages (MA8 and MA50) to determine possible entry points for trades.
Key Features:
Multi-Pair Monitoring: The indicator allows users to screen popular assets, including XAUUSD, US30, GBPUSD, EURUSD, USDJPY, USDCAD, and GBPJPY. You can add or remove symbols based on your preference.
Dual Timeframe Analysis: It tracks moving average crossovers on both 15-minute and 1-hour charts, giving users insights into short-term and medium-term trends without switching between timeframes.
Color-Coded Signals:
Green: Indicates a bullish "Buy" signal when the MA8 crosses above the MA50, suggesting upward momentum.
Red: Indicates a bearish "Sell" signal when the MA8 crosses below the MA50, signaling downward momentum.
Gray: Represents a neutral or no-cross state, indicating no clear trend.
Clean Table Format: Displays all relevant signals directly on your chart in a structured, easy-to-read table format, allowing you to quickly scan and assess trading opportunities.
How It Works: The script uses moving averages (MA8 and MA50) to analyze crossover patterns, a common method for identifying trend changes. A crossover occurs when a shorter moving average (MA8) crosses above or below a longer moving average (MA50). By requesting data from the 15-minute and 1-hour timeframes, the Screener MA Cross provides a clear overview of the market situation across various assets, helping you decide on potential trades.
This tool is particularly useful for trend-following strategies and can be used to spot momentum shifts on smaller timeframes, making it ideal for day traders and scalpers.
How to Use:
Add the indicator to your chart and customize the asset symbols to match your trading preferences.
Monitor the signals on the table. Green signals indicate potential buying opportunities, while red signals suggest possible selling points.
Use alongside other analysis: While the Screener MA Cross offers valuable insights, it's best used in combination with other indicators and analysis techniques to confirm trade setups.
Gold Scalping Strategy with Precise EntriesThe Gold Scalping Strategy with Precise Entries is designed to take advantage of short-term price movements in the gold market (XAU/USD). This strategy uses a combination of technical indicators and chart patterns to identify precise buy and sell opportunities during times of consolidation and trend continuation.
Key Elements of the Strategy:
Exponential Moving Averages (EMAs):
50 EMA: Used as the shorter-term moving average to detect the recent price trend.
200 EMA: Used as the longer-term moving average to determine the overall market trend.
Trend Identification:
A bullish trend is identified when the 50 EMA is above the 200 EMA.
A bearish trend is identified when the 50 EMA is below the 200 EMA.
Average True Range (ATR):
ATR (14) is used to calculate the market's volatility and to set a dynamic stop loss based on recent price movements. Higher ATR values indicate higher volatility.
ATR helps define a suitable stop-loss distance from the entry point.
Relative Strength Index (RSI):
RSI (14) is used as a momentum oscillator to detect overbought or oversold conditions.
However, in this strategy, the RSI is primarily used as a consolidation filter to look for neutral zones (between 45 and 55), which may indicate a potential breakout or trend continuation after a consolidation phase.
Engulfing Patterns:
Bullish Engulfing: A bullish signal is generated when the current candle fully engulfs the previous bearish candle, indicating potential upward momentum.
Bearish Engulfing: A bearish signal is generated when the current candle fully engulfs the previous bullish candle, signaling potential downward momentum.
Precise Entry Conditions:
Long (Buy):
The 50 EMA is above the 200 EMA (bullish trend).
The RSI is between 45 and 55 (neutral/consolidation zone).
A bullish engulfing pattern occurs.
The price closes above the 50 EMA.
Short (Sell):
The 50 EMA is below the 200 EMA (bearish trend).
The RSI is between 45 and 55 (neutral/consolidation zone).
A bearish engulfing pattern occurs.
The price closes below the 50 EMA.
Take Profit and Stop Loss:
Take Profit: A fixed 20-pip target (where 1 pip = 0.10 movement in gold) is used for each trade.
Stop Loss: The stop-loss is dynamically set based on the ATR, ensuring that it adapts to current market volatility.
Visual Signals:
Buy and sell signals are visually plotted on the chart using green and red labels, indicating precise points of entry.
Advantages of This Strategy:
Trend Alignment: The strategy ensures that trades are taken in the direction of the overall trend, as indicated by the 50 and 200 EMAs.
Volatility Adaptation: The use of ATR allows the stop loss to adapt to the current market conditions, reducing the risk of premature exits in volatile markets.
Precise Entries: The combination of engulfing patterns and the neutral RSI zone provides a high-probability entry signal that captures momentum after consolidation.
Quick Scalping: With a fixed 20-pip profit target, the strategy is designed to capture small price movements quickly, which is ideal for scalping.
This strategy can be applied to lower timeframes (such as 1-minute, 5-minute, or 15-minute charts) for frequent trade opportunities in gold trading, making it suitable for day traders or scalpers. However, proper risk management should always be used due to the inherent volatility of gold.

Lot Size per CandleThis script indicates the lotsize based on your accountsize and risk per trade.
You have the option to select account in EUR or USD. You can set account size and risk%.
Valid for next combination of currencies:
EUR
JPY
GBP
AUD
CHF
CAD
XAUUSD
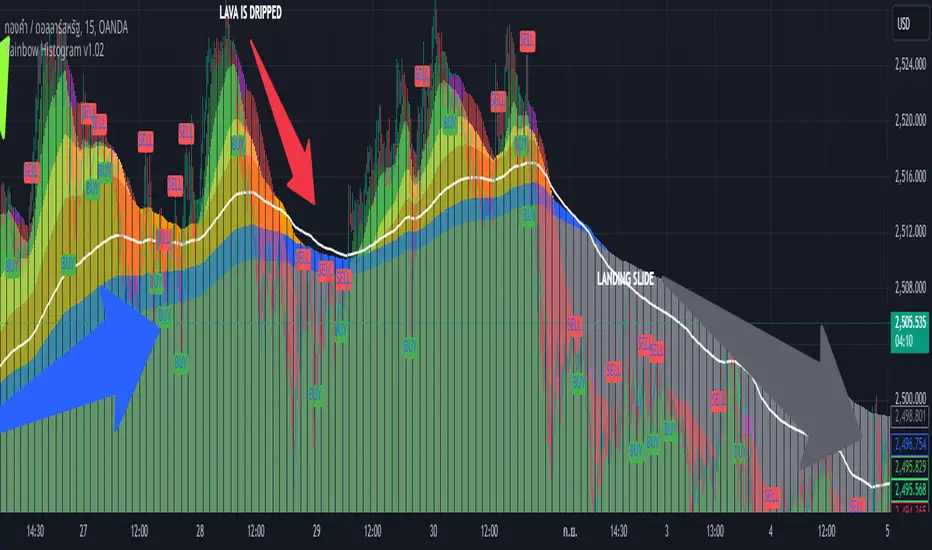
Rainbow Histogram v1.01Sure! Here’s a compelling English version of the article for your TradingView post:
---
### 🌈 **Introducing Rainbow Histogram: A Fusion of EMA and MA for Enhanced Trading Analysis**
**Hello Traders,**
I’m excited to introduce a fresh concept that combines technical analysis techniques into a new indicator called **Rainbow Histogram**. This innovative tool blends Exponential Moving Averages (EMA) and Moving Averages (MA) to provide you with a powerful and accurate tool for making trading decisions.
#### **🎨 What is Rainbow Histogram?**
The Rainbow Histogram is designed to help you identify market trends and signal precise entry and exit points by blending EMA and MA into a colorful "Rainbow" display. This visual approach enhances your ability to spot trend strength and direction with clarity.
#### **📈 How Does Rainbow Histogram Work?**
1. **Exponential Moving Average (EMA):** Captures short-term trends and reacts quickly to price changes.
2. **Moving Average (MA):** Tracks long-term trends and provides a broader view of the market direction.
**Rainbow Histogram** uses the combination of EMA and MA to create a histogram that shows the difference between these two averages in distinct colors. This makes it easy to visualize trend changes and market momentum.
#### **🔧 Setting It Up**
1. **EMA:** Adjust the EMA settings based on your trading timeframe and strategy (e.g., EMA 9, EMA 21).
2. **MA:** Set the MA parameters to capture long-term trends (e.g., MA 50, MA 200).
#### **🌟 Why Use Rainbow Histogram?**
- **Simplified Analysis:** Quickly identify trends and their strength with a clear visual representation.
- **Distinct Colors:** Differentiate between EMA and MA with vibrant colors for easy interpretation.
- **Precise Signals:** Get clear buy and sell signals based on histogram changes.
#### **📥 Get Started**
Add **Rainbow Histogram** to your TradingView charts by searching for the script in TradingView’s library or set it up manually using the recommended settings.
#### **📝 In Summary**
**Rainbow Histogram** is a unique tool that simplifies trend analysis and enhances accuracy by merging EMA and MA into a single, colorful indicator. Use this tool to refine your trading strategy and make more informed financial decisions.
If you have any questions or feedback about **Rainbow Histogram**, feel free to comment below or send me a message!
**Happy Trading!** 🌟
---
I hope this version effectively captures attention and engages your audience!
All Divergences with trend / SL - Uncle SamThanks to the main inspiration behind this strategy and the hard work of:
"Divergence for many indicators v4 by LonesomeTheBlue"
The "All Divergence" strategy is a versatile approach for identifying and acting upon various divergences in the market. Divergences occur when price and an indicator move in opposite directions, often signaling potential reversals. This strategy incorporates both regular and hidden divergences across multiple indicators (MACD, Stochastics, CCI, etc.) for a comprehensive analysis.
Key Features:
Comprehensive Divergence Analysis: The strategy scans for regular and hidden divergences across a variety of indicators, increasing the probability of identifying potential trade setups.
Trend Filter: To enhance accuracy, a moving average (MA) trend filter is integrated. This ensures trades align with the overall market trend, reducing the risk of false signals.
Customizable Risk Management: Users can adjust parameters for long/short stop-loss and take-profit levels to match their individual risk tolerance.
Additional Risk Management (Optional): An experimental MA-based risk management feature can be enabled to close positions if the market shows consecutive closes against the trend.
Clear Visuals: The script plots pivot points, divergence lines, and stop-loss levels on the chart for easy reference.
Strategy Settings (Defaults):
Enable Long/Short Strategy: True
Long/Short Stop Loss %: 2%
Long/Short Take Profit %: 5%
Enable MA Trend: True
MA Type: HMA (Hull Moving Average)
MA Length: 500
Use MA Risk Management: False (Experimental)
MA Risk Exit Candles: 2 (If enabled)
Pivot Period: 9
Source for Pivot Points: Close
Backtest Details (Example):
The strategy has been backtested on XAUUSD 1H (Goold/USD 1 hour timeframe) with a starting capital of $1,000. The backtest period covers around 2 years. A commission of 0.02% per trade and a 0.1% slippage per trade were factored in to simulate real-world trading costs.
Disclaimer:
This strategy is for educational and informational purposes only. Backtested results are not indicative of future performance. Use this strategy at your own risk. Always conduct your own analysis and consider consulting a financial professional before making any trading decisions.
Important Notes:
The default settings are a good starting point, but feel free to experiment to find optimal parameters for your specific trading style and market.
The MA-based risk management is an experimental feature. Use it with caution and thoroughly test it before deploying in live trading.
Backtest results can vary depending on the market, timeframe, and specific settings used. Always consider slippage and commission fees when evaluating a strategy's potential profitability.

Sniper Entry using RSI confirmationThis is a sniper entry indicator that provides Buy and Sell signals using other Indicators to give the best possible Entries (note: Entries will not be 100 percent accurate and analysis should be done to support an entry)
Moving Average Crossovers:
The indicator uses two moving averages: a short-term SMA (Simple Moving Average) and a long-term SMA.
When the short-term SMA crosses above the long-term SMA, it generates a buy signal (indicating potential upward momentum).
When the short-term SMA crosses below the long-term SMA, it generates a sell signal (indicating potential downward momentum).
RSI Confirmation:
The indicator incorporates RSI (Relative Strength Index) to confirm the buy and sell signals generated by the moving average crossovers.
RSI is used to gauge the overbought and oversold conditions of the market.
A buy signal is confirmed if RSI is below a specified overbought level, indicating potential buying opportunity.
A sell signal is confirmed if RSI is above a specified oversold level, indicating potential selling opportunity.
Dynamic Take Profit and Stop Loss:
The indicator calculates dynamic take profit and stop loss levels based on the Average True Range (ATR).
ATR is used to gauge market volatility, and the take profit and stop loss levels are adjusted accordingly.
This feature helps traders to manage their risk effectively by setting appropriate profit targets and stop loss levels.
Combining the information provided by these, the indicator will provide an entry point with a provided take profit and stop loss. The indicator can be applied to different asset classes. Risk management must be applied when using this indicator as it is not 100% guaranteed to be profitable.
Goodluck!

Advanced Gold Scalping Strategy with RSI Divergence# Advanced Gold Scalping Strategy with RSI Divergence
## Overview
This Pine Script implements an advanced scalping strategy for gold (XAUUSD) trading, primarily designed for the 1-minute timeframe. The strategy utilizes the Relative Strength Index (RSI) indicator along with its moving average to identify potential trade setups based on divergences between price action and RSI movements.
## Key Components
### 1. RSI Calculation
- Uses a customizable RSI length (default: 60)
- Allows selection of the source for RSI calculation (default: close price)
### 2. Moving Average of RSI
- Supports multiple MA types: SMA, EMA, SMMA (RMA), WMA, VWMA, and Bollinger Bands
- Customizable MA length (default: 3)
- Option to display Bollinger Bands with adjustable standard deviation multiplier
### 3. Divergence Detection
- Implements both bullish and bearish divergence identification
- Uses pivot high and pivot low points to detect divergences
- Allows for customization of lookback periods and range for divergence detection
### 4. Entry Conditions
- Long Entry: Bullish divergence when RSI is below 40
- Short Entry: Bearish divergence when RSI is above 60
### 5. Trade Management
- Stop Loss: Customizable, default set to 11 pips
- Take Profit: Customizable, default set to 33 pips
### 6. Visualization
- Plots RSI line and its moving average
- Displays horizontal lines at 30, 50, and 70 RSI levels
- Shows Bollinger Bands when selected
- Highlights divergences with "Bull" and "Bear" labels on the chart
## Input Parameters
- RSI Length: Adjusts the period for RSI calculation
- RSI Source: Selects the price source for RSI (close, open, high, low, hl2, hlc3, ohlc4)
- MA Type: Chooses the type of moving average applied to RSI
- MA Length: Sets the period for the moving average
- BB StdDev: Adjusts the standard deviation multiplier for Bollinger Bands
- Show Divergence: Toggles the display of divergence labels
- Stop Loss: Sets the stop loss distance in pips
- Take Profit: Sets the take profit distance in pips
## Strategy Logic
1. **RSI Calculation**:
- Computes RSI using the specified length and source
- Calculates the chosen type of moving average on the RSI
2. **Divergence Detection**:
- Identifies pivot points in both price and RSI
- Checks for higher lows in RSI with lower lows in price (bullish divergence)
- Checks for lower highs in RSI with higher highs in price (bearish divergence)
3. **Trade Entry**:
- Enters a long position when a bullish divergence is detected and RSI is below 40
- Enters a short position when a bearish divergence is detected and RSI is above 60
4. **Position Management**:
- Places a stop loss order at the entry price ± stop loss pips (depending on the direction)
- Sets a take profit order at the entry price ± take profit pips (depending on the direction)
5. **Visualization**:
- Plots the RSI and its moving average
- Draws horizontal lines for overbought/oversold levels
- Displays Bollinger Bands if selected
- Shows divergence labels on the chart for identified setups
## Usage Instructions
1. Apply the script to a 1-minute XAUUSD (Gold) chart in TradingView
2. Adjust the input parameters as needed:
- Increase RSI Length for less frequent but potentially more reliable signals
- Modify MA Type and Length to change the sensitivity of the RSI moving average
- Adjust Stop Loss and Take Profit levels based on current market volatility
3. Monitor the chart for Bull (long) and Bear (short) labels indicating potential trade setups
4. Use in conjunction with other analysis and risk management techniques
## Considerations
- This strategy is designed for short-term scalping and may not be suitable for all market conditions
- Always backtest and forward test the strategy before using it with real capital
- The effectiveness of divergence-based strategies can vary depending on market trends and volatility
- Consider using additional confirmation signals or filters to improve the strategy's performance
Remember to adapt the strategy parameters to your risk tolerance and trading style, and always practice proper risk management.

Lot Size Calculator - Acero FXENGLISH DESCRIPTION:
Easy get your lot size (by Acero FX)
---------------------------
We use this transaction sizes:
Forex = 1
XAUUSD = 0.001
US100, US30 or other index = 10
---------------------------
Automatic Information for calculations:
Currency used: USD
Instrument: Detected Automatically
---------------------------
Manual Inputs:
Choose your Balance amount in "Tamaño de Cuenta"
Choose your Risk Type in "Tipo de Riesgo" between Percentage or Amount
Choose your method to calculate your Lot Size in "Calcular Usando..." between Pips or Entry and SL price
---------------------------
Table Shows:
Title: Lot Size Calc 5.0 - Acero FX
Instrument: .................
Lot Size: ..............
Entry Price: .............
Stop Loss Price: .............
Pips: ...............
Risk ($): ...............
Risk (%): ............
Transaction Size: ..............
---------------------------
Important Disclaimers:
-Minor pairs may have some differences between other calculators.
-JPY pairs use USDJPY open price of the day
DESCRIPCIÓN EN ESPAÑOL
Calcula fácilmente tu lote (Diseñado por Acero FX)
---------------------
Usamos estos tamaños de transacción:
Forex = 1
XAUUSD = 0,001
US100, US30 u otros índices = 10
---------------------
Información automática para cálculos:
Moneda utilizada: USD
Instrumento: Detectado automáticamente
---------------------
Entradas manuales:
Elige el monto de tu Saldo en "Tamaño de Cuenta"
Elige el Tipo de Riesgo en "Tipo de Riesgo" entre Porcentaje o Monto
Elige el método para calcular el tamaño de stu lote en "Calcular Usando..." entre Pips o Entrada y precio SL
---------------------
La tabla muestra:
Título: Calc. Tamaño de Lote 5.0 - Acero FX
Instrumento: .................
Lotaje: ..............
Entrada: .............
Stop Loss: .............
Pips: .................
Riesgo ($): .................
Riesgo (%): ............
Tamaño del contrato (tamaño de la transacción): .................
---------------------
Descargos de responsabilidad importantes:
-Los pares menores pueden tener algunas diferencias entre otras calculadoras.
-Los pares JPY utilizan el precio de apertura del día USDJPY
