RSI and Stochastic Probability Based Price Target IndicatorHello,
Releasing this beta indicator. It is somewhat experimental but I have had some good success with it so I figured I would share it!
What is it?
This is an indicator that combines RSI and Stochastics with probability levels.
How it works?
This works by applying a regression based analysis on both Stochastics and RSI to attempt to predict a likely close price of the stock.
It also assess the normal distribution range the stock is trading in. With this information it does the following:
2 lines are plotted:
Yellow line: This is the stochastic line. This represents the smoothed version of the stochastic price prediction of the most likely close price.
White Line: This is the RSI line. It represents the smoothed version of the RSI price prediction of the most likely close price.
When the Yellow Line (Stochastic Line) crosses over the White Line (the RSI line), this is a bearish indication. It will signal a bearish cross (red arrow) to signal that some selling or pullback may follow.
IF this bearish cross happens while the stock is trading in a low probability upper zone (anything 13% or less), it will trigger a label to print with a pullback price. The pullback price is the "regression to the mean" assumption price. Its the current mean at the time of the bearish cross.
The inverse is true if it is a bullish cross. If the stock has a bullish cross and is trading in a low probability bearish range, it will print the price target for a regression back to the upward mean.
Additional information:
The indicator also provides a data table. This data table provides you with the current probability range (i.e. whether the stock is trading in the 68% probability zone or the outer 13, 2.1 or 0.1 probability zones), as well as the overall probability of a move up or down.
It also provides the next bull and bear targets. These are calculated based on the next probability zone located immediately above and below the current trading zone of the stock.
Smoothing vs Non-smoothed data:
For those who like to assess RSI and Stochastic for divergences, there is an option in the indicator to un-smooth the stochastic and RSI lines. Doing so looks like this:
Un-smoothing the RSI and stochastic will not affect the analysis or price targets. However it does add some noise to the chart and makes it slightly difficult to check for crosses. But whatever your preference is you can use.
Cross Indicators :
A bearish cross (stochastic crosses above RSI line) is signalled with a red arrow down shape.
A bullish cross (RSI crosses above stochastic line) is signalled with a green arrow up shape.
Labels vs Arrows:
The arrows are lax in their signalling. They will signal at any cross. Thus you are inclined to get false signals.
The labels are programmed to only trigger on high probability setups.
Please keep this in mind when using the indicator!
Warning and disclaimer:
As with all indicators, no indicator is 100% perfect.
This will not replace the need for solid analysis, risk management and planning.
This is also kind of beta in its approach. As such, there are no real rules on how it should be or can be applied rigorously. Thus, its important to exercise caution and not rely on this alone. Do your due diligence before using or applying this indicator to your trading regimen.
As it is kind of different, I am interested in hearing your feedback and experience using it. Let me know your feedback, experiences and suggestions below.
Also, because it does have a lot of moving parts, I have done a tutorial video on its use linked below:
Thanks for checking it out, safe trades everyone and take care!
חפש סקריפטים עבור "天铭科技RSI指标状态"

RSI is in Normal Distribution?Does RSI Follow a Normal Distribution?
The value of RSI was converted to a value between 0~2, 2~4, ..., 98~100, and the number of samples was graphed.
The Z values are expressed so that the values corresponding to 30 and 70 of the RSI can be compared with the standard normal distribution.
Additionally, when using the RSI period correction function of the 'RSI Candle Advanced V2' indicator that I made before, it shows no change in standard deviation.
RSI는 정규분포를 따를까요
RSI의 값을 0~2, 2~4, ..., 98~100 사이 값으로 변환하고 그 표본 갯수를 그래프로 표현하였습니다.
Z 값은 RSI의 30, 70에 해당하는 값을 표준정규분포와 비교할 수 있도록 표현하였습니다.
추가적으로 제가 예전에 만들었던 'RSI Candle Advanced V2' 지표의 RSI 기간 보정 함수를 사용할 경우 표준편차의 변화가 없음을 보입니다.

RSI Multi Symbol/Time Frame DetectorThis code is an implementation of the Relative Strength Index (RSI) indicator, which is a popular momentum indicator used in technical analysis. The RSI measures the strength of an asset's price action and provides information on whether the asset is overbought or oversold. The code also calculates a moving average of the RSI and allows the user to choose the type of moving average to be calculated (SMA, EMA, SMMA, WMA, or VWMA).
The user can select from different time frames (5, 15, 60, or 240), symbols (SP:SPX, OANDA:EURUSD, or OANDA:NZDUSD), RSI lengths, and moving average types and lengths.
The code starts by defining a function called "ma" for calculating different types of moving averages. This function takes as input the source data for the moving average calculation (the RSI), the length of the moving average, and the type of moving average. The function uses a switch statement to return the appropriate calculation based on the inputted moving average type.
Next, the code calculates the RSI and its moving average. The RSI is calculated using the well-known formula for the RSI, which involves calculating the average gains and losses over a specified period of time and then dividing the average gains by the average losses. The moving average is calculated using the "ma" function defined earlier.
Finally, the code allows the user to choose the symbol and time frame to be used in the RSI calculation, as well as the length of the RSI and the moving average, and the type of moving average. The user can choose from three symbols (SP:SPX, OANDA:EURUSD, OANDA:NZDUSD) and four time frames (5, 15, 60, and 240 minutes). The code then uses the "request.security" function to retrieve the RSI calculation for the selected symbol and time frame.
Note: This code is example for you to use multi timeframe/symbol in your indicator or Strategy , also prevent Repainting Calculation

RSI TREND FILTERRSI TREND Filter on Chart
RSI scaled to fit on chart instead of oscillator, Trend Analysis is easy and Hidden Divergence is revealed using this indicator. This indicator is an aim to reduce confusing RSI Situations. The Oversold and Overbought lines help to determine the price conditions so its easy to avoid Traps.
Oversold and Overbought conditions are marked on Chart to make it useful to confirm a Buy or Sell Signals.
RSI 50 level is plotted with reference to EMA50 and Oversold and Overbought Conditions are calculated accordingly.
Uptrend: RSI Cloud / Candles above RSI 50 Level
Down Trend: RSI Cloud / Candles below RSI 50 Level
Sideways : Candles in the Gray Area above and below RSI 50 Level
Default RSI (14) : is the Candlestick pattern itself
Disclaimer: Use Solely at your own Risk.

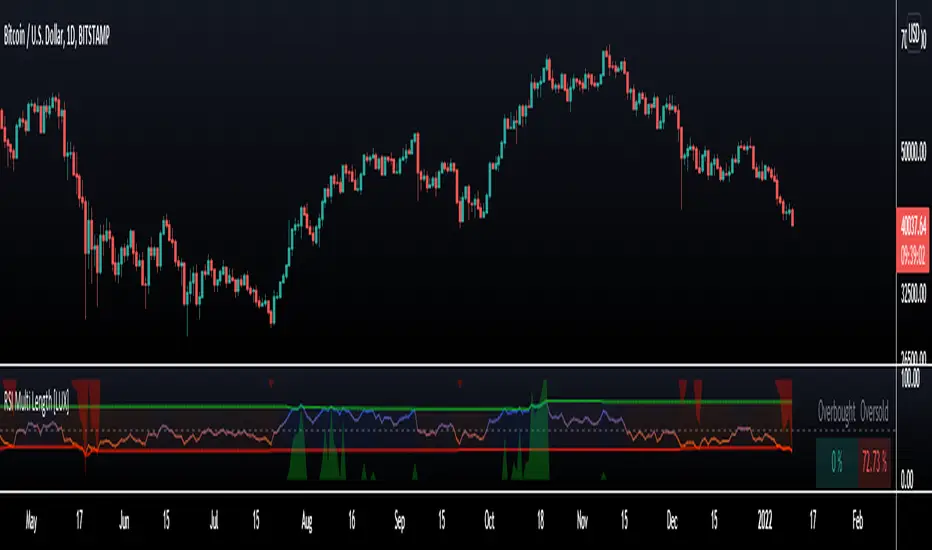
RSI Multi Length [LuxAlgo]The following indicator aims to return information over RSIs using multiple periods, including the percentage of RSIs of different periods being overbought/oversold, as well as the average between these multiple RSIs.
The percentage of RSIs of different periods being overbought/oversold is additionally used to return adaptive overbought/oversold levels.
Settings
Maximum Length: Maximum period of the RSI used for the indicator calculation
Minimum Length: Minimum period value of the RSI used for the indicator calculation
Overbought: Value of the overbought level
Oversold: Value of the oversold level
Src: Input source of the indicator
Usage
The main element of the indicator is given by the multi-length RSI average, returning an oscillator similar to a fixed-length RSI. Because of its multiple length nature, the indicator can reflect shorter to longer-term price variations depending on the Maximum/Minimum length range defined by the user.
The green area indicates the percentage of RSIs over the user-defined overbought level. The red area indicates the percentage of RSIs under the user-defined oversold level, this percentage is inverted for ease of visualization. Additionally, a dashboard at the top right of the indicator pane indicates these percentages for the most recent bar.
A lower percentage of overbought/oversold RSIs can indicate a potential shorter-term retracement.
These percentages are used to construct adaptive overbought/oversold levels for the average multi-length RSI. The overbought level will be easier to reach if the percentage of overbought RSI's is high, the same logic applies to the adaptive oversold level.
RSI Trend LineI took a concept similar to the "Adaptive RSI" to get the RSI overlaid on a price chart. The problem I have with the Adaptive RSI is to me it sticks too closely to price. I wanted something much more visually helpful that can provide actual tradable signals and strategies.
The orange line you are seeing is the "RSI Trend Line"
The further the RSI moves away from a value of 50 (the "zero line"), the more you see this orange line move away from price. This helps visualize the strength of price pushing away from a neutral value to a position of strength or weakness-- if orange is below price then relative strength is high; if orange is above price then relative strength is low. When price is equal to the orange RSI line, the RSI is at a value of 50.
In addition to the trend line, you can enable bands which reflect Overbought and Oversold levels . If you leave the responsiveness to a value of 1.0 and removed any smoothing, these should pretty accurately reflect an actual RSI chart topping the OB and OS lines (default 70 and 30, respectively). (They're still very close with different responsiveness and smoothing values)
The conversion or scaling of RSI value onto price comes with a bit of a quirk which I decided to leave to the user to determine how they want it applied. So the setting "Responsiveness" will impact the sort of aggressiveness of the RSI trend line as well as the the size of the bands. You could think of this in some ways as the OPPOSITE of the multiple setting on a Bollinger or Keltner band-- 1.0 will make for the widest band, 2.0 is the default and my preference, and you can move it up to a value of 5.0.
Here are some examples of how you could use the indicator for trade signals--
And here's my thought on the current state (as of 10/06) on indices with regards to this indicator-

RSI 6/14/24 by HC3 timeframes of RSIs: 6, 14 and 24 days. This is the extended version of the "standard" RSI script.
How to use it:
It has 3 upper bands and 3 lower bands. The 6-day RSI (orange line) corresponds to 80 and 20 bands, which means if 6-day RSI is over 80, it is an indicator of overbought for short term. Similarly, 14-day RSI use 70 and 30 bands and 24-day RSI use 60 and 40 bands. But these are not the "magic numbers". For different investments, they may have different thresholds. You can change it in the setting.
We all know when RSI is high, it may be an indicator to sell the investments we are holding. However, if 6-day RSI > 80, but 14-day RSI <70, it may not be the good time to sell it right now. We may watch it for a few days. But if all 3 RSIs are above the corresponding upper bands, it may be the time to sell it.
When the orange line down crosses the purple and blue lines, the price is dropping down. On the contrary, when the orange line up crosses the purple and blue lines, the price is probably up.
Let me know if you have any question.
Holly
2020.12.05

Bjorgum RSIRSI output signals are displayed with color change to reflect the plotted value. This makes evaluating RSI conditions require but a glance.
RSI momentum buy signals are given on the cross of the 50 level, whereas sell signals are given on a fall below.
Default values a 5 period RSI which gives more timely entrances and exits for swing traders. This can be adjusted to the typical 14 period if the viewer desires slower signals.
Bullish and bearish area is shaded to accentuate the signal to the eye.
Excellent results can be found when coupling BJ RSI, with BJ TSI, and the reversal system using all 3 as a complete together simultaneously
Default color changes are plotted as a recorded value falls within the following levels:
RSI < 30 = green
RSI 30-50 = red
RSI 50-70 = blue
RSI 70-80 = yellow
RSI 80-90 = orange
RSI 90-100 = white hot

Rsi, Stoch, DMI, Doble(Stoch RSi) // By MocheroWith this indicator we seek to find convergence of the
First Oscillator (RSI, Stoch and DMI) and the Second Oscillator (Stoch, Stoch RSI 1 and Stoch RSI 2) for purchases or sales.
Search Buy when,
First Oscillator
-Rsi oversold
-Stoch over sold
-DMI oversold
Second Oscillator
-Stoch over sold
-Stoch RSI 1 oversold
-Stoch RSI 2 oversold
Suggested values
First Oscillator
Rsi: 4
Stoch: 5.1.1
DMI: 10.3
Second Oscillator
Stoch: 14.3.3
Stoch RSI 1: 14 .14.3.3
Stoch RSI 2: 6. 6.3.3
Suggested time, 3M 5M 15M

RSI Season Tracker by KrisWatersSeason tracker identifies the momentum with tracking dominance and market capitalization data of Bitcoin , Altcoin and USDT .
With this indicator you can able to get know about Bitcoin, Altcoin and USDT dominance and market capitalization easily.
Backgrond Color Definations:
If the background color of indicator is ORANGE means that Bitcoin dominance is the most powerful. It is a good sign for Bitcoin.
If the background color of indicator is BLUE means that Altcoin dominance is the most powerful. It is a good sign for Altcoins.
If the background color of indicator is GREEN means that USDT dominance is the most powerful. It is a good sign for USDT.
Plus Sign (+) Meaning and Color Definations:
If ORANGE plus sign is visible on indicator means that market capitalization of Bitcoin is increasing. It is a good sign for Bitcoin.
If BLUE plus sign is visible on indicator means that market capitalization of Altcoin is increasing. It is a good sign for Altcoins.
If GREEN plus sign is visible on indicator means that market capitalization of Bitcoin and Altcoins are decreasing. It is not a good sign for both.
Light and Dark RSI Line Color Definations:
If the line of Bitcoin color is Orange means that, RSI value was increased compared with previous bar. It is one of the good sign of the momentum strength.
If the line of Bitcoin color is Yellow means that, RSI value was decreased compared with previous bar. It is not a good sign.
If the line of Altcoin color is Navy means that, RSI value was increased compared with previous bar. It is one of the good sign of the momentum strength.
If the line of Altcoin color is Blue means that, RSI value was decreased compared with previous bar. It is not a good sign.
If the line of USDT color is Green means that, RSI value was increased compared with previous bar. It is one of good the sign of the momentum strength.
If the line of USDT color is Lime means that, RSI value was decreased compared with previous bar. It is not a good sign.
Simple RSI rules are valid for this indicator.
RSI value is under 30 indicates that asset is OVERSOLD .
RSI value is upper 70 indicates that asset is OVERBOUGHT .
Important Notice: Dominance data is not correlated with price. For example; sometimes dominance is increasing but the price is not. And that's where the market capitalization comes in.
If the plus sign is not visible , you can get questioning for the movement. It is not a good sign at all.
If the plus sign is visible and RSI is increasing , It is a good sign for the strength of assets movement.
I recommended to use on DAILY timeframe . But you can use different timeframes as well.
Please leave comment below If you have any question or development idea.

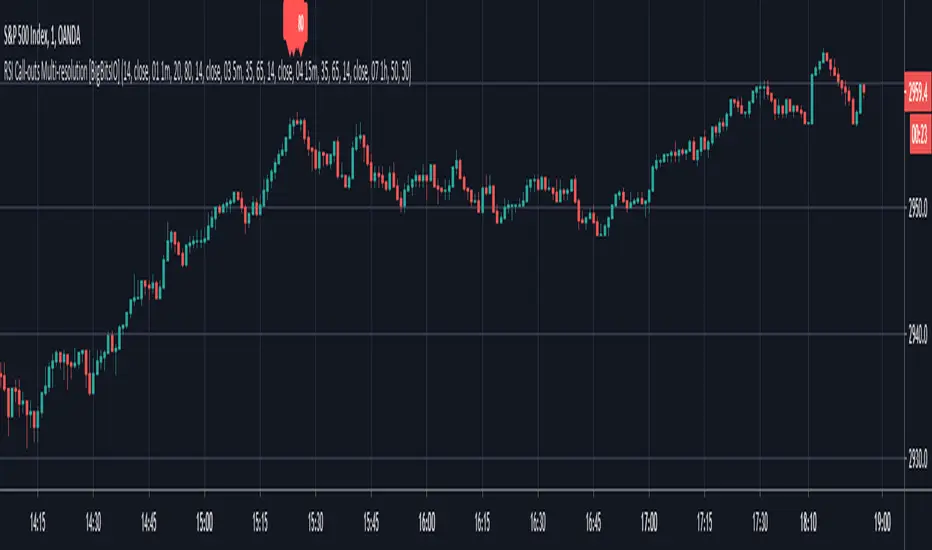
RSI Call-outs Multi-resolution [BigBitsIO]This is a simple multi-resolution (multi-timeframe) RSI indicator that overlays the current chart to show labels for specified oversold and overbought areas defined with inputs.
Up to 4 different resolutions/timeframes for their respective RSI (1,2,3, or 4). RSI1 is always enabled and can not be disabled.
Red labels with white text represent overbought RSI levels as defined by the user. All enabled RSI will have to qualify as overbought based on settings.
Green labels with black test represent oversold RSI levels as defined by the user. All enabled RSI will have to qualify as oversold based on settings.
This RSI overlay help easily call-out overbought and oversold candles on a chart where other RSI values on larger resolutions/timeframes are also oversold/overbought without sacrificing screen space for a traditional RSI indicator that is not overlayed on the chart.
This indicator has alert conditions that will trigger when all enabled RSI indicators are either oversold or overbought respective to your settings.
Note: The best results are to operate your chart as your smallest RSI resolution selected. Personally, I prefer to have my smallest (shortest timeframe) in RSI1, and go larger farther out to RSI4.
RSI + Composite Index [SHK]One of the most powerful indicator based and divergence strategies i have ever seen was made by Constance Brown.
The Composite Index:
The best way to think of the Composite Index as it applies to the RSI is to think of the RSI as Windows 3.0 and the Composite Index as Windows 10. Constance Brown discovered that the RSI, while it does create and detect divergences, does is not as accurate as it could be. It’s a bit of an oxymoron to say this but the RSI is a momentum indicator without any momentum calculation attached to it. The RSI actually misses a significant amount of important moves and even generates some bad moves. What Constance Brown did with the RSI is to input a momentum calculation within the RSI itself.
Usage:
1. Check hidden and regular divergences on RSI+COMPOSITE_INDEX and PRICE+COMPOSITE_INDEX.
2. After finding divergence wait for COMPOSITE_INDEX to cross under/over it's moving averages to trigger.
Useful Note:
"RSI overbought/oversold as filter", "RSI and COMPOSITE_INDEX trendline as trigger", "RSI 50 Over/Under as trend direction detection", ... can be add to this strategy.
Enjoy!

RSI EMA CrossOver RameshThe RSI is one of the most popular technical indicators. The RSI measures the internal strength of the security. The RSI indicator oscillates between oversold and over bought levels, where a trader is advised to look for buying opportunities when the stock is in over sold region and selling opportunities when the stock is in over bought region.
The RSI with EMA strategy signals a trade when EMA of 7 period RSI crosses over the EMA of a 14 period RSI.
Buy: when 10 EMA of 7 period RSI crossing up 10 EMA of a 14 period RSI
Sell: when 10 EMA of 7 period RSI crossing down 10 EMA of a 14 period RSI
EMA = Exponential Moving Average
Crossover = Simple crossover between current RSI values and its 10 day EMA

RSI / Stoch / SRSI / MFI / Aroon Overlay [SigmaDraconis]Combines 4 popular indicators (RSI, Stoch, SRSI, MFI) and 1 peculiar one (Aroon) in 1 for those who want to save indicators but not only.
This is an evolution of my (simpler) "RSI / Stoch / Stoch RSI (SRSI) Overlay " that you can find on my scripts.
Added bands for oversold/overbought areas (70/30 common for RSI and 80/20 for SRSI and MFI), as well as a middle 50 horizontal line.
Neutral bands around 55-45 added as well that can be hidden for less clutter. I also recommend a more transparent coloring for these since Pine script doesn't allow default transparency for horizontal lines.
By default only RSI and Stoch are activated, you can activate Aroon, MFI and SRSI on the inputs window.
Some extra notes:
* RSI, Stoch and MFI can help to strengthen one's decision as well as Aroon to predict a possible trend reversal, SRSI can show when RSI has high probability of being topped or bottomed when oversold/overbought but don't forget to look at volume and how the trend progresses that can keep SRSI above 80 or below 20 while RSI and price continues to trend, divergences are most helpful here to find possible reversal areas.
* This chart depicts some interesting divergences, as well as Stoch tops and bottoms and confluences between RSI/MFI and Stoch on some over-extended tops and bottoms that shown being good reversal zones.
RSI resistances are shown as well, failing to break above 60 or the neutral zone (this is a bearish BTC trend chart after all) or failing to gain support to break up certain levels (RSI notes a more bullish trend when consistently above 60 and more bearish below 40).
If you like it and use it to profit, please tip me below :)
Tip jars:
BTC: 15nMBiEGVrdGcu9C1h6QRcTNRvugHkqrMQ
ETH: 0xC33845946c48B61fBCbEA0367ec2238CaF2b73bc
BTS: sigma-draconis

RSI-Adaptive T3 + Squeeze Momentum Strategy✅ Strategy Guide: RSI-Adaptive T3 + Squeeze Momentum Strategy
📌 Overview
The RSI-Adaptive T3 + Squeeze Momentum Strategy is a dynamic trend-following strategy based on an RSI-responsive T3 moving average and Squeeze Momentum detection .
It adapts in real-time to market volatility to enhance entry precision and optimize risk.
⚠️ This strategy is provided for educational and research purposes only.
Past performance does not guarantee future results.
🎯 Strategy Objectives
The main objective of this strategy is to catch the early phase of a trend and generate consistent entry signals.
Designed to be intuitive and accessible for traders from beginner to advanced levels.
✨ Key Features
RSI-Responsive T3: T3 length dynamically adjusts according to RSI values for adaptive trend detection
Squeeze Momentum: Combines Bollinger Bands and Keltner Channels to identify trend buildup phases
Visual Triggers: Entry signals are generated from T3 crossovers and momentum strength after squeeze release
📊 Trading Rules
Long Entry:
When T3 crosses upward, momentum is positive, and the squeeze has just been released.
Short Entry:
When T3 crosses downward, momentum is negative, and the squeeze has just been released.
Exit (Reversal):
When the opposite condition to the entry is triggered, the position is reversed.
💰 Risk Management Parameters
Pair & Timeframe: BTC/USD (30-minute chart)
Capital (simulated): $30,00
Order size: `$100` per trade (realistic, low-risk sizing)
Commission: 0.02%
Slippage: 2 pips
Risk per Trade: 5%
Number of Trades (backtest period): 181
📊 Performance Overview
Symbol: BTC/USD
Timeframe: 30-minute chart
Date Range: January 1, 2024 – July 3, 2025
Win Rate: 47.8%
Profit Factor: 2.01
Net Profit: 173.16 (units not specified)
Max Drawdown: 5.77% or 24.91 (0.79%)
⚙️ Indicator Parameters
Indicator Name: RSI-Adaptive T3 + Squeeze Momentum
RSI Length: 14
T3 Min Length: 5
T3 Max Length: 50
T3 Volume Factor: 0.7
BB Length: 27 (Multiplier: 2.0)
KC Length: 20 (Multiplier: 1.5, TrueRange enabled)
🖼 Visual Support
T3 slope direction, squeeze status, and momentum bars are visually plotted on the chart,
providing high clarity for quick trend analysis and execution.
🔧 Strategy Improvements & Uniqueness
Inspired by the RSI Adaptive T3 by ChartPrime and Squeeze Momentum Indicator by LazyBear ,
this strategy fuses both into a hybrid trend-reversal and momentum breakout detection system .
Compared to traditional trend-following methods, it excels at capturing early trend signals with greater sensitivity .
✅ Summary
The RSI-Adaptive T3 + Squeeze Momentum Strategy combines momentum detection with volatility-responsive risk management.
With a strong balance between visual clarity and practicality, it serves as a powerful tool for traders seeking high repeatability.
⚠️ This strategy is based on historical data and does not guarantee future profits.
Always use appropriate risk management when applying it.

RSI - SECUNDARIO - mauricioofsousaSecondary RSI – MGO
Reading the rhythm behind the price action
The Secondary RSI is a specialized oscillator developed as part of the MGO (Matriz Gráficos ON) methodology. It works as a refined strength filter, designed to complement traditional RSI readings by isolating the true internal rhythm of price action and reducing the influence of market noise.
While the standard RSI measures price momentum, the Secondary RSI focuses on identifying breaks in oscillatory balance—the moments when the market shifts from accumulation to distribution or from compression to expansion.
🎯 What the Secondary RSI highlights:
Internal imbalances in energy between buyers and sellers
Micro-divergences not visible on standard RSI
Areas of price fatigue or overextension that often precede reversals
Confirmation zones for MGO oscillatory events (RPA, RPB, RBA, RBB)
📊 Recommended use:
Combine with the Primary RSI for dual-layer validation
Use as a noise-reduction tool before entering trends
Ideal in medium timeframes (12H / 4H) where oscillatory patterns form clearly
🧠 How it works:
The Secondary RSI recalculates the momentum signal using a block-based interpretation (aligned with the MGO structure) instead of simply following raw candle data. It adapts to the periodic nature of price behavior and provides the trader with a more stable and reliable measure of true market strength.

RSI+Stoch Band Oscillator📈 RSI + Stochastic Band Oscillator
Overview:
The RSI + Stochastic Band Oscillator is a technical indicator that combines the strengths of both the Relative Strength Index (RSI) and the Stochastic Oscillator. Instead of using static thresholds, this indicator dynamically constructs upper and lower bands based on the RSI and Stochastic overbought/oversold zones. It then measures the relative position of the current price within this adaptive range, effectively producing a normalized oscillator.
Key Components:
RSI-Based Dynamic Bands:
Using RSI values and exponential moving averages of price changes, upper and lower dynamic bands are constructed.
These bands adjust based on overbought and oversold levels, offering a more responsive framework than fixed RSI thresholds.
Stochastic-Based Dynamic Bands:
Similarly, Stochastic %K and %D values are used to construct dynamic bands.
These adapt to overbought and oversold levels by recalculating potential high/low values within the lookback window.
Oscillator Calculation:
The oscillator (osc) is computed as the relative position of the current close within the combined upper and lower bands of both RSI and Stochastic.
This value is normalized between 0 and 100, allowing clear identification of extreme conditions.
Visual Features:
The oscillator is plotted as a line between 0 and 100.
Color-filled areas highlight when the oscillator enters extreme zones:
Above 100 with falling momentum: Red zone (potential reversal).
Below 0 with rising momentum: Green zone (potential reversal).
Additional trend conditions (falling/rising RSI, %K, and %D) are used to strengthen reversal signals by confirming momentum shifts.

RSI with Bollinger Bands and Buy/Sell SignalsPurpose:
This indicator combines the Relative Strength Index (RSI) with Bollinger Bands to identify overbought and oversold conditions in the market. It also generates buy and sell signals based on the interaction between the RSI and the Bollinger Bands. It is particularly useful for traders looking for opportunities in volatile or trending markets.
How It Works:
RSI (Relative Strength Index):
The RSI measures the magnitude of recent price changes to evaluate whether an asset is overbought (values > 70) or oversold (values < 30).
In this indicator, horizontal lines at levels 70 (overbought) and 30 (oversold) are used as reference points.
Bollinger Bands:
Bollinger Bands are calculated around a smoothed moving average of the RSI. The upper band represents dynamic overbought levels, while the lower band indicates dynamic oversold levels.
These bands automatically adjust their width based on the volatility of the RSI, allowing them to adapt to different market conditions.
Buy and Sell Signals:
Buy Signal: A buy signal is generated when the RSI exceeds both the upper Bollinger Band and the overbought level (70). This suggests that the asset is in an extreme bullish phase.
Sell Signal: A sell signal is generated when the RSI falls below both the lower Bollinger Band and the oversold level (30). This suggests that the asset is in an extreme bearish phase.
Alerts:
The indicator includes automatic alerts to notify you when buy or sell signals are generated. This allows traders to act quickly on new opportunities.
Best Practices:
Confirmation in Lower Timeframes:
Although this indicator is powerful, it is recommended to confirm signals in lower timeframes before making trading decisions. For example:
If you receive a buy signal on a 4-hour chart, check if the RSI and Bollinger Bands on lower timeframes (such as 1 hour or 15 minutes) also show bullish signals.
This reduces the risk of false positives and increases the accuracy of your entries.
Use in Trends:
This indicator works best in markets with clear trends. In sideways or low-volatility markets, signals may be less reliable due to the lack of directional momentum.
Risk Management:
Always use stop-loss and take-profit to protect your positions. Buy and sell signals are just one tool for analysis; they do not guarantee results.
Combination with Other Indicators:
To improve accuracy, consider combining this indicator with others, such as MACD, Stochastic Oscillator, or Japanese candlestick patterns. This can provide additional confirmation before opening a position.
Summary:
The RSI + Bollinger Bands with Buy/Sell Signals indicator is an advanced tool designed to identify entry and exit points in the market based on extreme overbought and oversold conditions. However, to maximize its effectiveness, it is crucial to confirm signals in lower timeframes and use it in combination with other technical analysis tools. With proper risk management and careful interpretation of signals, this indicator can be a valuable ally in your trading strategy.

RSI Volatility Suppression Zones [BigBeluga]RSI Volatility Suppression Zones is an advanced indicator that identifies periods of suppressed RSI volatility and visualizes these suppression zones on the main chart. It also highlights breakout dynamics, giving traders actionable insights into potential market momentum.
🔵 Key Features:
Detection of Suppression Zones:
Identifies periods where RSI volatility is suppressed and marks these zones on the main price chart.
Breakout Visualization:
When the price breaks above the suppression zone, the box turns aqua, and an upward label is drawn to indicate a bullish breakout.
If the price breaks below the zone, the box turns purple, and a downward label is drawn for a bearish breakout.
Breakouts accompanied by a "+" label represent strong moves caused by short-lived, tight zones, signaling significant momentum.
Wave Labels for Consolidation:
If the suppression zone remains unbroken, a "wave" label is displayed within the gray box, signifying continued price stability within the range.
Gradient Intensity Below RSI:
A gradient strip below the RSI line increases in intensity based on the duration of the suppressed RSI volatility period.
This visual aid helps traders gauge how extended the low volatility phase is.
🔵 Usage:
Identify Breakouts: Use color-coded boxes and labels to detect breakouts and their direction, confirming potential trend continuation or reversals.
Evaluate Market Momentum: Leverage "+" labels for strong breakout signals caused by short suppression phases, indicating significant market moves.
Monitor Price Consolidation: Observe gray boxes and wave labels to understand ongoing consolidation phases.
Analyze RSI Behavior: Utilize the gradient strip to measure the longevity of suppressed volatility phases and anticipate breakout potential.
RSI Volatility Suppression Zones provides a powerful visual representation of RSI volatility suppression, breakout signals, and price consolidation, making it a must-have tool for traders seeking to anticipate market movements effectively.

RSI Strategy With TP/SL - Lower TFThis Pine Script strategy integrates the Relative Strength Index (RSI) for trade signals with user-defined Take Profit (TP) and Stop Loss (SL) levels. It's designed for flexible application in different market conditions, offering long, short, or dual-direction trading.
Short Description
The strategy uses the RSI to identify overbought and oversold market conditions:
Buy signal: When RSI drops below the specified "Buy Level."
Sell signal: When RSI rises above the "Sell Level."
Additionally, it manages risk and profit targets with:
Take Profit (TP): Exits trades when the price reaches a percentage gain.
Stop Loss (SL): Exits trades to limit losses if the price falls by a certain percentage.
The strategy is versatile and includes options for visualizing performance, monthly profit/loss data, and detailed trade metrics.
How to Use
Set Parameters:
RSI Period: Default is 14. Adjust based on your analysis.
RSI Buy/Sell Levels:
Buy Level: Default is 40. Consider higher levels for conservative entries.
Sell Level: Default is 60. Lower this for earlier exits.
Take Profit (%): Set your profit target (default: 5%).
Stop Loss (%): Set your risk tolerance (default: 2%).
Trade Direction: Choose "Long Only," "Short Only," or "Both."
Interpret Signals:
Buy signals appear when RSI crosses below the buy threshold.
Sell signals appear when RSI crosses above the sell threshold.
Risk Management:
The strategy dynamically calculates TP and SL levels for each trade.
TP/SL is applied using the percentage input based on the entry price.
Monitor Performance:
Review trade statistics in the "Strategy Tester."
Use the monthly performance table to track P/L across months.
Customize Alerts:
Alerts for buy, sell, TP, and SL events can be used to automate notifications.
Key Features
Configurable RSI Settings: Adaptable to various market conditions.
Risk Management: Built-in TP and SL management.
Customizable Trade Direction: Tailored for long-only, short-only, or both directions.
Monthly P/L Table: Visualizes performance trends over time.
Alerts: Notifies when critical trade events occur.
Please do your own research before ase this to your real trading.

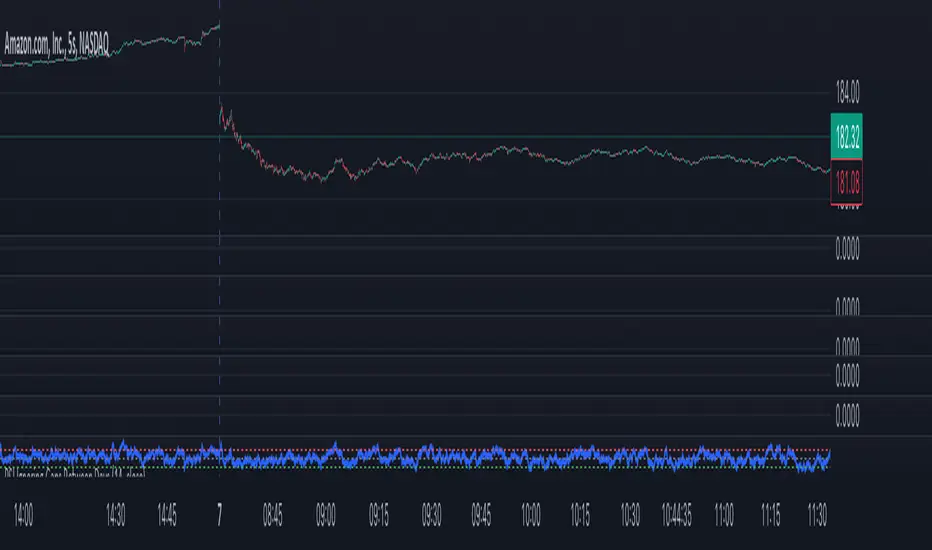
RSI Ignoring Gaps Between DaysThe RSI Ignoring Gaps Between Days indicator is an advanced modification of the traditional Relative Strength Index (RSI) designed to exclude price gaps that occur between the last bar of one trading day and the first bar of the next. This ensures that the RSI calculations remain focused on the actual price action during the trading session, avoiding distortions caused by overnight price gaps.
Key Features:
Gap Ignoring Mechanism: The indicator detects when a new day begins and skips the price change between the last bar of the previous day and the first bar of the current day. This ensures that only the intra-day price changes are included in the RSI calculation.
Intra-day Price Movement: The RSI calculations are based on real price changes within each trading day, providing a clearer reflection of momentum without interference from overnight events.
Dynamic RSI Calculation: The traditional RSI formula is preserved, but gains and losses are recalculated based on price changes from bar to bar within the same day.
Overbought/Oversold Levels: The indicator retains standard RSI overbought (70) and oversold (30) levels, allowing traders to easily identify potential reversal zones.
Alerts for Crossovers: Built-in alert conditions trigger when the RSI crosses key levels (30 or 70), signaling potential buying or selling opportunities.
This indicator is particularly useful for traders looking to focus on intra-day price action and avoid the influence of gaps caused by overnight market activity. It is suitable for intraday trading strategies where consistency in price movement measurement is crucial.
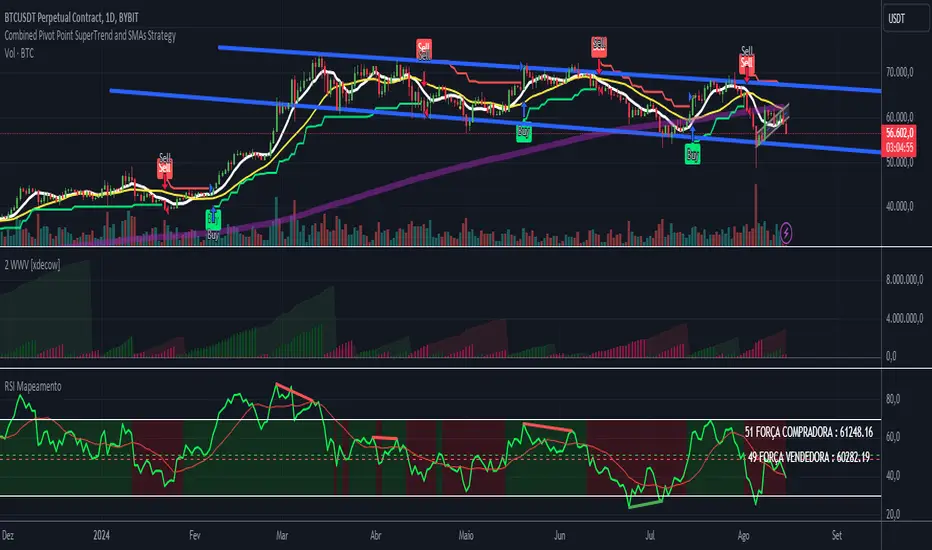
RSI - ARIEIVhe RSI MAPPING - ARIEIV is a powerful technical indicator based on the Relative Strength Index (RSI) combined with moving averages and divergence detection. This indicator is designed to provide a clear view of overbought and oversold conditions, as well as identifying potential reversals and signals for market entries and exits.
Key Features:
Customizable RSI:
The indicator offers flexibility in adjusting the RSI length and data source (closing price, open price, etc.).
The overbought and oversold lines can be customized, allowing the RSI to signal critical market zones according to the trader’s strategy.
RSI-Based Moving Averages (MA):
Users can enable a moving average based on the RSI with support for multiple types such as SMA, EMA, WMA, VWMA, and SMMA (RMA).
For those who prefer Bollinger Bands, there’s an option to use the moving average with standard deviation to detect market volatility.
Divergence Detection:
Detects both regular and hidden divergences (bullish and bearish) between price and RSI, which can indicate potential market reversals.
These divergences can be customized with specific colors for easy identification on the chart, allowing traders to quickly spot significant market shifts.
Zone Mapping:
The script maps zones of buying and selling strength, filling the areas between the overbought and oversold levels with specific colors, highlighting when the market is in extreme conditions.
Strength Tables:
At the end of each session, a table appears on the right side of the chart, displaying the "Buying Strength" and "Selling Strength" based on calculated RSI levels. This allows for quick analysis of the dominant pressure in the market.
Flexible Settings:
Many customization options are available, from adjusting the number of decimal places to the choice of colors and the ability to toggle elements on or off within the chart.
RSI Trail [UAlgo]The RSI Trail indicator is a technical analysis tool designed to assist traders in making informed decisions by utilizing the Relative Strength Index (RSI) and various moving average calculations. This indicator dynamically plots support and resistance levels based on RSI values, providing visual cues for potential bullish and bearish signals. The inclusion of a trailing stop mechanism allows traders to adapt to market volatility, ensuring optimal entry and exit points.
🔶 Key Features
Multiple Moving Average Types: Choose from Simple Moving Average (SMA), Exponential Moving Average (EMA), Weighted Moving Average (WMA), Running Moving Average (RMA), and McGinley Dynamic for diverse analytical approaches.
Configurable RSI Bounds: Tailor the RSI lower and upper bounds to your specific trading preferences, with default settings at 40 and 60.
Signals: The indicator determines bullish and bearish market states and plots corresponding signals on the chart.
Customizable Visualization: Options to display the midline and color candles based on market state enhance visual analysis.
Alerts: Integrated alert conditions notify you of bullish and bearish signals.
🔶 Calculations
The RSI Trail indicator calculates dynamic support and resistance levels using a combination of moving averages and the Relative Strength Index (RSI). It starts by computing a chosen moving average (SMA, EMA, WMA, RMA, or McGinley) over a period of 27 using the typical price (ohlc4).
The indicator then defines upper and lower bounds based on customizable RSI levels (default 40 and 60) and adjusts these bounds using the Average True Range (ATR) to account for market volatility. The upper bound is calculated by adding a volatility-adjusted value to the moving average, while the lower bound is found by subtracting this value. Bullish signals occur when the price crosses above the upper bound, and bearish signals when it falls below the lower bound.
The RSI Trail indicator also can be used to identify pullback opportunities. When the price high/low crosses above/below the calculated upper/lower bound, it indicates a potential pullback, suggesting a favorable point to enter a trade during a pullback.
🔶 Disclaimer
This indicator is for informational purposes only and should not be considered financial advice.
Always conduct your own research and due diligence before making any trading decisions. Past performance is not necessarily indicative of future results.
