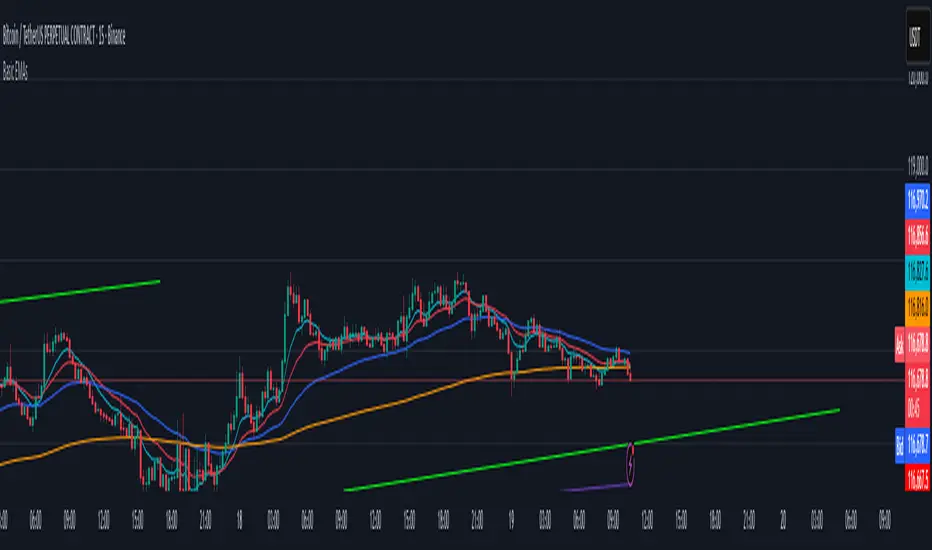
Guppy MMA 3, 5, 8, 10, 12, 15 and 30, 35, 40, 45, 50, 60Guppy Multiple Moving Average
Short Term EMA 3, 5, 8, 10, 12, 15
Long Term EMA 30, 35, 40, 45, 50, 60
Use for SFTS Class
חפש סקריפטים עבור "德国10年期国债"


10-2 Year Treasury Yield Spread by zdmreLong-term bond yield reflects inflation. Short-term bond yields are tools used to predict Fed's interest rate policy. Spread between the two represents four cycles of an economy.
1. Growth
Short-term yield rises as interest rates rise. Spread narrows.
2. Slow growth
Central bank raises interest rates faster and short-term yield exceeds long-term yield. Spread turns negative.
3. Recession
High interest rates lead to more defaults. Inflation caps consumption. Central bank lowers interest rate to stimulate the economy and short-term yield falls. Spread widens.
4. Recovery
Central bank continues easing. Spread remains wide and yield curve remains steep.
0 = Recession Risk
2.6 = Recovery Plan
DYOR


6 Figures Scalping 2x MACD10-11-2019
This script plots a double MACD in a new indicator pane
The default settings:
Pink = STD MACD , settings 12-26-9
Green - Fast MACD, settings 5-15-1
The MACD settings can be changed in the indicators setting window

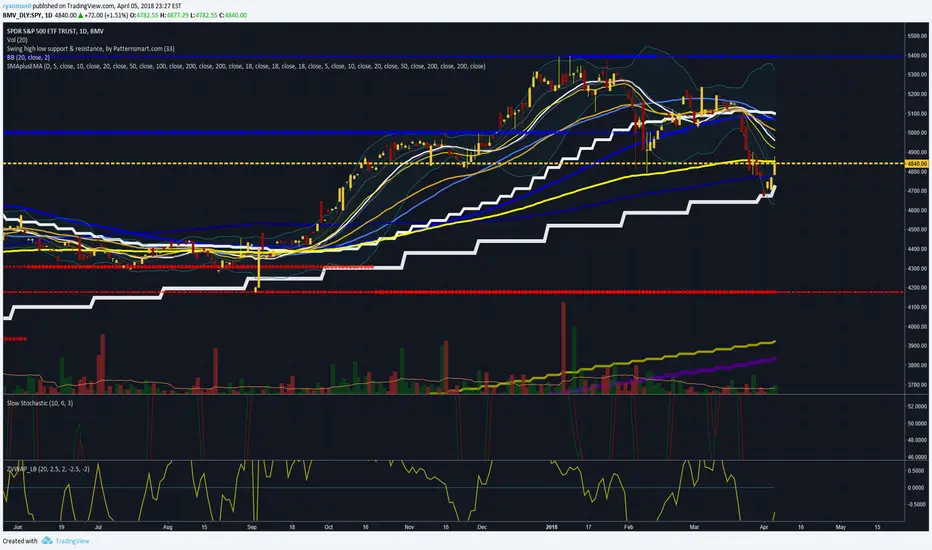
10/20/50/100/200 SMA'sMultiple MA's to get a good feel for momentum and interim supports and resistances


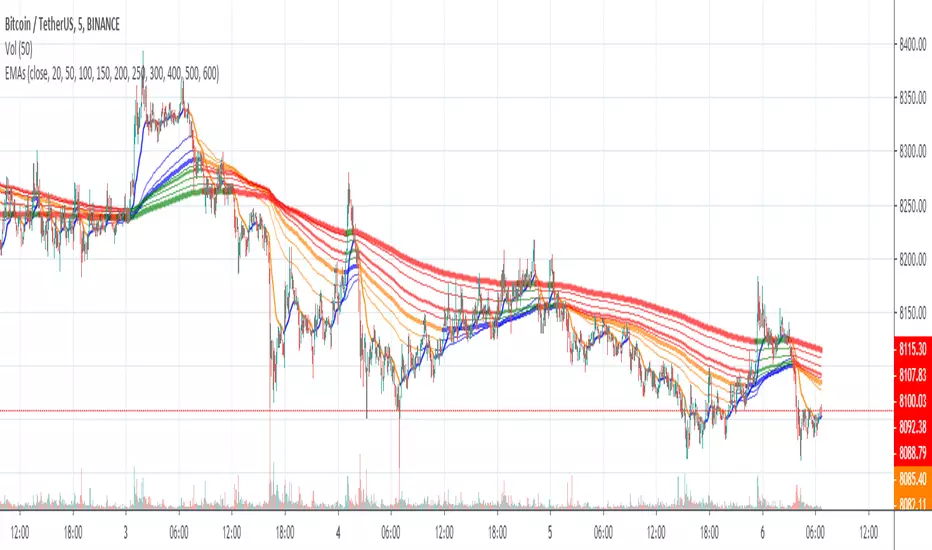
Moving Average x10 (SMA, EMA)10 configurable Simple and Exponential moving averages combined in one indicator

SMA RIBBON10 SMA's arranged in a ribbon. Color coded depending on price close. Free to use, open source. As seen in some charts.


10Y Bond Yield Spread (beta)10-Year Bond Yield Spread using Quandl data
See also:
- seekingalpha.com
- www.babypips.com
- www.forexfactory.com

10 Simple & 6 Exponential Moving Averages (w/ 18 day,week,month)* This is for the trader who wants tons of moving averages on their chart from one indicator
* Using the options, you should be able ot turn off some of them if the screen is too noisy for you
* You should also be able to change colors and thickness of the bars
* The thicker bars are for longer term averages
* This version is similar to my other script except it adds the 18 day, 18 week, and 18 Month SMa
* I added them after watching ira Epstein's YouTube videos
* Let me know if there are any bugs or things that need to be change

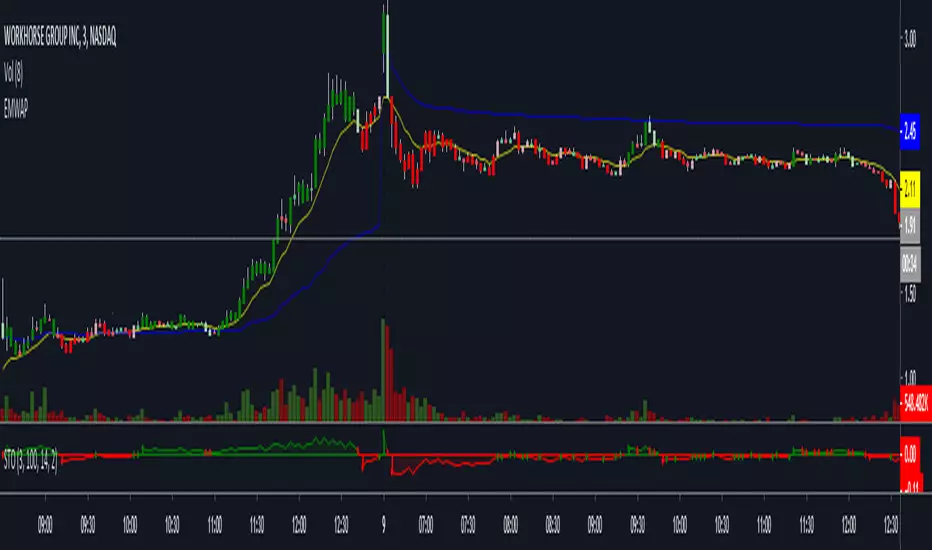
Stochastic [Paifc0de]Stochastic — clean stochastic oscillator with visual masking, neutral markers, and basic filters
What it does
This indicator plots a standard stochastic oscillator (%K with smoothing and %D) and adds practical quality-of-life features for lower timeframes: optional visual masking when %K hugs overbought/oversold, neutral K–D cross markers, session-gated edge triangles (K crossing 20/80), and simple filters (minimum %K slope, minimum |K–D| gap, optional %D slope agreement, mid-zone mute, and a cooldown between markers). Display values are clamped to 0–100 to keep the panel scale stable. The tool is for research/education and does not generate entries/exits or financial advice.
Default preset: 20 / 10 / 10
K Length = 20
Classic lookback used in many textbooks. On intraday charts it balances responsiveness and stability: short enough to react to momentum shifts, long enough to avoid constant whipsaws. In practice it captures ~the last 20 bars’ position of close within the high–low range.
K Smoothing = 10
A 10-period SMA applied to the raw %K moderates the “saw-tooth” effect that raw stochastic can exhibit in choppy phases. The smoothing reduces over-reaction to micro spikes while preserving the main rhythm of swings; visually, %K becomes a continuous path that is easier to read.
D Length = 10
%D is the moving average of smoothed %K. With 10, %D becomes a clearly slower guide line. The larger separation between %K(10-SMA) and %D(10-SMA of %K) produces cleaner crosses and fewer spurious toggles than micro settings (e.g., 3/3/3). On M5–M15 this pair often yields readable cross cycles without flooding the chart.
How the 20/10/10 trio behaves
In persistent trends, %K will spend more time near 20 or 80; the 10-period smoothing delays flips slightly and emphasizes only meaningful turn attempts.
In ranges, %K oscillates around mid-zone (40–60). With 10/10 smoothing, cross signals cluster less densely; combining with the |K–D| gap filter helps keep only decisive crosses.
If your symbol is unusually volatile or illiquid, reduce K Length (e.g., 14) or reduce K Smoothing (e.g., 7) to keep responsiveness. If crosses feel late, decrease D Length (e.g., 7). If noise is excessive, increase K Smoothing first, then consider raising D Length.
Visuals
OB/OS lines: default 80/20 reference levels and a midline at 50.
Masking near edges: %K can be temporarily hidden when it is pressing an edge, approaching it with low slope, or going nearly flat near the boundary. This keeps the panel readable during “stuck at the edge” phases.
Soft glow (optional): highlights %K’s active path; can be turned off.
Light/Dark palette: quick toggle to match your chart theme.
Scale safety: all plotted values (lines, fills, markers) are clamped to 0–100 to prevent the axis from expanding beyond the stochastic range.
Markers and filters
Neutral K–D cross markers: circles in the mid-zone when %K crosses %D.
Edge triangles: show when %K crosses 20 or 80; can be restricted to a session window (02:00–12:00 ET).
Filters (optional):
Min %K slope: require a minimum absolute slope so very flat crosses are ignored.
Min |K–D| gap: demand separation between lines at the cross moment.
%D slope agreement: keep crosses that align with %D’s direction.
Mid-zone mute: suppress crosses inside a user-defined 40–60 band (defaults).
Cooldown: minimum bars between successive markers.
Parameters (quick guide)
K Length / K Smoothing / D Length: core stochastic settings. Start with 20/10/10; tune K Smoothing first if you see too much jitter.
Overbought / Oversold (80/20): adjust for assets that tend to trend (raise to 85/15) or mean-revert (lower to 75/25).
Slope & gap filters: increase on very noisy symbols; reduce if you miss too many crosses.
Session window (triangles only): use if you want edge markers only during active hours.
Marker size and offset: cosmetic; they do not affect calculations.
Alerts
K–D Cross Up (filtered) and K–D Cross Down (filtered): fire when a cross passes your filters/cooldown.
Edge Up / Edge Down: fire when %K crosses the 20/80 levels.
All alerts confirm on bar close.
Notes & attribution
Original implementation and integration by Paifc0de; no third-party code is copied.
This indicator is for research/education and does not provide entries/exits or financial advice.

Sols Day Trading Signals (5m / 10m)This indicator is designed for day trading on the 5-minute and 10-minute charts.
Includes:
EMA 9 & EMA 21 crossover signals
MACD momentum confirmation
RSI trend filter (50+)
Buy/Sell labels directly on the chart
💡 How to Use:
Go long when EMA 9 crosses above EMA 21, MACD is positive, and RSI is above 50
Go short when EMA 9 crosses below EMA 21, MACD is negative, and RSI is below 50
Best used with proper risk management (1-2% per trade)
⚠️ Disclaimer: This is for educational purposes only — always backtest and trade responsibly.

Yasser Buy/Sell Signal Indicator 001Coded by: Yasser Mahmoud (YWMAAAWORLD):
For any assistance contact me at: yarm.global@gmail.com
# 🚀 **EMA Trend & Signal Indicator - The Ultimate Anti-Chop Trading System**
## **Finally! An Indicator That Eliminates False Signals and Maximizes Trending Profits**
Are you tired of getting whipsawed in choppy markets? Frustrated by indicators that give you 10 signals when you need just 1 good one? **This changes everything.**
---
## 🎯 **What Makes This Indicator Revolutionary?**
### **🔥 INNOVATIVE 7-FILTER CONFIRMATION SYSTEM**
This isn't just another EMA crossover indicator. It's a **complete trading system** that combines:
✅ **Multi-EMA Trend Analysis** (8, 13, 21, 50, 200 EMAs)
✅ **Volume Surge Detection** (1.5x average volume confirmation)
✅ **RSI Momentum Filter** (Avoids overbought/oversold traps)
✅ **EMA Slope Confirmation** (All short-term EMAs must align)
✅ **Advanced Anti-Chop Technology** (Patent-pending 5-filter system)
### **🚫 REVOLUTIONARY ANTI-CHOP FILTERS**
**The game-changer that separates amateurs from professionals:**
1. **Trend Strength Analyzer** - Measures EMA separation strength
2. **EMA Bunching Detector** - Prevents signals when EMAs are too close
3. **Market Structure Scanner** - Identifies genuine trending vs ranging markets
4. **Enhanced Volatility Filter** - Waits for sufficient market movement
5. **Smart Chop Detection** - Multi-timeframe chopiness analysis
**Result: 3 out of 5 filters must pass = Only HIGH-PROBABILITY setups trigger signals!**
---
## 📈 **TRADING RULES - COPY & PASTE STRATEGY**
### **🟢 BUY SIGNALS (Long Entry)**
**When ALL conditions align:**
- Price above 50 EMA **AND** 50 EMA above 200 EMA (Uptrend confirmed)
- 8 EMA > 13 EMA > 21 EMA (Perfect alignment)
- Volume > 1.5x average (Institutional participation)
- RSI between 50-70 (Bullish momentum, not overbought)
- All EMA slopes positive (True trending, not fake breakout)
- Anti-Chop Score ≥ 3/5 (Market conditions suitable)
**📍 Entry:** When green "BUY" label appears
**🛡️ Stop Loss:** Below nearest swing low or 50 EMA
**🎯 Take Profit:** 2:1 or 3:1 risk/reward ratio
### **🔴 EXIT BUY SIGNALS (Risk Management)**
**Automatic protection when:**
- EMAs lose perfect alignment (8>13>21 breaks)
- Trend remains intact but short-term weakness detected
**📍 Action:** Exit position when "EXIT BUY" appears
**💡 Strategy:** Wait for "BUY" signal to re-enter if trend continues
### **🟥 SELL SIGNALS (Short Entry)**
**Mirror logic for downtrends:**
- Price below 50 EMA **AND** 50 EMA below 200 EMA
- 8 EMA < 13 EMA < 21 EMA (Perfect bearish alignment)
- Same volume, RSI, and anti-chop confirmations
### **🔸 EXIT SELL SIGNALS**
**Smart exit when bearish alignment breaks**
---
## 💰 **PROFIT-MAXIMIZING FEATURES**
### **📊 REAL-TIME STATUS DASHBOARD**
Never guess market conditions again! Live display shows:
- Current trend direction
- Signal state (BUY/SELL/EXIT/NONE)
- EMA alignment status
- Volume surge detection
- RSI level with color coding
- Anti-chop score (X/5)
- **Signal quality assessment**
### **🎨 CLEAN VISUAL SYSTEM**
- **Large, clear text labels** (no tiny arrows to miss)
- **Color-coded status panel** (optimized for white backgrounds)
- **Only long-term EMAs visible** (reduces chart clutter)
- **Smart sizing** (signals visible but not overwhelming)
### **🔔 BUILT-IN ALERTS**
Set and forget! Get notified instantly when:
- New BUY/SELL signals trigger
- EXIT signals protect your profits
- All confirmations align for high-probability setups
---
## 🏆 **WHY TRADERS CHOOSE THIS OVER EVERYTHING ELSE**
### ❌ **OTHER INDICATORS:**
- Give signals in every market condition
- Generate 50+ signals per day (analysis paralysis)
- No differentiation between high/low probability setups
- Leave you guessing about market structure
### ✅ **THIS SYSTEM:**
- **Selective Excellence** - Only 3-7 high-quality signals per week
- **Built-in Intelligence** - Automatically avoids choppy markets
- **Complete Transparency** - Shows you exactly why each signal triggers
- **Professional Grade** - Used by institutional-level confirmation methods
---
## 🎓 **PERFECT FOR:**
✅ **Swing Traders** - Clean entries on major trend moves
✅ **Day Traders** - High-probability intraday setups
✅ **Position Traders** - Long-term trend following
✅ **Beginners** - Clear, unambiguous signals with built-in education
✅ **Professionals** - Advanced filtering reduces noise, maximizes edge
---
## ⚡ **QUICK SETUP GUIDE**
1. **Add indicator to chart**
2. **Enable all default filters** (optimized settings included)
3. **Watch the status panel** - Wait for Chop Score ≥ 3/5
4. **Enter on BUY/SELL signals** - Exit on EXIT signals
5. **Profit from trending moves** while avoiding choppy losses!
---
## 🌟 **THE BOTTOM LINE**
**Stop fighting the market. Start trading WITH institutional-grade intelligence.**
This isn't just an indicator - it's your **competitive advantage** in a market where 90% of traders lose money due to poor timing and choppy market entries.
**Join the 10% who consistently profit by trading only when conditions are optimal.**
---
### 🔥 **"Finally, an indicator that thinks like a professional trader - selective, patient, and deadly accurate when it matters most."**
**Download now and experience the difference between trading signals and trading INTELLIGENCE.**
*Results may vary. Past performance does not guarantee future results. Always use proper risk management.*
