MTF Intraday v2.0📊 Description
MTF Intraday v2.0 is an informative indicator for analyzing trend strength across multiple timeframes simultaneously. Designed specifically for intraday (session) trading during European and US market hours.
The indicator shows the real market picture without lagging signals - you see the trend strength right now for each timeframe.
🎯 Key Features
1. Multi-Timeframe Analysis (D1, H4, H1, M30, M15)
Analyzes 4 indicators on each TF: SuperTrend, RSI, EMA crossover, EMA200
Shows strength for each timeframe: STRONG / MED / WEAK
Color indication: 🟢 green (LONG strong), 🔴 red (SHORT strong), 🟡 yellow (medium), ⚪ gray (weak)
2. Intraday Trading Hierarchy
D1 - global context (affects quality assessment)
H4 - general (sets the main trend)
H1 - reference point for intraday
M30/M15 - finding entry points during sessions
3. Market Pulse
🔥 HOT - when both H4 and H1 are STRONG (best time to enter!)
✓ GOOD - when H4 or H1 is STRONG
L:45 S:20 - balance of power between LONG and SHORT (statistics instead of "wait")
4. Volume Indicator (24 hours)
Shows volume change over the last 24 hours
SPIKE! - when volume increased by the set % (default 50%)
Considers candle color: 🟢 LONG spike (rise + green candle), 🔴 SHORT spike (rise + red candle)
Works on any timeframe (automatically recalculates)
5. Compact Mode
OFF - shows all details: every indicator for each TF
ON - only strength per timeframe (for clean chart)
⚙️ Settings
Main:
SuperTrend Period (21) / Multiplier (6.3)
RSI Length (14)
EMA Short (50) / Long (100) / 200
Compact Mode - hide detailed indicators
Volume:
Show Volume - show/hide volume indicator
Volume Alerts ON/OFF - enable/disable volume alerts
Volume Spike (%) - spike threshold (30% / 50% / 100%)
🔔 Alerts
The indicator has 5 types of alerts:
Market HOT - H4 and H1 simultaneously became STRONG
VOL LONG - volume spike on bullish candle
VOL SHORT - volume spike on bearish candle
EMA200 UP - price crossed EMA200 upward
EMA200 DN - price crossed EMA200 downward
Set up in TradingView: Create Alert → Select desired alert from the list
📈 How to Use
For finding entry points:
Check H4 - should be at least MED (better STRONG)
Verify H1 - main filter for intraday
Wait for pulse "🔥 HOT" or at least "✓ GOOD"
Look at M30/M15 - seek confirmation
Check 24h VOL - if SPIKE, momentum has started
Quality Assessment:
EXCELLENT ⭐ - all stars aligned (D1 with us, high score)
GOOD - good setup
WARNING ⚠️ - D1 against trend (counter-trend, be careful!)
Color Indication:
🟢 Green cells - bullish signal
🔴 Red cells - bearish signal
🟡 Yellow cells - neutral/waiting
🟠 Orange TF labels - for readability
⚠️ Important
This is an informative indicator, not a trading system
Does not give "entry/exit" signals - shows trend strength in the moment
Use together with Price Action and your trading strategy
RSI on M15 is displayed but not counted (too much noise)
💡 Who is it for
✅ Intraday traders (Europe/US sessions)
✅ Scalpers on crypto and forex
✅ Swing traders for trend confirmation
✅ Those who trade on multiple timeframes simultaneously
חפש סקריפטים עבור "油价调整最新消息:国内油价今日24时上调多少"

Custom MTF EMA CloudsVisualize market structure and trend alignment across multiple timeframes with six layered EMA clouds — from short-term momentum to macro trend anchors.
Each pair of EMAs forms a dynamic cloud that adapts to your selected timeframe.
Colors, lengths, and visibility are fully customizable, allowing you to tailor the setup for any trading style.
⚙️ Default Configuration
EMA Short Long Purpose
1 8 13 🔸 Intraday momentum cloud (scalping layer)
2 21 24 🟩 Short-term trend confirmation
3 50 55 🔵 Medium-term swing structure
4 120 144 🔴 Long-term support/resistance band
5 200 238 🟠 Institutional trend foundation
6 400 460 🟣 Macro directional anchor
🧩 Features
✅ Up to 6 independent EMA clouds
✅ Fully customizable short & long lengths
✅ Individual line and cloud colors
✅ Toggle each layer on/off
✅ Works with any timeframe via the Resolution input
✅ Automatic cloud transparency for better chart clarity
📈 How to Use
Use EMA 1–2 (8/13, 21/24) for momentum shifts and intraday entries.
Use EMA 3–4 (50/55, 120/144) for swing confirmation and trend continuation.
Use EMA 5–6 (200/238, 400/460) as long-term anchors to stay aligned with institutional flow.
Watch for crossovers or price breaking in/out of clouds — they often precede strong directional moves.

India VIX Based Nifty/BankNifty Range Calculator (Auto Fetch)VIX-Based Expected Daily Range (Auto Volatility Forecast)
Created by: Harshiv Symposium
📖 Purpose
This indicator automatically fetches the India VIX value and calculates the expected daily price range for major Indian indices such as Nifty and BankNifty.
It helps traders understand how much the market is likely to move today based on current volatility conditions.
Designed for educational and analytical awareness, not for signals or profit-making systems.
⚙️ Core Logic
Expected Daily Move (Range) = (India VIX × Current Index Price) ÷ Multiplier
- Multiplier for Nifty: 1000
- Multiplier for BankNifty: 700
This calculation projects the 1-standard-deviation (≈ 68% probability) and 2-standard-deviation (≈ 95% probability) movement zones for the day.
📊 Example
If India VIX = 15 and Nifty = 25,000:
Expected Move ≈ (15 × 25,000) ÷ 1000 = 375 points
Hence,
- 68% Range: 24,625 – 25,375
- 95% Range: 24,250 – 25,750
This gives traders a realistic idea of daily volatility boundaries.
🧭 Key Features
✅ Auto-Fetch India VIX
No need for manual input — automatically pulls live data from NSE:INDIAVIX.
✅ Dynamic Range Visualization
Plots upper/lower boundaries for 1σ and 2σ probability zones with shaded expected-move area.
✅ Dashboard Panel
Displays:
- Current VIX
- Expected Move (in points and %)
- Upper and Lower Ranges
✅ Smart Alerts
Alerts when price crosses upper or lower volatility range — potential breakout signal.
🎯 How It Helps
Intraday Traders:
Know the likely daily movement (e.g., ±220 pts on Nifty) and plan realistic targets or stops.
Options Traders:
Quickly assess whether it’s a seller-friendly (low VIX, small range) or buyer-friendly (high VIX, large range) session.
Risk Managers:
Use volatility context for stop-loss width and position sizing.
Breakout Traders:
If price breaks beyond the 2σ range → indicates potential volatility expansion.
💡 Interpretation Guide
Condition Market Behavior Strategy Insight
VIX ↓ ( < 14 ) Calm / Range-bound Option Selling Edge
VIX ↑ ( > 20 ) Volatile Sessions Option Buying Edge
Price within Range Stable Market Mean Reversion Setups
Price breaks Range Volatility Expansion Breakout Trades
⚠️ Disclaimer
This indicator is for educational and awareness purposes only.
It does not generate buy/sell signals or guarantee returns.
Always apply your own analysis and risk management.

Luxy Momentum, Trend, Bias and Breakout Indicators V7
TABLE OF CONTENTS
This is Version 7 (V7) - the latest and most optimized release. If you are using any older versions (V6, V5, V4, V3, etc.), it is highly recommended to replace them with V7.
Why This Indicator is Different
Who Should Use This
Core Components Overview
The UT Bot Trading System
Understanding the Market Bias Table
Candlestick Pattern Recognition
Visual Tools and Features
How to Use the Indicator
Performance and Optimization
FAQ
---
### CREDITS & ATTRIBUTION
This indicator implements proven trading concepts using entirely original code developed specifically for this project.
### CONCEPTUAL FOUNDATIONS
• UT Bot ATR Trailing System
- Original concept by @QuantNomad: (search "UT-Bot-Strategy"
- Our version is a complete reimplementation with significant enhancements:
- Volume-weighted momentum adjustment
- Composite stop loss from multiple S/R layers
- Multi-filter confirmation system (swing, %, 2-bar, ZLSMA)
- Full integration with multi-timeframe bias table
- Visual audit trail with freeze-on-touch
- NOTE: No code was copied - this is a complete reimplementation with enhancements.
• Standard Technical Indicators (Public Domain Formulas):
- Supertrend: ATR-based trend calculation with custom gradient fills
- MACD: Gerald Appel's formula with separation filters
- RSI: J. Welles Wilder's formula with pullback zone logic
- ADX/DMI: Custom trend strength formula inspired by Wilder's directional movement concept, reimplemented with volume weighting and efficiency metrics
- ZLSMA: Zero-lag formula enhanced with Hull MA and momentum prediction
### Custom Implementations
- Trend Strength: Inspired by Wilder's ADX concept but using volume-weighted pressure calculation and efficiency metrics (not traditional +DI/-DI smoothing)
- All code implementations are original
### ORIGINAL FEATURES (70%+ of codebase)
- Multi-Timeframe Bias Table with live updates
- Risk Management System (R-multiple TPs, freeze-on-touch)
- Opening Range Breakout tracker with session management
- Composite Stop Loss calculator using 6+ S/R layers
- Performance optimization system (caching, conditional calcs)
- VIX Fear Index integration
- Previous Day High/Low auto-detection
- Candlestick pattern recognition with interactive tooltips
- Smart label and visual management
- All UI/UX design and table architecture
### DEVELOPMENT PROCESS
**AI Assistance:** This indicator was developed over 2+ months with AI assistance (ChatGPT/Claude) used for:
- Writing Pine Script code based on design specifications
- Optimizing performance and fixing bugs
- Ensuring Pine Script v6 compliance
- Generating documentation
**Author's Role:** All trading concepts, system design, feature selection, integration logic, and strategic decisions are original work by the author. The AI was a coding tool, not the system designer.
**Transparency:** We believe in full disclosure - this project demonstrates how AI can be used as a powerful development tool while maintaining creative and strategic ownership.
---
1. WHY THIS INDICATOR IS DIFFERENT
Most traders use multiple separate indicators on their charts, leading to cluttered screens, conflicting signals, and analysis paralysis. The Suite solves this by integrating proven technical tools into a single, cohesive system.
Key Advantages:
All-in-One Design: Instead of loading 5-10 separate indicators, you get everything in one optimized script. This reduces chart clutter and improves TradingView performance.
Multi-Timeframe Bias Table: Unlike standard indicators that only show the current timeframe, the Bias Table aggregates trend signals across multiple timeframes simultaneously. See at a glance whether 1m, 5m, 15m, 1h are aligned bullish or bearish - no more switching between charts.
Smart Confirmations: The indicator doesn't just give signals - it shows you WHY. Every entry has multiple layers of confirmation (MA cross, MACD momentum, ADX strength, RSI pullback, volume, etc.) that you can toggle on/off.
Dynamic Stop Loss System: Instead of static ATR stops, the SL is calculated from multiple support/resistance layers: UT trailing line, Supertrend, VWAP, swing structure, and MA levels. This creates more intelligent, price-action-aware stops.
R-Multiple Take Profits: Built-in TP system calculates targets based on your initial risk (1R, 1.5R, 2R, 3R). Lines freeze when touched with visual checkmarks, giving you a clean audit trail of partial exits.
Educational Tooltips Everywhere: Every single input has detailed tooltips explaining what it does, typical values, and how it impacts trading. You're not guessing - you're learning as you configure.
Performance Optimized: Smart caching, conditional calculations, and modular design mean the indicator runs fast despite having 15+ features. Turn off what you don't use for even better performance.
No Repainting: All signals respect bar close. Alerts fire correctly. What you see in history is what you would have gotten in real-time.
What Makes It Unique:
Integrated UT Bot + Bias Table: No other indicator combines UT Bot's ATR trailing system with a live multi-timeframe dashboard. You get precision entries with macro trend context.
Candlestick Pattern Recognition with Interactive Tooltips: Patterns aren't just marked - hover over any emoji for a full explanation of what the pattern means and how to trade it.
Opening Range Breakout Tracker: Built-in ORB system for intraday traders with customizable session times and real-time status updates in the Bias Table.
Previous Day High/Low Auto-Detection: Automatically plots PDH/PDL on intraday charts with theme-aware colors. Updates daily without manual input.
Dynamic Row Labels in Bias Table: The table shows your actual settings (e.g., "EMA 10 > SMA 20") not generic labels. You know exactly what's being evaluated.
Modular Filter System: Instead of forcing a fixed methodology, the indicator lets you build your own strategy. Start with just UT Bot, add filters one at a time, test what works for your style.
---
2. WHO WHOULD USE THIS
Designed For:
Intermediate to Advanced Traders: You understand basic technical analysis (MAs, RSI, MACD) and want to combine multiple confirmations efficiently. This isn't a "one-click profit" system - it's a professional toolkit.
Multi-Timeframe Traders: If you trade one asset but check multiple timeframes for confirmation (e.g., enter on 5m after checking 15m and 1h alignment), the Bias Table will save you hours every week.
Trend Followers: The indicator excels at identifying and following trends using UT Bot, Supertrend, and MA systems. If you trade breakouts and pullbacks in trending markets, this is built for you.
Intraday and Swing Traders: Works equally well on 5m-1h charts (day trading) and 4h-D charts (swing trading). Scalpers can use it too with appropriate settings adjustments.
Discretionary Traders: This isn't a black-box system. You see all the components, understand the logic, and make final decisions. Perfect for traders who want tools, not automation.
Works Across All Markets:
Stocks (US, international)
Cryptocurrency (24/7 markets supported)
Forex pairs
Indices (SPY, QQQ, etc.)
Commodities
NOT Ideal For :
Complete Beginners: If you don't know what a moving average or RSI is, start with basics first. This indicator assumes foundational knowledge.
Algo Traders Seeking Black Box: This is discretionary. Signals require context and confirmation. Not suitable for blind automated execution.
Mean-Reversion Only Traders: The indicator is trend-following at its core. While VWAP bands support mean-reversion, the primary methodology is trend continuation.
---
3. CORE COMPONENTS OVERVIEW
The indicator combines these proven systems:
Trend Analysis:
Moving Averages: Four customizable MAs (Fast, Medium, Medium-Long, Long) with six types to choose from (EMA, SMA, WMA, VWMA, RMA, HMA). Mix and match for your style.
Supertrend: ATR-based trend indicator with unique gradient fill showing trend strength. One-sided ribbon visualization makes it easier to see momentum building or fading.
ZLSMA : Zero-lag linear-regression smoothed moving average. Reduces lag compared to traditional MAs while maintaining smooth curves.
Momentum & Filters:
MACD: Standard MACD with separation filter to avoid weak crossovers.
RSI: Pullback zone detection - only enter longs when RSI is in your defined "buy zone" and shorts in "sell zone".
ADX/DMI: Trend strength measurement with directional filter. Ensures you only trade when there's actual momentum.
Volume Filter: Relative volume confirmation - require above-average volume for entries.
Donchian Breakout: Optional channel breakout requirement.
Signal Systems:
UT Bot: The primary signal generator. ATR trailing stop that adapts to volatility and gives clear entry/exit points.
Base Signals: MA cross system with all the above filters applied. More conservative than UT Bot alone.
Market Bias Table: Multi-timeframe dashboard showing trend alignment across 7 timeframes plus macro bias (3-day, weekly, monthly, quarterly, VIX).
Candlestick Patterns: Six major reversal patterns auto-detected with interactive tooltips.
ORB Tracker: Opening range high/low with breakout status (intraday only).
PDH/PDL: Previous day levels plotted automatically on intraday charts.
VWAP + Bands : Session-anchored VWAP with up to three standard deviation band pairs.
---
4. THE UT BOT TRADING SYSTEM
The UT Bot is the heart of the indicator's signal generation. It's an advanced ATR trailing stop that adapts to market volatility.
Why UT Bot is Superior to Fixed Stops:
Traditional ATR stops use a fixed multiplier (e.g., "stop = entry - 2×ATR"). UT Bot is smarter:
It TRAILS the stop as price moves in your favor
It WIDENS during high volatility to avoid premature stops
It TIGHTENS during consolidation to lock in profits
It FLIPS when price breaks the trailing line, signaling reversals
Visual Elements You'll See:
Orange Trailing Line: The actual UT stop level that adapts bar-by-bar
Buy/Sell Labels: Aqua triangle (long) or orange triangle (short) when the line flips
ENTRY Line: Horizontal line at your entry price (optional, can be turned off)
Suggested Stop Loss: A composite SL calculated from multiple support/resistance layers:
- UT trailing line
- Supertrend level
- VWAP
- Swing structure (recent lows/highs)
- Long-term MA (200)
- ATR-based floor
Take Profit Lines: TP1, TP1.5, TP2, TP3 based on R-multiples. When price touches a TP, it's marked with a checkmark and the line freezes for audit trail purposes.
Status Messages: "SL Touched ❌" or "SL Frozen" when the trade leg completes.
How UT Bot Differs from Other ATR Systems:
Multiple Filters Available: You can require 2-bar confirmation, minimum % price change, swing structure alignment, or ZLSMA directional filter. Most UT implementations have none of these.
Smart SL Calculation: Instead of just using the UT line as your stop, the indicator suggests a better SL based on actual support/resistance. This prevents getting stopped out by wicks while keeping risk controlled.
Visual Audit Trail: All SL/TP lines freeze when touched with clear markers. You can review your trades weeks later and see exactly where entries, stops, and targets were.
Performance Options: "Draw UT visuals only on bar close" lets you reduce rendering load without affecting logic or alerts - critical for slower machines or 1m charts.
Trading Logic:
UT Bot flips direction (Buy or Sell signal appears)
Check Bias Table for multi-timeframe confirmation
Optional: Wait for Base signal or candlestick pattern
Enter at signal bar close or next bar open
Place stop at "Suggested Stop Loss" line
Scale out at TP levels (TP1, TP2, TP3)
Exit remaining position on opposite UT signal or stop hit
---
5. UNDERSTANDING THE MARKET BIAS TABLE
This is the indicator's unique multi-timeframe intelligence layer. Instead of looking at one chart at a time, the table aggregates signals across seven timeframes plus macro trend bias.
Why Multi-Timeframe Analysis Matters:
Professional traders check higher and lower timeframes for context:
Is the 1h uptrend aligning with my 5m entry?
Are all short-term timeframes bullish or just one?
Is the daily trend supportive or fighting me?
Doing this manually means opening multiple charts, checking each indicator, and making mental notes. The Bias Table does it automatically in one glance.
Table Structure:
Header Row:
On intraday charts: 1m, 5m, 15m, 30m, 1h, 2h, 4h (toggle which ones you want)
On daily+ charts: D, W, M (automatic)
Green dot next to title = live updating
Headline Rows - Macro Bias:
These show broad market direction over longer periods:
3 Day Bias: Trend over last 3 trading sessions (uses 1h data)
Weekly Bias: Trend over last 5 trading sessions (uses 4h data)
Monthly Bias: Trend over last 30 daily bars
Quarterly Bias: Trend over last 13 weekly bars
VIX Fear Index: Market regime based on VIX level - bullish when low, bearish when high
Opening Range Breakout: Status of price vs. session open range (intraday only)
These rows show text: "BULLISH", "BEARISH", or "NEUTRAL"
Indicator Rows - Technical Signals:
These evaluate your configured indicators across all active timeframes:
Fast MA > Medium MA (shows your actual MA settings, e.g., "EMA 10 > SMA 20")
Price > Long MA (e.g., "Price > SMA 200")
Price > VWAP
MACD > Signal
Supertrend (up/down/neutral)
ZLSMA Rising
RSI In Zone
ADX ≥ Minimum
These rows show emojis: GREEB (bullish), RED (bearish), GRAY/YELLOW (neutral/NA)
AVG Column:
Shows percentage of active timeframes that are bullish for that row. This is the KEY metric:
AVG > 70% = strong multi-timeframe bullish alignment
AVG 40-60% = mixed/choppy, no clear trend
AVG < 30% = strong multi-timeframe bearish alignment
How to Use the Table:
For a long trade:
Check AVG column - want to see > 60% ideally
Check headline bias rows - want to see BULLISH, not BEARISH
Check VIX row - bullish market regime preferred
Check ORB row (intraday) - want ABOVE for longs
Scan indicator rows - more green = better confirmation
For a short trade:
Check AVG column - want to see < 40% ideally
Check headline bias rows - want to see BEARISH, not BULLISH
Check VIX row - bearish market regime preferred
Check ORB row (intraday) - want BELOW for shorts
Scan indicator rows - more red = better confirmation
When AVG is 40-60%:
Market is choppy, mixed signals. Either stay out or reduce position size significantly. These are low-probability environments.
Unique Features:
Dynamic Labels: Row names show your actual settings (e.g., "EMA 10 > SMA 20" not generic "Fast > Slow"). You know exactly what's being evaluated.
Customizable Rows: Turn off rows you don't care about. Only show what matters to your strategy.
Customizable Timeframes: On intraday charts, disable 1m or 4h if you don't trade them. Reduces calculation load by 20-40%.
Automatic HTF Handling: On Daily/Weekly/Monthly charts, the table automatically switches to D/W/M columns. No configuration needed.
Performance Smart: "Hide BIAS table on 1D or above" option completely skips all table calculations on higher timeframes if you only trade intraday.
---
6. CANDLESTICK PATTERN RECOGNITION
The indicator automatically detects six major reversal patterns and marks them with emojis at the relevant bars.
Why These Six Patterns:
These are the most statistically significant reversal patterns according to trading literature:
High win rate when appearing at support/resistance
Clear visual structure (not subjective)
Work across all timeframes and assets
Studied extensively by institutions
The Patterns:
Bullish Patterns (appear at bottoms):
Bullish Engulfing: Green candle completely engulfs prior red candle's body. Strong reversal signal.
Hammer: Small body with long lower wick (at least 2× body size). Shows rejection of lower prices by buyers.
Morning Star: Three-candle pattern (large red → small indecision → large green). Very strong bottom reversal.
Bearish Patterns (appear at tops):
Bearish Engulfing: Red candle completely engulfs prior green candle's body. Strong reversal signal.
Shooting Star: Small body with long upper wick (at least 2× body size). Shows rejection of higher prices by sellers.
Evening Star: Three-candle pattern (large green → small indecision → large red). Very strong top reversal.
Interactive Tooltips:
Unlike most pattern indicators that just draw shapes, this one is educational:
Hover your mouse over any pattern emoji
A tooltip appears explaining: what the pattern is, what it means, when it's most reliable, and how to trade it
No need to memorize - learn as you trade
Noise Filter:
"Min candle body % to filter noise" setting prevents false signals:
Patterns require minimum body size relative to price
Filters out tiny candles that don't represent real buying/selling pressure
Adjust based on asset volatility (higher % for crypto, lower for low-volatility stocks)
How to Trade Patterns:
Patterns are NOT standalone entry signals. Use them as:
Confirmation: UT Bot gives signal + pattern appears = stronger entry
Reversal Warning: In a trade, opposite pattern appears = consider tightening stop or taking profit
Support/Resistance Validation: Pattern at key level (PDH, VWAP, MA 200) = level is being respected
Best combined with:
UT Bot or Base signal in same direction
Bias Table alignment (AVG > 60% or < 40%)
Appearance at obvious support/resistance
---
7. VISUAL TOOLS AND FEATURES
VWAP (Volume Weighted Average Price):
Session-anchored VWAP with standard deviation bands. Shows institutional "fair value" for the trading session.
Anchor Options: Session, Day, Week, Month, Quarter, Year. Choose based on your trading timeframe.
Bands: Up to three pairs (X1, X2, X3) showing statistical deviation. Price at outer bands often reverses.
Auto-Hide on HTF: VWAP hides on Daily/Weekly/Monthly charts automatically unless you enable anchored mode.
Use VWAP as:
Directional bias (above = bullish, below = bearish)
Mean reversion levels (outer bands)
Support/resistance (the VWAP line itself)
Previous Day High/Low:
Automatically plots yesterday's high and low on intraday charts:
Updates at start of each new trading day
Theme-aware colors (dark text for light charts, light text for dark charts)
Hidden automatically on Daily/Weekly/Monthly charts
These levels are critical for intraday traders - institutions watch them closely as support/resistance.
Opening Range Breakout (ORB):
Tracks the high/low of the first 5, 15, 30, or 60 minutes of the trading session:
Customizable session times (preset for NYSE, LSE, TSE, or custom)
Shows current breakout status in Bias Table row (ABOVE, BELOW, INSIDE, BUILDING)
Intraday only - auto-disabled on Daily+ charts
ORB is a classic day trading strategy - breakout above opening range often leads to continuation.
Extra Labels:
Change from Open %: Shows how far price has moved from session open (intraday) or daily open (HTF). Green if positive, red if negative.
ADX Badge: Small label at bottom of last bar showing current ADX value. Green when above your minimum threshold, red when below.
RSI Badge: Small label at top of last bar showing current RSI value with zone status (buy zone, sell zone, or neutral).
These labels provide quick at-a-glance confirmation without needing separate indicator windows.
---
8. HOW TO USE THE INDICATOR
Step 1: Add to Chart
Load the indicator on your chosen asset and timeframe
First time: Everything is enabled by default - the chart will look busy
Don't panic - you'll turn off what you don't need
Step 2: Start Simple
Turn OFF everything except:
UT Bot labels (keep these ON)
Bias Table (keep this ON)
Moving Averages (Fast and Medium only)
Suggested Stop Loss and Take Profits
Hide everything else initially. Get comfortable with the basic UT Bot + Bias Table workflow first.
Step 3: Learn the Core Workflow
UT Bot gives a Buy or Sell signal
Check Bias Table AVG column - do you have multi-timeframe alignment?
If yes, enter the trade
Place stop at Suggested Stop Loss line
Scale out at TP levels
Exit on opposite UT signal
Trade this simple system for a week. Get a feel for signal frequency and win rate with your settings.
Step 4: Add Filters Gradually
If you're getting too many losing signals (whipsaws in choppy markets), add filters one at a time:
Try: "Require 2-Bar Trend Confirmation" - wait for 2 bars to confirm direction
Try: ADX filter with minimum threshold - only trade when trend strength is sufficient
Try: RSI pullback filter - only enter on pullbacks, not chasing
Try: Volume filter - require above-average volume
Add one filter, test for a week, evaluate. Repeat.
Step 5: Enable Advanced Features (Optional)
Once you're profitable with the core system, add:
Supertrend for additional trend confirmation
Candlestick patterns for reversal warnings
VWAP for institutional anchor reference
ORB for intraday breakout context
ZLSMA for low-lag trend following
Step 6: Optimize Settings
Every setting has a detailed tooltip explaining what it does and typical values. Hover over any input to read:
What the parameter controls
How it impacts trading
Suggested ranges for scalping, day trading, and swing trading
Start with defaults, then adjust based on your results and style.
Step 7: Set Up Alerts
Right-click chart → Add Alert → Condition: "Luxy Momentum v6" → Choose:
"UT Bot — Buy" for long entries
"UT Bot — Sell" for short entries
"Base Long/Short" for filtered MA cross signals
Optionally enable "Send real-time alert() on UT flip" in settings for immediate notifications.
Common Workflow Variations:
Conservative Trader:
UT signal + Base signal + Candlestick pattern + Bias AVG > 70%
Enter only at major support/resistance
Wider UT sensitivity, multiple filters
Aggressive Trader:
UT signal + Bias AVG > 60%
Enter immediately, no waiting
Tighter UT sensitivity, minimal filters
Swing Trader:
Focus on Daily/Weekly Bias alignment
Ignore intraday noise
Use ORB and PDH/PDL less (or not at all)
Wider stops, patient approach
---
9. PERFORMANCE AND OPTIMIZATION
The indicator is optimized for speed, but with 15+ features running simultaneously, chart load time can add up. Here's how to keep it fast:
Biggest Performance Gains:
Disable Unused Timeframes: In "Time Frames" settings, turn OFF any timeframe you don't actively trade. Each disabled TF saves 10-15% calculation time. If you only day trade 5m, 15m, 1h, disable 1m, 2h, 4h.
Hide Bias Table on Daily+: If you only trade intraday, enable "Hide BIAS table on 1D or above". This skips ALL table calculations on higher timeframes.
Draw UT Visuals Only on Bar Close: Reduces intrabar rendering of SL/TP/Entry lines. Has ZERO impact on logic or alerts - purely visual optimization.
Additional Optimizations:
Turn off VWAP bands if you don't use them
Disable candlestick patterns if you don't trade them
Turn off Supertrend fill if you find it distracting (keep the line)
Reduce "Limit to 10 bars" for SL/TP lines to minimize line objects
Performance Features Built-In:
Smart Caching: Higher timeframe data (3-day bias, weekly bias, etc.) updates once per day, not every bar
Conditional Calculations: Volume filter only calculates when enabled. Swing filter only runs when enabled. Nothing computes if turned off.
Modular Design: Every component is independent. Turn off what you don't need without breaking other features.
Typical Load Times:
5m chart, all features ON, 7 timeframes: ~2-3 seconds
5m chart, core features only, 3 timeframes: ~1 second
1m chart, all features: ~4-5 seconds (many bars to calculate)
If loading takes longer, you likely have too many indicators on the chart total (not just this one).
---
10. FAQ
Q: How is this different from standard UT Bot indicators?
A: Standard UT Bot (originally by @QuantNomad) is just the ATR trailing line and flip signals. This implementation adds:
- Volume weighting and momentum adjustment to the trailing calculation
- Multiple confirmation filters (swing, %, 2-bar, ZLSMA)
- Smart composite stop loss system from multiple S/R layers
- R-multiple take profit system with freeze-on-touch
- Integration with multi-timeframe Bias Table
- Visual audit trail with checkmarks
Q: Can I use this for automated trading?
A: The indicator is designed for discretionary trading. While it has clear signals and alerts, it's not a mechanical system. Context and judgment are required.
Q: Does it repaint?
A: No. All signals respect bar close. UT Bot logic runs intrabar but signals only trigger on confirmed bars. Alerts fire correctly with no lookahead.
Q: Do I need to use all the features?
A: Absolutely not. The indicator is modular. Many profitable traders use just UT Bot + Bias Table + Moving Averages. Start simple, add complexity only if needed.
Q: How do I know which settings to use?
A: Every single input has a detailed tooltip. Hover over any setting to see:
What it does
How it affects trading
Typical values for scalping, day trading, swing trading
Start with defaults, adjust gradually based on results.
Q: Can I use this on crypto 24/7 markets?
A: Yes. ORB will not work (no defined session), but everything else functions normally. Use "Day" anchor for VWAP instead of "Session".
Q: The Bias Table is blank or not showing.
A: Check:
"Show Table" is ON
Table position isn't overlapping another indicator's table (change position)
At least one row is enabled
"Hide BIAS table on 1D or above" is OFF (if on Daily+ chart)
Q: Why are candlestick patterns not appearing?
A: Patterns are relatively rare by design - they only appear at genuine reversal points. Check:
Pattern toggles are ON
"Min candle body %" isn't too high (try 0.05-0.10)
You're looking at a chart with actual reversals (not strong trending market)
Q: UT Bot is too sensitive/not sensitive enough.
A: Adjust "Sensitivity (Key×ATR)". Lower number = tighter stop, more signals. Higher number = wider stop, fewer signals. Read the tooltip for guidance.
Q: Can I get alerts for the Bias Table?
A: The Bias Table is a dashboard for visual analysis, not a signal generator. Set alerts on UT Bot or Base signals, then manually check Bias Table for confirmation.
Q: Does this work on stocks with low volume?
A: Yes, but turn OFF the volume filter. Low volume stocks will never meet relative volume requirements.
Q: How often should I check the Bias Table?
A: Before every entry. It takes 2 seconds to glance at the AVG column and headline rows. This one check can save you from fighting the trend.
Q: What if UT signal and Base signal disagree?
A: UT Bot is more aggressive (ATR trailing). Base signals are more conservative (MA cross + filters). If they disagree, either:
Wait for both to align (safest)
Take the UT signal but with smaller size (aggressive)
Skip the trade (conservative)
There's no "right" answer - depends on your risk tolerance.
---
FINAL NOTES
The indicator gives you an edge. How you use that edge determines results.
For questions, feedback, or support, comment on the indicator page or message the author.
Happy Trading!

Brownian Motion Probabilistic Forecasting (Time Adaptive)Probabilistic Price Forecast Indicator
Overview
The Probabilistic Price Forecast is an advanced technical analysis tool designed for the TradingView platform. Instead of predicting a single future price, this indicator uses a Monte Carlo simulation to model thousands of potential future price paths, generating a cone of possibilities and calculating the probability of specific outcomes.
This allows traders to move beyond simple price targets and ask more sophisticated questions, such as: "What is the probability that this stock will increase by 5% over the next 24 hours?"
Core Concept: Geometric Brownian Motion
The indicator's forecasting model is built on the principles of Geometric Brownian Motion (GBM) , a widely accepted mathematical model for describing the random movements of financial asset prices. The core idea is that the next price step is a function of the asset's historical trend (drift), its volatility, and a random "shock."
The formula used to project each price step in the simulation is:
next_price = current_price * exp( (μ - (σ²/2))Δt + σZ√(Δt) )
Where:
μ (mu) represents the drift , which is the average historical return.
σ (sigma) represents the volatility , measured by the standard deviation of historical returns.
Z is a random variable from a standard normal distribution, representing the random "shock" or new information affecting the price.
Δt (delta t) is the time step for each projection.
How It Works
The indicator performs a comprehensive analysis on the most recent bar of the chart:
**Historical Analysis**: It first analyzes a user-defined historical period (e.g., the last 240 hours of price data) to calculate the asset's historical drift (μ) and volatility (σ) from its logarithmic returns.
**Monte Carlo Simulation**: It then runs thousands of simulations (e.g., 2000) of future price paths over a specified forecast period (e.g., the next 24 hours). Each path is unique due to the random shock (Z) applied at every step.
**Probability Distribution**: After all simulations are complete, it collects the final price of each path and sorts them to build a probability distribution of potential outcomes.
**Visualization and Signaling**: Finally, it visualizes this distribution on the chart and generates signals based on the user's criteria.
Key Features & Configuration
The indicator is highly configurable, allowing you to tailor its analysis to your specific needs.
Time-Adaptive Periods
The lookback and forecast periods are defined in hours , not bars. The script automatically converts these hour-based inputs into the correct number of bars based on the chart's current timeframe, ensuring the analysis remains consistent across different chart resolutions.
Forecast Quartiles
You can visualize the forecast as a "cone of probability" on the chart. The indicator draws lines and a shaded area representing the price levels for different quartiles (percentiles) of the simulation results. By default, this shows the range between the 25th and 95th percentiles.
Independent Bullish and Bearish Signals
The indicator allows you to set independent criteria for bullish and bearish signals, providing greater flexibility. You can configure:
A bullish signal for an X% confidence of a Y% price increase.
A bearish signal for a W% confidence of a Z% price decrease.
For example, you can set it to alert you for a 90% chance of a 2% drop, while simultaneously looking for a 60% chance of a 10% rally.
How to Interpret the Indicator
The Forecast Cone : The blue shaded area on the chart represents the probable range of future prices. The width of the cone indicates the expected volatility; a wider cone means higher uncertainty. The price labels on the right side of the cone show the calculated percentile levels at the end of the forecast period.
Green Signal Label : A green "UP signal" label appears when the probability of the price increasing by your target percentage exceeds your defined confidence level.
Red Signal Label : A red "DOWN signal" label appears when the probability of the price decreasing by your target percentage exceeds your confidence level.
This tool provides a statistical edge for understanding future possibilities but should be used in conjunction with other analysis techniques.

自定义均线(多色 & 分级线宽)Title: Multi-Color Moving Average Suite (MA5…MA4320) — Pine v6
Summary (1–2 lines):
An overlay indicator that plots a full ladder of SMA lines from MA5 up to MA4320. Each MA has a unique color, and line width scales with period (short = thin, mid = medium, long = thick) to make trend structure easy to read at a glance.
What it does
• Plots 16 simple moving averages: 5, 10, 20, 30, 60, 120, 160, 240, 480, 720, 960, 1440, 1750, 2880, 4320.
• Distinct colors for every MA to avoid confusion when lines cluster.
• Period-based thickness:
• Short-term (<60) = thin,
• Mid-term (60–160) = medium,
• Long-term (≥240) = thick (capped; no unlimited growth).
• Designed for quick trend reading across intraday to multi-year cycles (especially useful for 24/7 markets like crypto).
How to use
1. Add the indicator to any chart (works on all symbols/timeframes).
2. Use the thin/medium/thick visual hierarchy to identify short-/mid-/long-term bias and crossovers.
3. On very low timeframes, consider hiding some ultra-long MAs if your chart has insufficient history.
Notes
• Built with Pine Script v6; uses ta.sma(close, length) only (no repainting).
• Very long MAs (e.g., 2880/4320) require enough bars; they will display na until sufficient history loads.
• No inputs/alerts by default—kept intentionally simple for clarity. (Easy to extend with toggles, custom colors, EMA/WMA options, alerts, etc.)
Credits
Author: TraderFinsher (customized multi-MA visualization with color and thickness hierarchy).
⸻
标题: 多色均线系统(MA5…MA4320)— Pine v6
摘要(1–2 句):
这是一个叠加在价格上的 SMA 均线组,从 MA5 到 MA4320。为每条均线设置了 独立颜色,并按 周期长度分级线宽(短=细、中=中等、长=较粗),让趋势结构一眼可读。
功能说明
• 绘制 16 条简单移动平均线:5、10、20、30、60、120、160、240、480、720、960、1440、1750、2880、4320。
• 全部不同颜色,避免密集时混淆。
• 线宽随周期分级:
• 短期(<60)= 细,
• 中期(60–160)= 中等,
• 长期(≥240)= 粗(封顶,不再无限加粗)。
• 适合从日内到多年周期的 趋势快速判读(对加密等 24/7 市场尤为友好)。
使用建议
1. 将指标添加到任意品种/周期。
2. 结合细/中/粗的视觉层级,判断短/中/长趋势与均线交叉。
3. 在较低周期下,如果历史数据不足,可隐藏部分超长均线。
注意事项
• 使用 Pine v6,仅调用 ta.sma(close, length),不重绘。
• 超长均线需要足够历史数据,未满足前会显示 na。
• 默认不含参数和告警,追求简洁清晰(后续可扩展开关、自定义颜色/线宽、EMA/WMA 选项与告警等)。
致谢
作者:TraderFinsher(基于颜色与线宽层级的多均线可视化)。

Daily Midnight Lines# Daily Midnight Lines
A simple and efficient TradingView indicator that automatically draws vertical lines at the start of each new day.
* *
## Features
✅ **Precise Timing**: Draws lines at exactly 00:00 or on the first bar of the new day
✅ **Calendar Days**: Uses calendar days, not trading sessions
✅ **Customizable Design**: Green color with transparency for comfortable viewing
✅ **High Performance**: Optimized code without unnecessary calculations
✅ **Universal**: Works on all timeframes and instruments
## Settings
- **Line Color**: Green with 30% transparency (customizable)
- **Line Width**: 1 pixel (1 to 3)
- **Mode**: Exactly at 00:00 or first bar of new day
## Applications
- Separating trading days on the chart
- Analyzing price behavior at the start of the day
- Planning trading strategies
- Statistical analysis by days
## Compatibility
- Pine Script v6
- All timeframes (1m - 1M)
- All instruments (stocks, forex, crypto, futures)
- All markets (24/7, daily, night sessions)
Perfect for day traders, scalpers, and analysts who want better chart orientation and intraday pattern analysis.
---
## Ежедневные Полночные Линии
Простой и эффективный индикатор TradingView, который автоматически рисует вертикальные линии в начале каждого нового дня.
## Особенности
✅ **Точное время**: Рисует линии в 00:00 или на первом баре нового дня
✅ **Календарные дни**: Использует календарные дни, а не торговые сессии
✅ **Настраиваемый дизайн**: Зеленый цвет с прозрачностью для комфортного просмотра
✅ **Высокая производительность**: Оптимизированный код без лишних вычислений
✅ **Универсальность**: Работает на всех таймфреймах и инструментах
## Настройки
- **Цвет линий**: Зеленый с прозрачностью 30% (настраивается)
- **Толщина линий**: 1 пиксель (от 1 до 3)
- **Режим**: Точно в 00:00 или первый бар нового дня
## Применение
- Разделение торговых дней на графике
- Анализ поведения цены в начале дня
- Планирование торговых стратегий
- Статистический анализ по дням
## Совместимость
- Pine Script v6
- Все таймфреймы (1м - 1М)
- Все инструменты (акции, форекс, крипто, фьючерсы)
- Все рынки (24/7, дневные, ночные сессии)
Идеально подходит для дневных трейдеров, скальперов и аналитиков, которые хотят лучше ориентироваться на графике и анализировать внутридневные паттерны.
**Pine Script v6** | **Updated: October 2024** | **Обновлено: Октябрь 2024**

EvoTrend-X Indicator — Evolutionary Trend Learner ExperimentalEvoTrend-X Indicator — Evolutionary Trend Learner
NOTE: This is an experimental Pine Script v6 port of a Python prototype. Pine wasn’t the original research language, so there may be small quirks—your feedback and bug reports are very welcome. The model is non-repainting, MTF-safe (lookahead_off + gaps_on), and features an adaptive (fitness-based) candidate selector, confidence gating, and a volatility filter.
⸻
What it is
EvoTrend-X is adaptive trend indicator that learns which moving-average length best fits the current market. It maintains a small “population” of fast EMA candidates, rewards those that align with price momentum, and continuously selects the best performer. Signals are gated by a multi-factor Confidence score (fitness, strength vs. ATR, MTF agreement) and a volatility filter (ATR%). You get a clean Fast/Slow pair (for the currently best candidate), optional HTF filter, a fitness ribbon for transparency, and a themed info panel with a one-glance STATUS readout.
Core outputs
• Selected Fast/Slow EMAs (auto-chosen from candidates via fitness learning)
• Spread cross (Fast – Slow) → visual BUY/SELL markers + alert hooks
• Confidence % (0–100): Fitness ⊕ Distance vs. ATR ⊕ MTF agreement
• Gates: Trend regime (Kaufman ER), Volatility (ATR%), MTF filter (optional)
• Candidate Fitness Ribbon: shows which lengths the learner currently prefers
• Export plot: hidden series “EvoTrend-X Export (spread)” for downstream use
⸻
Why it’s different
• Evolutionary learning (on-chart): Each candidate EMA length gets rewarded if its slope matches price change and penalized otherwise, with a gentle decay so the model forgets stale regimes. The best fitness wins the right to define the displayed Fast/Slow pair.
• Confidence gate: Signals don’t light up unless multiple conditions concur: learned fitness, spread strength vs. volatility, and (optionally) higher-timeframe trend.
• Volatility awareness: ATR% filter blocks low-energy environments that cause death-by-a-thousand-whipsaws. Your “why no signal?” answer is always visible in the STATUS.
• Preset discipline, Custom freedom: Presets set reasonable baselines for FX, equities, and crypto; Custom exposes all knobs and honors your inputs one-to-one.
• Non-repainting rigor: All MTF calls use lookahead_off + gaps_on. Decisions use confirmed bars. No forward refs. No conditional ta.* pitfalls.
⸻
Presets (and what they do)
• FX 1H (Conservative): Medium candidates, slightly higher MinConf, modest ATR% floor. Good for macro sessions and cleaner swings.
• FX 15m (Active): Shorter candidates, looser MinConf, higher ATR% floor. Designed for intraday velocity and decisive sessions.
• Equities 1D: Longer candidates, gentler volatility floor. Suits index/large-cap trend waves.
• Crypto 1H: Mid-short candidates, higher ATR% floor for 24/7 chop, stronger MinConf to avoid noise.
• Custom: Your inputs are used directly (no override). Ideal for systematic tuning or bespoke assets.
⸻
How the learning works (at a glance)
1. Candidates: A small set of fast EMA lengths (e.g., 8/12/16/20/26/34). Slow = Fast × multiplier (default ×2.0).
2. Reward/decay: If price change and the candidate’s Fast slope agree (both up or both down), its fitness increases; otherwise decreases. A decay constant slowly forgets the distant past.
3. Selection: The candidate with highest fitness defines the displayed Fast/Slow pair.
4. Signal engine: Crosses of the spread (Fast − Slow) across zero mark potential regime shifts. A Confidence score and gates decide whether to surface them.
⸻
Controls & what they mean
Learning / Regime
• Slow length = Fast ×: scales the Slow EMA relative to each Fast candidate. Larger multiplier = smoother regime detection, fewer whipsaws.
• ER length / threshold: Kaufman Efficiency Ratio; above threshold = “Trending” background.
• Learning step, Decay: Larger step reacts faster to new behavior; decay sets how quickly the past is forgotten.
Confidence / Volatility gate
• Min Confidence (%): Minimum score to show signals (and fire alerts). Raising it filters noise; lowering it increases frequency.
• ATR length: The ATR window for both the ATR% filter and strength normalization. Shorter = faster, but choppier.
• Min ATR% (percent): ATR as a percentage of price. If ATR% < Min ATR% → status shows BLOCK: low vola.
MTF Trend Filter
• Use HTF filter / Timeframe / Fast & Slow: HTF Fast>Slow for longs, Fast threshold; exit when spread flips or Confidence decays below your comfort zone.
2) FX index/majors, 15m (active intraday)
• Preset: FX 15m (Active).
• Gate: MinConf 60–70; Min ATR% 0.15–0.30.
• Flow: Focus on session opens (LDN/NY). The ribbon should heat up on shorter candidates before valid crosses appear—good early warning.
3) SPY / Index futures, 1D (positioning)
• Preset: Equities 1D.
• Gate: MinConf 55–65; Min ATR% 0.05–0.12.
• Flow: Use spread crosses as regime flags; add timing from price structure. For adds, wait for ER to remain trending across several bars.
4) BTCUSD, 1H (24/7)
• Preset: Crypto 1H.
• Gate: MinConf 70–80; Min ATR% 0.20–0.35.
• Flow: Crypto chops—volatility filter is your friend. When ribbon and HTF OK agree, favor continuation entries; otherwise stand down.
⸻
Reading the Info Panel (and fixing “no signals”)
The panel is your self-diagnostic:
• HTF OK? False means the higher-timeframe EMAs disagree with your intended side.
• Regime: If “Chop”, ER < threshold. Consider raising the threshold or waiting.
• Confidence: Heat-colored; if below MinConf, the gate blocks signals.
• ATR% vs. Min ATR%: If ATR% < Min ATR%, status shows BLOCK: low vola.
• STATUS (composite):
• BLOCK: low vola → increase Min ATR% down (i.e., allow lower vol) or wait for expansion.
• BLOCK: HTF filter → disable HTF or align with the HTF tide.
• BLOCK: confidence → lower MinConf slightly or wait for stronger alignment.
• OK → you’ll see markers on valid crosses.
⸻
Alerts
Two static alert hooks:
• BUY cross — spread crosses up and all gates (ER, Vol, MTF, Confidence) are open.
• SELL cross — mirror of the above.
Create them once from “Add Alert” → choose the condition by name.
⸻
Exporting to other scripts
In your other Pine indicators/strategies, add an input.source and select EvoTrend-X → “EvoTrend-X Export (spread)”. Common uses:
• Build a rule: only trade when exported spread > 0 (trend filter).
• Combine with your oscillator: oscillator oversold and spread > 0 → buy bias.
⸻
Best practices
• Let it learn: Keep Learning step moderate (0.4–0.6) and Decay close to 1.0 (e.g., 0.99–0.997) for smooth regime memory.
• Respect volatility: Tune Min ATR% by asset and timeframe. FX 1H ≈ 0.10–0.20; crypto 1H ≈ 0.20–0.35; equities 1D ≈ 0.05–0.12.
• MTF discipline: HTF filter removes lots of “almost” trades. If you prefer aggressive entries, turn it off and rely more on Confidence.
• Confidence as throttle:
• 40–60%: exploratory; expect more signals.
• 60–75%: balanced; good daily driver.
• 75–90%: selective; catch the clean stuff.
• 90–100%: only A-setups; patient mode.
• Watch the ribbon: When shorter candidates heat up before a cross, momentum is forming. If long candidates dominate, you’re in a slower trend cycle.
⸻
Non-repainting & safety notes
• All request.security() calls use lookahead=barmerge.lookahead_off, gaps=barmerge.gaps_on.
• No forward references; decisions rely on confirmed bar data.
• EMA lengths are simple ints (no series-length errors).
• Confidence components are computed every bar (no conditional ta.* traps).
⸻
Limitations & tips
• Chop happens: ER helps, but sideways microstructure can still flicker—use Confidence + Vol filter as brakes.
• Presets ≠ oracle: They’re sensible baselines; always tune MinConf and Min ATR% to your venue and session.
• Theme “Auto”: Pine cannot read chart theme; “Auto” defaults to a Dark-friendly palette.
⸻
Publisher’s Screenshots Checklist
1) FX swing — EURUSD 1H
• Preset: FX 1H (Conservative)
• Params: MinConf=70, ATR Len=14, Min ATR%=0.12, MTF ON (TF=4H, 20/50)
• Show: Clear BUY cross, STATUS=OK, green regime background; Fitness Ribbon visible.
2) FX intraday — GBPUSD 15m
• Preset: FX 15m (Active)
• Params: MinConf=60, ATR Len=14, Min ATR%=0.20, MTF ON (TF=60m)
• Show: SELL cross near London session open. HTF lines enabled (translucent).
• Caption: “GBPUSD 15m • Active session sell with MTF alignment.”
3) Indices — SPY 1D
• Preset: Equities 1D
• Params: MinConf=60, ATR Len=14, Min ATR%=0.08, MTF ON (TF=1W, 20/50)
• Show: Longer trend run after BUY cross; regime shading shows persistence.
• Caption: “SPY 1D • Trend run after BUY cross; weekly filter aligned.”
4) Crypto — BINANCE:BTCUSDT 1H
• Preset: Crypto 1H
• Params: MinConf=75, ATR Len=14, Min ATR%=0.25, MTF ON (TF=4H)
• Show: BUY cross + quick follow-through; Ribbon warming (reds/yellows → greens).
• Caption: “BTCUSDT 1H • Momentum break with high confidence and ribbon turning.”

Stop Loss vs Take Profit Probability and EVThis stop loss and take profit calculator uses a Monte Carlo simulation to calculate the probability of hitting your Stop Loss or Take Profit levels across different time horizons (expressed in bars).
It provides data-driven insights to optimize your risk management and position sizing by showing Expected Value for each scenario.
As a quant, I love using statistical data to help my decisions and get better EV from my trades.
🔬 How It's Calculated
Monte Carlo Simulation: Runs 1,000-10,000 price simulations using a random walk model
Volatility Analysis: Combines ATR-based and Historical Volatility for accurate price movement modeling
Expected Value: Calculates profit/loss expectation using formula: (TP_Probability × Reward) - (SL_Probability × Risk)
Time Horizons: Tests multiple timeframes (1, 5, 10, 20, 50 bars) to find optimal holding periods
Risk/Reward Ratios: Automatically calculates and displays R:R ratios for quick assessment
💡 Use Cases
Position Sizing - Determine optimal risk per trade based on Expected Value
Time Horizon Optimization - Find the best holding period for your strategy
Stop Loss Placement - Validate SL levels using probability analysis
Take Profit Optimization - Set TP levels with statistical backing
Strategy Backtesting - Compare different R:R setups before entering trades
Risk Management - Avoid trades with negative Expected Value
Swing vs Day Trading - Choose timeframes with highest success probability
🎯 How to Use
Setup Trade: Enter your entry price, stop loss, and take profit levels
You can add or remove time horizons denominated in bars. Say you are looking at 1h candles, adding a 24-bar time horizon means you are looking into 24 hours
Choose Direction: Select Long or Short position
Review Table
Analyze Expected Value: Focus on positive EV scenarios (green background)
Optimize Timing: Select time horizons with best risk/reward profile
Adjust Parameters: Modify volatility calculation method and simulation count if needed
Examples
Here's how you can read the tables.
Example 1:
In this chart, we are analyzing the TP and SL probabilities as well as the EV (expected value) for a stock. I want to check what the likelihood is that my SL and TP get triggered over the next 5 days. The stock market is open for 6.5 hours per day, which is 13 bars in this 30-minute bar chart. 26 bars is 2 days, 39 bars is 3 days and so on.
Although this trade is more likely to trigger my SL than my TP, in some of the time horizons we have a positive expected value because of the risk/reward of our trade (i.e. distance of the SL and TP from the price) and the probability of hitting SL and TP.
Example 2:
In this example, we have applied the indicator to gold. Because the TP is much closer to the price, the probability of hitting the TP is much higher.
We can also observe that the expected Value in the shorter time frames is better than in the longer ones. This can give us some clues to set up our trade. If we know that the EV is positive, we can allocate more to that specific trade.
Enjoy, and please let me know your feedback! 😊🥂

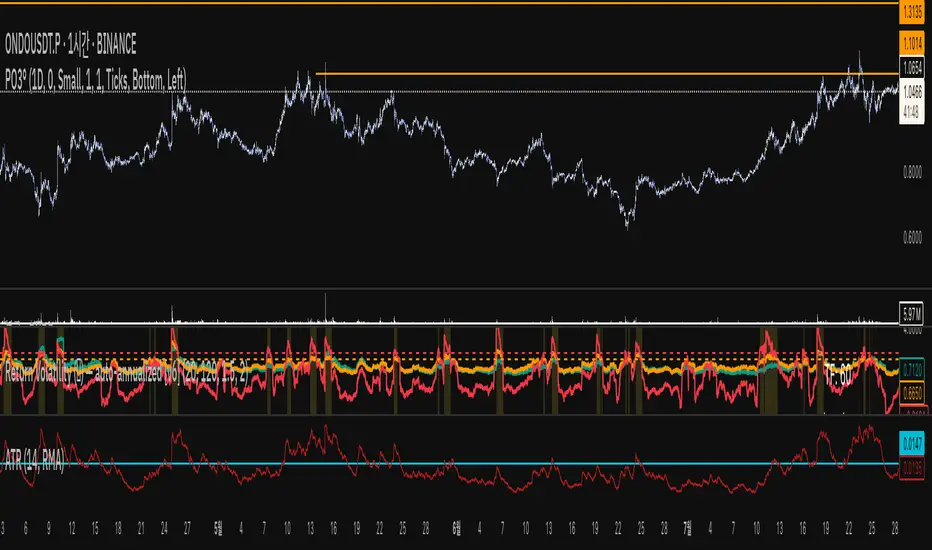
Return Volatility (σ) — auto-annualized [v6]Overview
This indicator calculates and visualizes the return-based volatility (standard deviation) of any asset, automatically adjusting for your chart's timeframe to provide both absolute and annualized volatility values.
It’s designed for traders who want to filter trades, adjust position sizing, and detect volatility events based on statistically significant changes in market activity.
Key Features
Absolute Volatility (abs σ%) – Standard deviation of returns for the current timeframe (e.g., 1H, 4H, 1D).
Annualized Volatility (ann σ%) – Converts abs σ% into an annualized figure for easier cross-timeframe and cross-asset comparison.
Relative Volatility (rel σ) – Ratio of current volatility to the long-term average (default: 120 periods).
Z-Score – Number of standard deviations the current volatility is above or below its historical average.
Auto-Timeframe Adjustment – Detects your chart’s bar size (seconds per bar) and calculates bars/year automatically for crypto’s 24/7 market.
Highlight Mode – Optional yellow background when volatility exceeds set thresholds (rel σ ≥ threshold OR z-score ≥ threshold).
Alert Conditions – Alerts trigger when relative volatility or z-score exceed defined limits.
How It Works
Return Calculation
Log returns: ln(Pt / Pt-1) (default)
or Simple returns: (Pt / Pt-1) – 1
Volatility Measurement
Standard deviation of returns over the lookback period N (default: 20 bars).
Absolute volatility = σ × 100 (% per bar).
Annualization
Uses: σₐₙₙ = σ × √(bars/year) × 100 (%)
Bars/year auto-calculated based on timeframe:
1H = 8,760 bars/year
4H ≈ 2,190 bars/year
1D = 365 bars/year
Relative and Statistical Context
Relative σ = Current σ / Historical average σ (baseLen, default: 120)
Z-score = (Current σ – Historical average σ) / Std. dev. of σ over baseLen
Trading Applications
Volatility Filter – Only allow trade entries when volatility exceeds historical norms (trend traders often benefit from this).
Risk Management – Reduce position size during high volatility spikes to manage risk; increase size in low-volatility trending environments.
Market Scanning – Identify assets with the highest relative volatility for momentum or breakout strategies.
Event Detection – Highlight significant volatility surges that may precede large moves.
Suggested Settings
Lookback (N): 20 bars for short/medium-term trading.
Base Length (M): 120 bars to establish long-term volatility baseline.
Relative Threshold: 1.5× baseline σ.
Z-score Threshold: ≥ 2.0 for statistically significant volatility shifts.
Use Log Returns: Recommended for more consistent scaling across prices.
Notes & Limitations
Volatility measures movement magnitude, not direction. Combine with trend or momentum filters for directional bias.
Very low volatility may still produce false breakouts; combine with volume and market structure analysis.
Crypto markets trade 24/7 — annualization assumes no market closures; adjust for other asset classes if needed.
💡 Best Practice: Use this indicator as a pre-trade filter for breakout or trend-following strategies, or as a risk control overlay in mean-reversion systems.
FEDFUNDS Rate Divergence Oscillator [BackQuant]FEDFUNDS Rate Divergence Oscillator
1. Concept and Rationale
The United States Federal Funds Rate is the anchor around which global dollar liquidity and risk-free yield expectations revolve. When the Fed hikes, borrowing costs rise, liquidity tightens and most risk assets encounter head-winds. When it cuts, liquidity expands, speculative appetite often recovers. Bitcoin, a 24-hour permissionless asset sometimes described as “digital gold with venture-capital-like convexity,” is particularly sensitive to macro-liquidity swings.
The FED Divergence Oscillator quantifies the behavioural gap between short-term monetary policy (proxied by the effective Fed Funds Rate) and Bitcoin’s own percentage price change. By converting each series into identical rate-of-change units, subtracting them, then optionally smoothing the result, the script produces a single bounded-yet-dynamic line that tells you, at a glance, whether Bitcoin is outperforming or underperforming the policy backdrop—and by how much.
2. Data Pipeline
• Fed Funds Rate – Pulled directly from the FRED database via the ticker “FRED:FEDFUNDS,” sampled at daily frequency to synchronise with crypto closes.
• Bitcoin Price – By default the script forces a daily timeframe so that both series share time alignment, although you can disable that and plot the oscillator on intraday charts if you prefer.
• User Source Flexibility – The BTC series is not hard-wired; you can select any exchange-specific symbol or even swap BTC for another crypto or risk asset whose interaction with the Fed rate you wish to study.
3. Math under the Hood
(1) Rate of Change (ROC) – Both the Fed rate and BTC close are converted to percent return over a user-chosen lookback (default 30 bars). This means a cut from 5.25 percent to 5.00 percent feeds in as –4.76 percent, while a climb from 25 000 to 30 000 USD in BTC over the same window converts to +20 percent.
(2) Divergence Construction – The script subtracts the Fed ROC from the BTC ROC. Positive values show BTC appreciating faster than policy is tightening (or falling slower than the rate is cutting); negative values show the opposite.
(3) Optional Smoothing – Macro series are noisy. Toggle “Apply Smoothing” to calm the line with your preferred moving-average flavour: SMA, EMA, DEMA, TEMA, RMA, WMA or Hull. The default EMA-25 removes day-to-day whips while keeping turning points alive.
(4) Dynamic Colour Mapping – Rather than using a single hue, the oscillator line employs a gradient where deep greens represent strong bullish divergence and dark reds flag sharp bearish divergence. This heat-map approach lets you gauge intensity without squinting at numbers.
(5) Threshold Grid – Five horizontal guides create a structured regime map:
• Lower Extreme (–50 pct) and Upper Extreme (+50 pct) identify panic capitulations and euphoria blow-offs.
• Oversold (–20 pct) and Overbought (+20 pct) act as early warning alarms.
• Zero Line demarcates neutral alignment.
4. Chart Furniture and User Interface
• Oscillator fill with a secondary DEMA-30 “shader” offers depth perception: fat ribbons often precede high-volatility macro shifts.
• Optional bar-colouring paints candles green when the oscillator is above zero and red below, handy for visual correlation.
• Background tints when the line breaches extreme zones, making macro inflection weeks pop out in the replay bar.
• Everything—line width, thresholds, colours—can be customised so the indicator blends into any template.
5. Interpretation Guide
Macro Liquidity Pulse
• When the oscillator spends weeks above +20 while the Fed is still raising rates, Bitcoin is signalling liquidity tolerance or an anticipatory pivot view. That condition often marks the embryonic phase of major bull cycles (e.g., March 2020 rebound).
• Sustained prints below –20 while the Fed is already dovish indicate risk aversion or idiosyncratic crypto stress—think exchange scandals or broad flight to safety.
Regime Transition Signals
• Bullish cross through zero after a long sub-zero stint shows Bitcoin regaining upward escape velocity versus policy.
• Bearish cross under zero during a hiking cycle tells you monetary tightening has finally started to bite.
Momentum Exhaustion and Mean-Reversion
• Touches of +50 (or –50) come rarely; they are statistically stretched events. Fade strategies either taking profits or hedging have historically enjoyed positive expectancy.
• Inside-bar candlestick patterns or lower-timeframe bearish engulfings simultaneously with an extreme overbought print make high-probability short scalp setups, especially near weekly resistance. The same logic mirrors for oversold.
Pair Trading / Relative Value
• Combine the oscillator with spreads like BTC versus Nasdaq 100. When both the FED Divergence oscillator and the BTC–NDQ relative-strength line roll south together, the cross-asset confirmation amplifies conviction in a mean-reversion short.
• Swap BTC for miners, altcoins or high-beta equities to test who is the divergence leader.
Event-Driven Tactics
• FOMC days: plot the oscillator on an hourly chart (disable ‘Force Daily TF’). Watch for micro-structural spikes that resolve in the first hour after the statement; rapid flips across zero can front-run post-FOMC swings.
• CPI and NFP prints: extremes reached into the release often mean positioning is one-sided. A reversion toward neutral in the first 24 hours is common.
6. Alerts Suite
Pre-bundled conditions let you automate workflows:
• Bullish / Bearish zero crosses – queue spot or futures entries.
• Standard OB / OS – notify for first contact with actionable zones.
• Extreme OB / OS – prime time to review hedges, take profits or build contrarian swing positions.
7. Parameter Playground
• Shorten ROC Lookback to 14 for tactical traders; lengthen to 90 for macro investors.
• Raise extreme thresholds (for example ±80) when plotting on altcoins that exhibit higher volatility than BTC.
• Try HMA smoothing for responsive yet smooth curves on intraday charts.
• Colour-blind users can easily swap bull and bear palette selections for preferred contrasts.
8. Limitations and Best Practices
• The Fed Funds series is step-wise; it only changes on meeting days. Rapid BTC oscillations in between may dominate the calculation. Keep that perspective when interpreting very high-frequency signals.
• Divergence does not equal causation. Crypto-native catalysts (ETF approvals, hack headlines) can overwhelm macro links temporarily.
• Use in conjunction with classical confirmation tools—order-flow footprints, market-profile ledges, or simple price action to avoid “pure-indicator” traps.
9. Final Thoughts
The FEDFUNDS Rate Divergence Oscillator distills an entire macro narrative monetary policy versus risk sentiment into a single colourful heartbeat. It will not magically predict every pivot, yet it excels at framing market context, spotting stretches and timing regime changes. Treat it as a strategic compass rather than a tactical sniper scope, combine it with sound risk management and multi-factor confirmation, and you will possess a robust edge anchored in the world’s most influential interest-rate benchmark.
Trade consciously, stay adaptive, and let the policy-price tension guide your roadmap.

Time Range Marker By BCB ElevateThe Time Range Marker is a simple yet powerful visual tool for traders who want to focus on specific time intervals within the trading day. This indicator highlights a custom time range on your chart using a background color, helping you visually isolate key trading sessions or event windows such as:
Market open/close hours
News release periods
High-volatility trading zones
Personal strategy testing windows
⚙️ Key Features:
Customizable start and end time (hour & minute)
Works across all intraday timeframes
Adjustable highlight color to match your chart theme
Built using Pine Script v5 for speed and flexibility
🔧 Settings:
Start Hour / Minute – Set the beginning of the time range (in 24-hour format)
End Hour / Minute – Define when the range ends
Highlight Color – Choose the background color for better visibility
🕒 Timezone Note:
The indicator uses UTC time by default to ensure accuracy across markets. If your broker uses a different timezone (like EST, IST, etc.), the script can be adjusted to reflect your local market hours.
✅ How to Use the Time Range Marker Indicator
This indicator is used to visually highlight a specific time window each trading day, such as:
Market open or close sessions (e.g., NYSE, London, Tokyo)
High-impact news release periods
Custom time slots for strategy testing or scalping
🛠️ Installation Steps
Open TradingView and go to any chart.
Click on Pine Editor at the bottom of the screen.
Copy and paste the full Pine Script (shared above) into the editor.
Click the “Add to Chart” ▶️ button.
The indicator will appear on the chart with a highlighted background during the time range you set.
⚙️ How to Customize the Time Range
After adding the indicator:
Click the gear icon ⚙️ next to the indicator’s name on the chart.
Adjust the following settings:
Start Hour / Start Minute: The beginning of your time range (in 24-hour format).
End Hour / End Minute: When the highlight should stop.
Highlight Color: Pick a color and transparency for visual clarity.
Click OK to apply changes.
🕒 Timezone Consideration
By default, the indicator uses UTC (Coordinated Universal Time).
To match your broker’s timezone (e.g., EST, IST, etc.), you'll need to adjust the script by changing:
sessStart = timestamp("Etc/UTC", ...)
sessEnd = timestamp("Etc/UTC", ...)
to your correct timezone, like "Asia/Kolkata" for IST or "America/New_York" for EST.
Let me know your broker or local timezone, and I’ll update it for you.
📈 Tips for Traders
Combine this with volume, price action, or breakout indicators to focus your strategy on high-probability time windows.
Use multiple versions of this script if you want to highlight more than one time range in a day.

Crypto Narratives: Relative Strength V2Simple Indicator that displays the relative strength of 8 Key narratives against BTC as "Spaghetti" chart. The chart plots an aggregated RSI value for the 5 highest Market Cap cryopto's within each relevant narrative. The chart plots a 14 period SMA RSI for each narrative.
Functionality:
The indicator calculates the average RSI values for the current leading tokens associated with ten different crypto narratives:
- AI (Artificial Intelligence)
- DeFi (Decentralized Finance)
- Memes
- Gaming
- Level 1 (Layer 1 Protocols)
- AI Agents
- Storage/DePin
- RWA (Real-World Assets)
- BTC
Usage Notes:
The 5 crypto coins should be regularly checked and updated (in the script) by overtyping the current values from Rows 24 - 92 to ensure that you are using the up to date list of highest marketcap coins (or coins of your choosing).
The 14 period SMA can be changed in the indicator settings.
The indicator resets every 24 hours and is set to UTC+10. This can be changed by editing the script line 19 and changing the value of "resetHour = 1" to whatever value works for your timezone.
There is also a Rate of Change table that details the % rate of change of each narrative against BTC
Horizontal lines have been included to provide an indication of overbought and oversold levels.
The upper and lower horizontal line (overbought and oversold) can be adjusted through the settings.
The line width, and label offset can be customised through the input options.
Alerts can be set to triggered when a narrative's RSI crosses above the overbought level or below the oversold level. The alerts include the narrative name, RSI value, and the RSI level.

Frahm Factor Position Size CalculatorThe Frahm Factor Position Size Calculator is a powerful evolution of the original Frahm Factor script, leveraging its volatility analysis to dynamically adjust trading risk. This Pine Script for TradingView uses the Frahm Factor’s volatility score (1-10) to set risk percentages (1.75% to 5%) for both Margin-Based and Equity-Based position sizing. A compact table on the main chart displays Risk per Trade, Frahm Factor, and Average Candle Size, making it an essential tool for traders aligning risk with market conditions.
Calculates a volatility score (1-10) using true range percentile rank over a customizable look-back window (default 24 hours).
Dynamically sets risk percentage based on volatility:
Low volatility (score ≤ 3): 5% risk for bolder trades.
High volatility (score ≥ 8): 1.75% risk for caution.
Medium volatility (score 4-7): Smoothly interpolated (e.g., 4 → 4.3%, 5 → 3.6%).
Adjustable sensitivity via Frahm Scale Multiplier (default 9) for tailored volatility response.
Position Sizing:
Margin-Based: Risk as a percentage of total margin (e.g., $175 for 1.75% of $10,000 at high volatility).
Equity-Based: Risk as a percentage of (equity - minimum balance) (e.g., $175 for 1.75% of ($15,000 - $5,000)).
Compact 1-3 row table shows:
Risk per Trade with Frahm score (e.g., “$175.00 (Frahm: 8)”).
Frahm Factor (e.g., “Frahm Factor: 8”).
Average Candle Size (e.g., “Avg Candle: 50 t”).
Toggles to show/hide Frahm Factor and Average Candle Size rows, with no empty backgrounds.
Four sizes: XL (18x7, large text), L (13x6, normal), M (9x5, small, default), S (8x4, tiny).
Repositionable (9 positions, default: top-right).
Customizable cell color, text color, and transparency.
Set Frahm Factor:
Frahm Window (hrs): Pick how far back to measure volatility (e.g., 24 hours). Shorter for fast markets, longer for chill ones.
Frahm Scale Multiplier: Set sensitivity (1-10, default 9). Higher makes the score jumpier; lower smooths it out.
Set Margin-Based:
Total Margin: Enter your account balance (e.g., $10,000). Risk auto-adjusts via Frahm Factor.
Set Equity-Based:
Total Equity: Enter your total account balance (e.g., $15,000).
Minimum Balance: Set to the lowest your account can go before liquidation (e.g., $5,000). Risk is based on the difference, auto-adjusted by Frahm Factor.
Customize Display:
Calculation Method: Pick Margin-Based or Equity-Based.
Table Position: Choose where the table sits (e.g., top_right).
Table Size: Select XL, L, M, or S (default M, small text).
Table Cell Color: Set background color (default blue).
Table Text Color: Set text color (default white).
Table Cell Transparency: Adjust transparency (0 = solid, 100 = invisible, default 80).
Show Frahm Factor & Show Avg Candle Size: Check to show these rows, uncheck to hide (default on).

MC Geopolitical Tension Events📌 Script Title: Geopolitical Tension Events
📖 Description:
This script highlights key geopolitical and military tension events from 1914 to 2024 that have historically impacted global markets.
It automatically plots vertical dashed lines and labels on the chart at the time of each major event. This allows traders and analysts to visually assess how markets have responded to global crises, wars, and significant political instability over time.
🧠 Use Cases:
Historical backtesting: Understand how market responded to past geopolitical shocks.
Contextual analysis: Add macro context to technical setups.
🗓️ List of Geopolitical Tension Events in the Script
Date Event Title Description
1914-07-28 WWI Begins Outbreak of World War I following the assassination of Archduke Franz Ferdinand.
1929-10-24 Wall Street Crash Black Thursday, the start of the 1929 stock market crash.
1939-09-01 WWII Begins Germany invades Poland, starting World War II.
1941-12-07 Pearl Harbor Japanese attack on Pearl Harbor; U.S. enters WWII.
1945-08-06 Hiroshima Bombing First atomic bomb dropped on Hiroshima by the U.S.
1950-06-25 Korean War Begins North Korea invades South Korea.
1962-10-16 Cuban Missile Crisis 13-day standoff between the U.S. and USSR over missiles in Cuba.
1973-10-06 Yom Kippur War Egypt and Syria launch surprise attack on Israel.
1979-11-04 Iran Hostage Crisis U.S. Embassy in Tehran seized; 52 hostages taken.
1990-08-02 Gulf War Begins Iraq invades Kuwait, triggering U.S. intervention.
2001-09-11 9/11 Attacks Coordinated terrorist attacks on the U.S.
2003-03-20 Iraq War Begins U.S.-led invasion of Iraq to remove Saddam Hussein.
2008-09-15 Lehman Collapse Bankruptcy of Lehman Brothers; peak of global financial crisis.
2014-03-01 Crimea Crisis Russia annexes Crimea from Ukraine.
2020-01-03 Soleimani Strike U.S. drone strike kills Iranian General Qasem Soleimani.
2022-02-24 Ukraine Invasion Russia launches full-scale invasion of Ukraine.
2023-10-07 Hamas-Israel War Hamas launches attack on Israel, sparking war in Gaza.
2024-01-12 Red Sea Crisis Houthis attack ships in Red Sea, prompting Western naval response.

ES OHLC BASED ON 9:301. RTH Price Levels
YC (Yesterday's Close): Previous day's RTH closing price at 4:00 PM ET
0DTE-O (Today's Open): Current day's RTH opening price at 9:30 AM ET
T-E-M (Today's Europe-Asia Midpoint): Midpoint of overnight session high/low
T-E-R (Today's Europe-Asia Resistance): Overnight session high
T-E-S (Today's Europe-Asia Support): Overnight session low
Y-T-M (Yesterday-Today Midpoint): Midpoint between YC and 0DTE-O
2. Previous Bar Percentage Levels
Displays 50% retracement level for all bars
Shows 70% level for bullish bars (close > open)
Shows 30% level for bearish bars (close < open)
Lines automatically update with each new bar
3. Custom Support/Resistance Lines
Up to 4 customizable horizontal levels (2 resistance, 2 support)
Useful for marking key psychological levels or pivot points
4. VIX-Based Options Strategy Suggestions
Real-time VIX value display
Time Zone Handling
The indicator is configured for Central Time (CT) as Pine Script's default:
RTH Open: 8:30 AM CT (9:30 AM ET)
RTH Close: 3:00 PM CT (4:00 PM ET)
Overnight session: 7:00 PM CT to 8:30 AM CT next day
Usage Notes
Chart Requirement: This indicator only works on 5-minute timeframe charts
Auto-refresh: All lines and labels automatically refresh at each new trading day's RTH open
24-hour Market: Designed for ES futures which trade nearly 24 hours
Visual Clarity: Different line styles and colors for easy identification
Ideal For
Day traders focusing on ES futures
0DTE options traders needing key reference levels
Traders using overnight gaps and previous day's levels
Those incorporating VIX-based strategies in their trading

Aftershock by Session [SAKANE]■ Background & Motivation
In 24/7 markets like crypto, not all participants react simultaneously to major events.
Instead, reactions unfold across different regional trading sessions — Asia (APAC), Europe (EU), and the United States (US) — each with its own tempo and sentiment.
This indicator is designed to visualize which session drives the market after a key event — capturing the "aftershock" effect that ripples through time zones.
■ Key Features
Tracks price return (open → close) for each session: APAC / EU / US
Cumulative session returns are calculated and visualized
Smoothing options: SMA, EMA, or Ehlers SuperSmoother
Optimized for daily charts to highlight structural momentum shifts
Toggle visibility of each session independently
■ Why “Aftershock”?
Take April 2, 2025 — the day of the “Trump Tariff Opening.”
That policy announcement triggered a market-wide response. But:
Which session reacted first?
Which session truly moved the market?
This indicator is named “Aftershock” because it helps you see the ripple effect of such events — when and where momentum followed.
■ How to Use
Search for “Aftershock by Session ” on TradingView
Add it to your chart (use Daily timeframe)
Customize sessions and smoothing options via settings
You can also bookmark it for quick access.
■ Insights & Use Cases
Detect which session initiated or led market moves after news events
Understand geo-temporal dynamics — did the move start in Asia, Europe, or the US?
For example, on April 2, 2025, the day Trump’s tariff pivot was announced:
You can instantly see which session took the lead —
the APAC session hesitated, while the US session drove the trend.
This insight becomes visually obvious with the cumulative lines.
■ Unique Value
Unlike typical indicators based on raw price action,
Aftershock analyzes market movement through a session-based structural lens.
It captures where capital actually moved — and when.
A tool not just for technical analysis, but for event-driven, macro-aware market reading.
■ Final Thoughts
To truly understand market mechanics, we must look beyond candles and trends.
Aftershock by Session breaks down the 24-hour cycle into meaningful regional flows,
allowing you to track the true drivers behind price momentum.
Whether you're trading, researching, or tracking macro catalysts,
this tool helps answer the key question:
“Who moved the market — and when?”
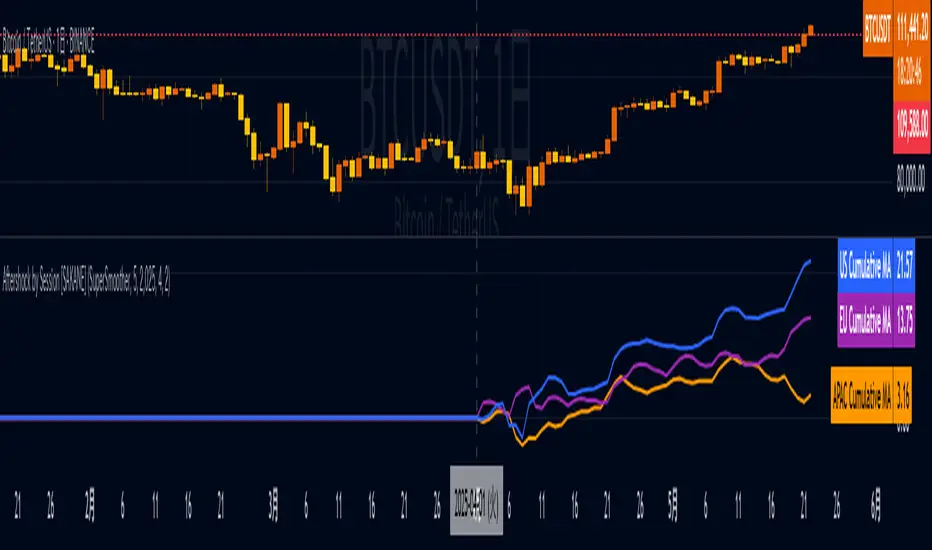
JPMorgan G7 Volatility IndexThe JPMorgan G7 Volatility Index: Scientific Analysis and Professional Applications
Introduction
The JPMorgan G7 Volatility Index (G7VOL) represents a sophisticated metric for monitoring currency market volatility across major developed economies. This indicator functions as an approximation of JPMorgan's proprietary volatility indices, providing traders and investors with a normalized measurement of cross-currency volatility conditions (Clark, 2019).
Theoretical Foundation
Currency volatility is fundamentally defined as "the statistical measure of the dispersion of returns for a given security or market index" (Hull, 2018, p.127). In the context of G7 currencies, this volatility measurement becomes particularly significant due to the economic importance of these nations, which collectively represent more than 50% of global nominal GDP (IMF, 2022).
According to Menkhoff et al. (2012, p.685), "currency volatility serves as a global risk factor that affects expected returns across different asset classes." This finding underscores the importance of monitoring G7 currency volatility as a proxy for global financial conditions.
Methodology
The G7VOL indicator employs a multi-step calculation process:
Individual volatility calculation for seven major currency pairs using standard deviation normalized by price (Lo, 2002)
- Weighted-average combination of these volatilities to form a composite index
- Normalization against historical bands to create a standardized scale
- Visual representation through dynamic coloring that reflects current market conditions
The mathematical foundation follows the volatility calculation methodology proposed by Bollerslev et al. (2018):
Volatility = σ(returns) / price × 100
Where σ represents standard deviation calculated over a specified timeframe, typically 20 periods as recommended by the Bank for International Settlements (BIS, 2020).
Professional Applications
Professional traders and institutional investors employ the G7VOL indicator in several key ways:
1. Risk Management Signaling
According to research by Adrian and Brunnermeier (2016), elevated currency volatility often precedes broader market stress. When the G7VOL breaches its high volatility threshold (typically 1.5 times the 100-period average), portfolio managers frequently reduce risk exposure across asset classes. As noted by Borio (2019, p.17), "currency volatility spikes have historically preceded equity market corrections by 2-7 trading days."
2. Counter-Cyclical Investment Strategy
Low G7 volatility periods (readings below the lower band) tend to coincide with what Shin (2017) describes as "risk-on" environments. Professional investors often use these signals to increase allocations to higher-beta assets and emerging markets. Campbell et al. (2021) found that G7 volatility in the lowest quintile historically preceded emerging market outperformance by an average of 3.7% over subsequent quarters.
3. Regime Identification
The normalized volatility framework enables identification of distinct market regimes:
- Readings above 1.0: Crisis/high volatility regime
- Readings between -0.5 and 0.5: Normal volatility regime
- Readings below -1.0: Unusually calm markets
According to Rey (2015), these regimes have significant implications for global monetary policy transmission mechanisms and cross-border capital flows.
Interpretation and Trading Applications
G7 currency volatility serves as a barometer for global financial conditions due to these currencies' centrality in international trade and reserve status. As noted by Gagnon and Ihrig (2021, p.423), "G7 currency volatility captures both trade-related uncertainty and broader financial market risk appetites."
Professional traders apply this indicator in multiple contexts:
- Leading indicator: Research from the Federal Reserve Board (Powell, 2020) suggests G7 volatility often leads VIX movements by 1-3 days, providing advance warning of broader market volatility.
- Correlation shifts: During periods of elevated G7 volatility, cross-asset correlations typically increase what Brunnermeier and Pedersen (2009) term "correlation breakdown during stress periods." This phenomenon informs portfolio diversification strategies.
- Carry trade timing: Currency carry strategies perform best during low volatility regimes as documented by Lustig et al. (2011). The G7VOL indicator provides objective thresholds for initiating or exiting such positions.
References
Adrian, T. and Brunnermeier, M.K. (2016) 'CoVaR', American Economic Review, 106(7), pp.1705-1741.
Bank for International Settlements (2020) Monitoring Volatility in Foreign Exchange Markets. BIS Quarterly Review, December 2020.
Bollerslev, T., Patton, A.J. and Quaedvlieg, R. (2018) 'Modeling and forecasting (un)reliable realized volatilities', Journal of Econometrics, 204(1), pp.112-130.
Borio, C. (2019) 'Monetary policy in the grip of a pincer movement', BIS Working Papers, No. 706.
Brunnermeier, M.K. and Pedersen, L.H. (2009) 'Market liquidity and funding liquidity', Review of Financial Studies, 22(6), pp.2201-2238.
Campbell, J.Y., Sunderam, A. and Viceira, L.M. (2021) 'Inflation Bets or Deflation Hedges? The Changing Risks of Nominal Bonds', Critical Finance Review, 10(2), pp.303-336.
Clark, J. (2019) 'Currency Volatility and Macro Fundamentals', JPMorgan Global FX Research Quarterly, Fall 2019.
Gagnon, J.E. and Ihrig, J. (2021) 'What drives foreign exchange markets?', International Finance, 24(3), pp.414-428.
Hull, J.C. (2018) Options, Futures, and Other Derivatives. 10th edn. London: Pearson.
International Monetary Fund (2022) World Economic Outlook Database. Washington, DC: IMF.
Lo, A.W. (2002) 'The statistics of Sharpe ratios', Financial Analysts Journal, 58(4), pp.36-52.
Lustig, H., Roussanov, N. and Verdelhan, A. (2011) 'Common risk factors in currency markets', Review of Financial Studies, 24(11), pp.3731-3777.
Menkhoff, L., Sarno, L., Schmeling, M. and Schrimpf, A. (2012) 'Carry trades and global foreign exchange volatility', Journal of Finance, 67(2), pp.681-718.
Powell, J. (2020) Monetary Policy and Price Stability. Speech at Jackson Hole Economic Symposium, August 27, 2020.
Rey, H. (2015) 'Dilemma not trilemma: The global financial cycle and monetary policy independence', NBER Working Paper No. 21162.
Shin, H.S. (2017) 'The bank/capital markets nexus goes global', Bank for International Settlements Speech, January 15, 2017.

The Echo System🔊 The Echo System – Trend + Momentum Trading Strategy
Overview:
The Echo System is a trend-following and momentum-based trading tool designed to identify high-probability buy and sell signals through a combination of market trend analysis, price movement strength, and candlestick validation.
Key Features:
📈 Trend Detection:
Uses a 30 EMA vs. 200 EMA crossover to confirm bullish or bearish trends.
Visual trend strength meter powered by percentile ranking of EMA distance.
🔄 Momentum Check:
Detects significant price moves over the past 6 bars, enhanced by ATR-based scaling to filter weak signals.
🕯️ Candle Confirmation:
Validates recent price action using the previous and current candle body direction.
✅ Smart Conditions Table:
A live dashboard showing all trade condition checks (Trend, Recent Price Move, Candlestick confirmations) in real-time with visual feedback.
📊 Backtesting & Stats:
Auto-calculates average win, average loss, risk-reward ratio (RRR), and win rate across historical signals.
Clean performance dashboard with color-coded metrics for easy reading.
🔔 Alerts:
Set alerts for trade signals or significant price movements to stay updated without monitoring the chart 24/7.
Visuals:
Trend markers and price movement flags plotted directly on the chart.
Dual tables:
📈 Conditions table (top-right): breaks down trade criteria status.
📊 Performance table (bottom-right): shows real-time stats on win/loss and RRR.🔊 The Echo System – Trend + Momentum Trading Strategy
Overview:
The Echo System is a trend-following and momentum-based trading tool designed to identify high-probability buy and sell signals through a combination of market trend analysis, price movement strength, and candlestick validation.
Key Features:
📈 Trend Detection:
Uses a 30 EMA vs. 200 EMA crossover to confirm bullish or bearish trends.
Visual trend strength meter powered by percentile ranking of EMA distance.
🔄 Momentum Check:
Detects significant price moves over the past 6 bars, enhanced by ATR-based scaling to filter weak signals.
🕯️ Candle Confirmation:
Validates recent price action using the previous and current candle body direction.
✅ Smart Conditions Table:
A live dashboard showing all trade condition checks (Trend, Recent Price Move, Candlestick confirmations) in real-time with visual feedback.
📊 Backtesting & Stats:
Auto-calculates average win, average loss, risk-reward ratio (RRR), and win rate across historical signals.
Clean performance dashboard with color-coded metrics for easy reading.
🔔 Alerts:
Set alerts for trade signals or significant price movements to stay updated without monitoring the chart 24/7.
Visuals:
Trend markers and price movement flags plotted directly on the chart.
Dual tables:
📈 Conditions table (top-right): breaks down trade criteria status.
📊 Performance table (bottom-right): shows real-time stats on win/loss and RRR.
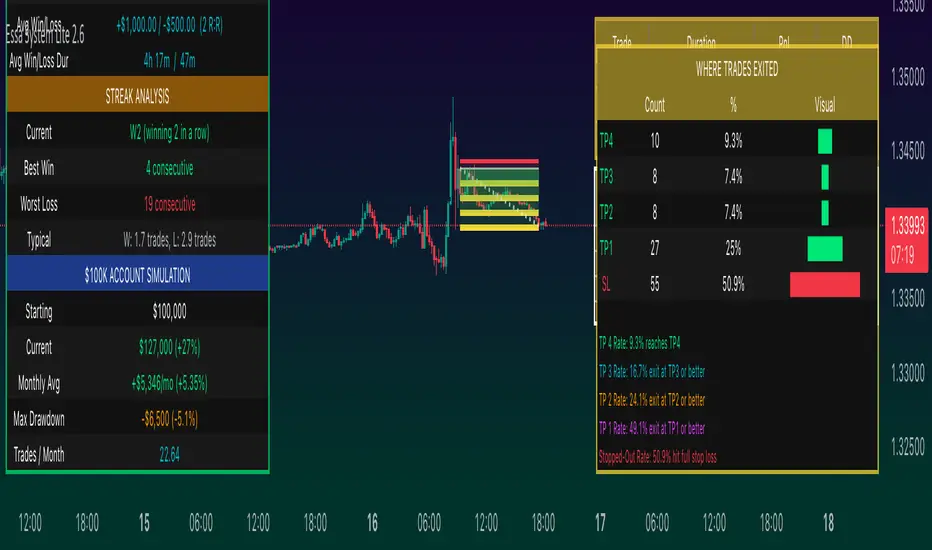
Williams R Zone Scalper v1.0[BullByte]Originality & Usefulness
Unlike standard Williams R cross-over scripts, this strategy layers five dynamic filters—moving-average trend, Supertrend, Choppiness Index, Bollinger Band Width, and volume validation —and presents a real-time dashboard with equity, PnL, filter status, and key indicator values. No other public Pine script combines these elements with toggleable filters and a custom dashboard. In backtests (BTC/USD (Binance), 5 min, 24 Mar 2025 → 28 Apr 2025), adding these filters turned a –2.09 % standalone Williams R into a +5.05 % net winner while cutting maximum drawdown in half.
---
What This Script Does
- Monitors Williams R (length 14) for overbought/oversold reversals.
- Applies up to five dynamic filters to confirm trend strength and volatility direction:
- Moving average (SMA/EMA/WMA/HMA)
- Supertrend line
- Choppiness Index (CI)
- Bollinger Band Width (BBW)
- Volume vs. its 50-period MA
- Plots blue arrows for Long entries (R crosses above –80 + all filters green) and red arrows for Short entries (R crosses below –20 + all filters green).
- Optionally sets dynamic ATR-based stop-loss (1.5×ATR) and take-profit (2×ATR).
- Shows a dashboard box with current position, equity, PnL, filter status, and real-time Williams R / MA/volume values.
---
Backtest Summary (BTC/USD(Binance), 5 min, 24 Mar 2025 → 28 Apr 2025)
• Total P&L : +50.70 USD (+5.05 %)
• Max Drawdown : 31.93 USD (3.11 %)
• Total Trades : 198
• Win Rate : 55.05 % (109/89)
• Profit Factor : 1.288
• Commission : 0.01 % per trade
• Slippage : 0 ticks
Even in choppy March–April, this multi-filter approach nets +5 % with a robust risk profile, compared to –2.09 % and higher drawdown for Williams R alone.
---
Williams R Alone vs. Multi-Filter Version
• Total P&L :
– Williams R alone → –20.83 USD (–2.09 %)
– Multi-Filter → +50.70 USD (+5.05 %)
• Max Drawdown :
– Williams R alone → 62.13 USD (6.00 %)
– Multi-Filter → 31.93 USD (3.11 %)
• Total Trades : 543 vs. 198
• Win Rate : 60.22 % vs. 55.05 %
• Profit Factor : 0.943 vs. 1.288
---
Inputs & What They Control
- wrLen (14): Williams R look-back
- maType (EMA): Trend filter type (SMA, EMA, WMA, HMA)
- maLen (20): Moving-average period
- useChop (true): Toggle Choppiness Index filter
- ciLen (12): CI look-back length
- chopThr (38.2): CI threshold (below = trending)
- useVol (true): Toggle volume-above-average filter
- volMaLen (50): Volume MA period
- useBBW (false): Toggle Bollinger Band Width filter
- bbwMaLen (50): BBW MA period
- useST (false): Toggle Supertrend filter
- stAtrLen (10): Supertrend ATR length
- stFactor (3.0): Supertrend multiplier
- useSL (false): Toggle ATR-based SL/TP
- atrLen (14): ATR period for SL/TP
- slMult (1.5): SL = slMult × ATR
- tpMult (2.0): TP = tpMult × ATR
---
How to Read the Chart
- Blue arrow (Long): Williams R crosses above –80 + all enabled filters green
- Red arrow (Short) : Williams R crosses below –20 + all filters green
- Dashboard box:
- Top : position and equity
- Next : cumulative PnL in USD & %
- Middle : green/white dots for each filter (green=passing, white=disabled)
- Bottom : Williams R, MA, and volume current values
---
Usage Tips
- Add the script : Indicators → My Scripts → Williams R Zone Scalper v1.0 → Add to BTC/USD chart on 5 min.
- Defaults : Optimized for BTC/USD.
- Forex majors : Raise `chopThr` to ~42.
- Stocks/high-beta : Enable `useBBW`.
- Enable SL/TP : Toggle `useSL`; stop-loss = 1.5×ATR, take-profit = 2×ATR apply automatically.
---
Common Questions
- * Why not trade every Williams R reversal?*
Raw Williams R whipsaws in sideways markets. Choppiness and volume filters reduce false entries.
- *Can I use on 1 min or 15 min?*
Yes—adjust ATR length or thresholds accordingly. Defaults target 5 min scalping.
- *What if all filters are on?*
Fewer arrows, higher-quality signals. Expect ~10 % boost in average win size.
---
Disclaimer & License
Trading carries risk of loss. Use this script “as is” under the Mozilla Public License 2.0 (mozilla.org). Always backtest, paper-trade, and adjust risk settings to your own profile.
---
Credits & References
- Pine Script v6, using TradingView’s built-in `ta.supertrend()`.
- TradingView House Rules: www.tradingview.com
Goodluck!
BullByte

SessionRangeLevels_v0.1SessionRangeLevels_v0.1
Overview:
SessionRangeLevels_v0.1 is a customizable Pine Script (v6) indicator designed to plot key price levels based on a user-defined trading session. It identifies the high and low of the session and calculates intermediate levels (75%, 50% "EQ", and 25%) within that range. These levels are projected forward as horizontal lines with accompanying labels, providing traders with dynamic support and resistance zones. The indicator supports extensive customization for session timing, time zones, line styles, colors, and more.
Key Features:
Session-Based Range Detection: Tracks the high and low prices during a specified session (e.g., 0600-0900) and updates them dynamically as the session progresses.
Customizable Levels: Displays High, 75%, EQ (50%), 25%, and Low levels, each with independent toggle options, styles (Solid, Dashed, Dotted), colors, and widths.
Session Anchor: Optional vertical line marking the session start, with customizable style, color, and width.
Projection Offset: Extends level lines forward by a user-defined number of bars (default: 24) for future price reference.
Labels: Toggleable labels for each level (e.g., "High," "75%," "EQ") with adjustable size (Tiny, Small, Normal, Large).
Time Zone Support: Aligns session timing to a selected time zone (e.g., America/New_York, UTC, Asia/Tokyo, etc.).
Alert Conditions: Triggers alerts when the price crosses any of the plotted levels (High, 75%, EQ, 25%, Low).
Inputs:
Session Time (HHMM-HHMM): Define the session range (e.g., "0600-0900" for 6:00 AM to 9:00 AM).
Time Zone: Choose from options like UTC, America/New_York, Europe/London, etc.
Anchor Settings: Toggle the session start line, adjust its style (default: Dotted), color (default: Black), and width (default: 1).
Level Settings:
High (Solid, Black, Width 2)
75% (Dotted, Blue, Width 1)
EQ/50% (Dotted, Orange, Width 1)
25% (Dotted, Blue, Width 1)
Low (Solid, Black, Width 2)
Each level includes options to show/hide, set style, color, width, and label visibility.
Projection Offset: Number of bars to extend lines (default: 24).
Label Size: Set label size (default: Small).
How It Works:
The indicator detects the start and end of the user-defined session based on the specified time and time zone.
During the session, it tracks the highest high and lowest low, updating the levels in real-time.
At the session start, it plots the High, Low, and intermediate levels (75%, 50%, 25%), projecting them forward.
Lines and labels dynamically adjust as new highs or lows occur within the session.
Alerts notify users when the price crosses any active level.
Usage:
Ideal for traders who focus on session-based strategies (e.g., London or New York open). Use it to identify key price zones, monitor breakouts, or set targets. Customize the appearance to suit your chart preferences and enable alerts for real-time trading signals.
Notes:
Ensure your chart’s timeframe aligns with your session duration for optimal results (e.g., 1-minute or 5-minute charts for short sessions).
The indicator overlays directly on the price chart for easy integration with other tools.

Hourly Volatility Explorer📊 Hourly Volatility Explorer: Master The Market's Pulse
Unlock the hidden rhythms of price action with this sophisticated volatility analysis tool. The Hourly Volatility Explorer reveals the most potent trading hours across multiple time zones, giving you a strategic edge in timing your trades.
🌟 Key Features:
⏰ Multi-Timezone Analysis
• GMT (UTC+0)
• EST (UTC-5) - New York
• BST (UTC+1) - London
• JST (UTC+9) - Tokyo
• AEST (UTC+10) - Sydney
Perfect for tracking major market sessions and their overlaps!
📈 Dynamic Visualization
• Color-gradient hourly bars for instant pattern recognition
• Real-time volatility comparison
• Interactive data table with comprehensive statistics
• Automatic highlighting of peak volatility periods
🎯 Strategic Applications:
Day Trading:
• Identify optimal trading windows
• Avoid low-liquidity periods
• Capitalize on session overlaps
• Fine-tune entry/exit timing
Risk Management:
• Set appropriate stop losses based on hourly volatility
• Adjust position sizes for different market hours
• Optimize risk-reward ratios
• Plan around high-impact hours
Global Market Analysis:
• Track volatility across all major sessions
• Spot institutional trading patterns
• Identify quiet vs. active periods
• Monitor 24/7 market dynamics
💡 Perfect For:
• Forex traders navigating global sessions
• Crypto traders in 24/7 markets
• Day traders optimizing execution times
• Algorithmic traders fine-tuning strategies
• Risk managers calibrating exposure
📊 Advanced Features:
• Rolling 3-month analysis for reliable patterns
• Precise pip movement calculations
• Sample size tracking for statistical validity
• Real-time current hour comparison
• Color-coded visual system for instant insights
⚡ Pro Trading Tips:
• Use during major session overlaps for maximum opportunity
• Compare patterns across different instruments
• Combine with volume analysis for deeper insights
• Track seasonal variations in hourly patterns
• Build trading schedules around peak hours
🎓 Educational Value:
• Understand market microstructure
• Learn global market dynamics
• Master timezone relationships
• Develop timing intuition
🛠️ Customization:
• Adjustable lookback period
• Flexible pip multiplier
• Multiple timezone options
• Visual preference settings
Whether you're scalping the 1-minute chart or managing longer-term positions, the Hourly Volatility Explorer provides the precise timing intelligence needed for today's global markets.
Transform your trading schedule from guesswork to science. Know exactly when markets move, why they move, and how to position yourself for maximum opportunity.
#TechnicalAnalysis #Trading #Volatility #MarketTiming #DayTrading #Forex #Crypto #TradingView #PineScript #MarketAnalysis #TradingStrategy #RiskManagement #GlobalMarkets #FinancialMarkets #TradingTools #MarketStructure #PriceAction #Scalping #SwingTrading #AlgoTrading

Correlation X macroeconomicsFind the correlation between financial assets and the main Brazilian macroeconomic variables:
SELIC rate (Red)
PIB (Green)
Inflation (Blue)
Employment and income (Yellow)
Unlike other indicators that measure the correlation between two assets, the indicator "Correlation X macroeconomics" measures, for example, the correlation that the VALE3 asset has with the SELIC rate.
The correlation is obtained by calculating the variation suffered by a given asset on the day a given Brazilian macroeconomic variable is released.
This indicator can be used on any financial asset.
Use time frame chart = 1 day.
To calculate the correlation, data published by IBGE and the Central Bank of Brazil over a period of time are used. This time period is different depending on the selected macroeconomic variable. Namely:
16 PIB disclosures (4 years)
24 SELIC rate disclosures (3 years)
24 disclosures of IPCA and employment and income data (2 years)
You can select one or more macroeconomic variables to check the effect of correlation separately on each of them.
This indicator "Correlation X macroeconomics" will be updated monthly, as detailed below:
At the end of the day on which the PIB is released
At the end of the day on which employment and income data are released
At the end of the day following the day on which the SELIC rate is published
On the last business day of the month if none of the aforementioned disclosures occur
