Dynamic Sentiment RSI [UAlgo]The Dynamic Sentiment RSI is a technical analysis tool that combines the classic RSI (Relative Strength Index) concept with dynamic sentiment analysis, offering traders enhanced insights into market conditions. Unlike the traditional RSI, this indicator integrates volume weighting, sentiment factors, and smoothing features to provide a more nuanced view of momentum and potential market reversals. It is designed to assist traders in detecting overbought/oversold conditions, momentum shifts, and to generate potential buy or sell signals using crossover and crossunder techniques. By dynamically adjusting based on sentiment and volume factors, this RSI offers better adaptability to varying market conditions, making it suitable for different trading styles and timeframes.
This tool is particularly helpful for traders who wish to explore not only price movement but also the underlying market sentiment, offering a more comprehensive approach to momentum analysis. The sentiment factor amplifies the RSI's sensitivity to price shifts, making it easier to detect early signals of market reversals or the continuation of a trend.
🔶 Key Features
Dynamic Sentiment Calculation: The indicator incorporates a "Sentiment Factor" that adjusts the RSI length dynamically based on a multiplier, helping traders better understand market sentiment at different time intervals.
Volume Weighting: When enabled, the RSI calculations are weighted by volume, allowing traders to give more importance to price movements with higher trading volume, which may provide more accurate signals.
Smoothing Feature: A customizable smoothing period is applied to the RSI to help filter out noise and make the signal smoother. This feature is particularly useful for traders who prefer to focus on long-term trends while minimizing false signals.
Step Size Customization: A "Step Size" input allows users to round the sentiment RSI to predefined intervals, making the results easier to interpret and act upon. This feature allows you to focus on significant sentiment changes and ignore minor fluctuations.
Crossover/Crossunder Alerts: The indicator includes crossover and crossunder signals on the zero-line, helping traders identify potential buy and sell opportunities as the smoothed RSI crosses these levels.
The indicator offers a clear visual display with multiple color-coded lines and areas:
Sentiment RSI: Plotted as an area chart, color-coded based on sentiment strength.
Raw RSI: A purple line representing the raw adjusted RSI.
Smoothed RSI: A dynamic line, color-coded aqua or orange based on its position relative to the zero line.
Buy/Sell Signals: Triangle shapes are plotted at crossovers and crossunders, providing clear entry and exit points.
🔶 Interpreting the Indicator
Sentiment RSI
-This line represents the sentiment-adjusted RSI, where the higher the value, the stronger the bullish sentiment, and the lower the value, the stronger the bearish sentiment. It is rounded to step intervals, making it easier to detect significant shifts in sentiment.
- A positive sentiment RSI (above 0) suggests bullish market conditions, while a negative sentiment RSI (below 0) suggests bearish conditions.
Smoothed RSI
The smoothed RSI helps reduce noise and shows the trend more clearly.
Crossovers of the zero line are significant:
- Crossover above zero: Indicates that bullish momentum is building, potentially signaling a buying opportunity.
- Crossunder below zero: Signals a shift towards bearish momentum, potentially indicating a sell signal.
Traders should look for these crossovers in conjunction with other signals for more accurate entry/exit points.
Raw RSI (Adjusted)
The raw adjusted RSI offers a less smoothed, more responsive version of the RSI. While it may be noisier, it provides early signals of market reversals and trends.
Crossover/Crossunder Signals
- When the smoothed RSI crosses above the zero line, a "Signal Up" triangle appears, indicating a potential buying opportunity.
- When the smoothed RSI crosses below the zero line, a "Signal Down" triangle appears, signaling a potential sell opportunity.
These signals help traders time their entries and exits by identifying momentum shifts.
Volume Weighting (Optional)
- If volume weighting is enabled, the RSI will give more weight to periods of higher trading volume, making the signals more reliable when the market is highly active.
Strong Up/Down Levels (40/-40)
- These dotted lines represent extreme sentiment levels. When the sentiment RSI reaches 40 or -40, the market may be nearing an overbought or oversold condition, respectively. This could be a signal for traders to prepare for potential reversals or shifts in momentum.
By combining the various components of this indicator, traders can gain a comprehensive view of market sentiment and price action, helping them make more informed trading decisions. The combination of sentiment factors, volume weighting, and smoothing makes this indicator highly flexible and suitable for a variety of trading strategies.
🔶 Disclaimer
Use with Caution: This indicator is provided for educational and informational purposes only and should not be considered as financial advice. Users should exercise caution and perform their own analysis before making trading decisions based on the indicator's signals.
Not Financial Advice: The information provided by this indicator does not constitute financial advice, and the creator (UAlgo) shall not be held responsible for any trading losses incurred as a result of using this indicator.
Backtesting Recommended: Traders are encouraged to backtest the indicator thoroughly on historical data before using it in live trading to assess its performance and suitability for their trading strategies.
Risk Management: Trading involves inherent risks, and users should implement proper risk management strategies, including but not limited to stop-loss orders and position sizing, to mitigate potential losses.
No Guarantees: The accuracy and reliability of the indicator's signals cannot be guaranteed, as they are based on historical price data and past performance may not be indicative of future results.
חפש סקריפטים עבור "泰国一寺庙被曝藏有40多具尸体"

RSI with Swing Trade by Kelvin_VAlgorithm Description: "RSI with Swing Trade by Kelvin_V"
1. Introduction:
This algorithm uses the RSI (Relative Strength Index) and optional Moving Averages (MA) to detect potential uptrends and downtrends in the market. The key feature of this script is that it visually changes the candle colors based on the market conditions, making it easier for users to identify potential trend swings or wave patterns.
The strategy offers flexibility by allowing users to enable or disable the MA condition. When the MA condition is enabled, the strategy will confirm trends using two moving averages. When disabled, the strategy will only use RSI to detect potential market swings.
2. Key Features of the Algorithm:
RSI (Relative Strength Index):
The RSI is used to identify potential market turning points based on overbought and oversold conditions.
When the RSI exceeds a predefined upper threshold (e.g., 60), it suggests a potential uptrend.
When the RSI drops below a lower threshold (e.g., 40), it suggests a potential downtrend.
Moving Averages (MA) - Optional:
Two Moving Averages (Short MA and Long MA) are used to confirm trends.
If the Short MA crosses above the Long MA, it indicates an uptrend.
If the Short MA crosses below the Long MA, it indicates a downtrend.
Users have the option to enable or disable this MA condition.
Visual Candle Coloring:
Green candles represent a potential uptrend, indicating a bullish move based on RSI (and MA if enabled).
Red candles represent a potential downtrend, indicating a bearish move based on RSI (and MA if enabled).
3. How the Algorithm Works:
RSI Levels:
The user can set RSI upper and lower bands to represent potential overbought and oversold levels. For example:
RSI > 60: Indicates a potential uptrend (bullish move).
RSI < 40: Indicates a potential downtrend (bearish move).
Optional MA Condition:
The algorithm also allows the user to apply the MA condition to further confirm the trend:
Short MA > Long MA: Confirms an uptrend, reinforcing a bullish signal.
Short MA < Long MA: Confirms a downtrend, reinforcing a bearish signal.
This condition can be disabled, allowing the user to focus solely on RSI signals if desired.
Swing Trade Logic:
Uptrend: If the RSI exceeds the upper threshold (e.g., 60) and (optionally) the Short MA is above the Long MA, the candles will turn green to signal a potential uptrend.
Downtrend: If the RSI falls below the lower threshold (e.g., 40) and (optionally) the Short MA is below the Long MA, the candles will turn red to signal a potential downtrend.
Visual Representation:
The candle colors change dynamically based on the RSI values and moving average conditions, making it easier for traders to visually identify potential trend swings or wave patterns without relying on complex chart analysis.
4. User Customization:
The algorithm provides multiple customization options:
RSI Length: Users can adjust the period for RSI calculation (default is 4).
RSI Upper Band (Potential Uptrend): Users can customize the upper RSI level (default is 60) to indicate a potential bullish move.
RSI Lower Band (Potential Downtrend): Users can customize the lower RSI level (default is 40) to indicate a potential bearish move.
MA Type: Users can choose between SMA (Simple Moving Average) and EMA (Exponential Moving Average) for moving average calculations.
Enable/Disable MA Condition: Users can toggle the MA condition on or off, depending on whether they want to add moving averages to the trend confirmation process.
5. Benefits of the Algorithm:
Easy Identification of Trends: By changing candle colors based on RSI and MA conditions, the algorithm makes it easy for users to visually detect potential trend reversals and trend swings.
Flexible Conditions: The user has full control over the RSI and MA settings, allowing them to adapt the strategy to different market conditions and timeframes.
Clear Visualization: With the candle color changes, users can quickly recognize when a potential uptrend or downtrend is forming, enabling faster decision-making in their trading.
6. Example Usage:
Day traders: Can apply this strategy on short timeframes such as 5 minutes or 15 minutes to detect quick trends or reversals.
Swing traders: Can use this strategy on longer timeframes like 1 hour or 4 hours to identify and follow larger market swings.

Breadth Indicators NYSE Percent Above Moving AverageBreadth Indicators NYSE - transmits the processed data from the Barchart provider
NYSE - Breadth Indicators
S&P 500 - Breadth Indicators
DOW - Breadth Indicators
RUSSEL 1000 - Breadth Indicators
RUSSEL 2000 - Breadth Indicators
RUSSEL 3000 - Breadth Indicators
Moving Average - 5, 20, 50, 100, 150, 200
The "Percentage above 50-day SMA" indicator measures the percentage of stocks in the index trading above their 50-day moving average. It is a useful tool for assessing the general state of the market and identifying overbought and oversold conditions.
One way to use the "Percentage above 50-day SMA" indicator in a trading strategy is to combine it with a long-term moving average to determine whether the trend is bullish or bearish. Another way to use it is to combine it with a short-term moving average to identify pullbacks and rebounds within the overall trend.
The purpose of using the "Percentage above 50-day SMA" indicator is to participate in a larger trend with a better risk-reward ratio. By using this indicator to identify pullbacks and bounces, you can reduce the risk of entering trades at the wrong time.
Bull Signal Recap:
150-day EMA of $SPXA50R crosses above 52.5 and remains above 47.50 to set the bullish tone.
5-day EMA of $SPXA50R moves below 40 to signal a pullback
5-day EMA of $SPXA50R moves above 50 to signal an upturn
Bear Signal Recap:
150-day EMA of $SPXA50R crosses below 47.50 and remains below 52.50 to set the bearish tone.
5-day EMA of $SPXA50R moves above 60 to signal a bounce
5-day EMA of $SPXA50R moves below 50 to signal a downturn
Tweaking
There are numerous ways to tweak a trading system, but chartists should avoid over-optimizing the indicator settings. In other words, don't attempt to find the perfect moving average period or crossover level. Perfection is unattainable when developing a system or trading the markets. It is important to keep the system logical and focus tweaks on other aspects, such as the actual price chart of the underlying security.
What do levels above and below 50% signify in the long-term moving average?
A move above 52.5% is deemed bullish, and below 47.5% is deemed bearish. These levels help to reduce whipsaws by using buffers for bullish and bearish thresholds.
How does the short-term moving average work to identify pullbacks or bounces?
When using a 5-day EMA, a move below 40 signals a pullback, and a move above 60 signals a bounce.
How is the reversal of pullback or bounce identified?
A move back above 50 after a pullback or below 50 after a bounce signals that the respective trend may be resuming.
How can you ensure that the uptrend has resumed?
It’s important to wait for the surge above 50 to ensure the uptrend has resumed, signaling improved breadth.
Can the system be tweaked to optimize indicator settings?
While there are various ways to tweak the system, seeking perfection through over-optimizing settings is advised against. It's crucial to keep the system logical and focus tweaks on the price chart of the underlying security.
RUSSIAN \ Русская версия.
Индикатор "Процент выше 50-дневной скользящей средней" измеряет процент акций, торгующихся в индексе выше их 50-дневной скользящей средней. Это полезный инструмент для оценки общего состояния рынка и выявления условий перекупленности и перепроданности.
Один из способов использования индикатора "Процент выше 50-дневной скользящей средней" в торговой стратегии - это объединить его с долгосрочной скользящей средней, чтобы определить, является ли тренд бычьим или медвежьим. Другой способ использовать его - объединить с краткосрочной скользящей средней, чтобы выявить откаты и отскоки в рамках общего тренда.
Цель использования индикатора "Процент выше 50-дневной скользящей средней" - участвовать в более широком тренде с лучшим соотношением риска и прибыли. Используя этот индикатор для выявления откатов и отскоков, вы можете снизить риск входа в сделки в неподходящее время.
Краткое описание бычьего сигнала:
150-дневная ЕМА на уровне $SPXA50R пересекает отметку 52,5 и остается выше 47,50, что задает бычий настрой.
5-дневная ЕМА на уровне $SPXA50R опускается ниже 40, сигнализируя об откате
5-дневная ЕМА на уровне $SPXA50R поднимается выше 50, сигнализируя о росте
Обзор медвежьих сигналов:
150-дневная ЕМА на уровне $SPXA50R пересекает уровень ниже 47,50 и остается ниже 52,50, что указывает на медвежий настрой.
5-дневная ЕМА на уровне $SPXA50R поднимается выше 60, сигнализируя о отскоке
5-дневная ЕМА на уровне $SPXA50 опускается ниже 50, что сигнализирует о спаде
Корректировка
Существует множество способов настроить торговую систему, но графологам следует избегать чрезмерной оптимизации настроек индикатора. Другими словами, не пытайтесь найти идеальный период скользящей средней или уровень пересечения. Совершенство недостижимо при разработке системы или торговле на рынках. Важно поддерживать логику системы и уделять особое внимание другим аспектам, таким как график фактической цены базовой ценной бумаги.
Что означают уровни выше и ниже 50% в долгосрочной скользящей средней?
Движение выше 52,5% считается бычьим, а ниже 47,5% - медвежьим. Эти уровни помогают снизить риски, используя буферы для бычьих и медвежьих порогов.
Как краткосрочная скользящая средняя помогает идентифицировать откаты или отскоки?
При использовании 5-дневной ЕМА движение ниже 40 указывает на откат, а движение выше 60 указывает на отскок.
Как определяется разворот отката или отскока?
Движение выше 50 после отката или ниже 50 после отскока сигнализирует о возможном возобновлении соответствующего тренда.
Как вы можете гарантировать, что восходящий тренд возобновился?
Важно дождаться скачка выше 50, чтобы убедиться в возобновлении восходящего тренда, сигнализирующего о расширении диапазона.
Можно ли настроить систему для оптимизации настроек индикатора?
Хотя существуют различные способы настройки системы, не рекомендуется стремиться к совершенству с помощью чрезмерной оптимизации настроек. Крайне важно сохранить логичность системы и сфокусировать изменения на ценовом графике базовой ценной бумаги.

RSI Multiple TimeFrame, Version 1.0RSI Multiple TimeFrame, Version 1.0
Overview
The RSI Multiple TimeFrame script is designed to enhance trading decisions by providing a comprehensive view of the Relative Strength Index (RSI) across multiple timeframes. This tool helps traders identify overbought and oversold conditions more accurately by analyzing RSI values on different intervals simultaneously. This is particularly useful for traders who employ multi-timeframe analysis to confirm signals and make more informed trading decisions.
Unique Feature of the new script (described in detail below)
Multi-Timeframe RSI Analysis
Customizable Timeframes
Visual Signal Indicators (dots)
Overbought and Oversold Layers with gradual Background Fill
Enhanced Trend Confirmation
Originality and Usefulness
This script combines the RSI indicator across three distinct timeframes into a single view, providing traders with a multi-dimensional perspective of market momentum. It also provides associated signals to better time dips and peaks. Unlike standard RSI indicators that focus on a single timeframe, this script allows users to observe RSI trends across short, medium, and long-term intervals, thereby improving the accuracy of entry and exit signals. This is particularly valuable for traders looking to align their short-term strategies with longer-term market trends.
Signal Description
The script also includes a unique signal feature that plots green and red dots on the chart to highlight potential buy and sell opportunities:
Green Dots : These appear when all three RSI values are under specific thresholds (RSI of the shortest timeframe < 30, the medium timeframe < 40, and the longest timeframe < 50) and the RSI of the shortest timeframe is showing an upward trend (current value is greater than the previous value, and the value two periods ago is greater than the previous value). This indicates a potential buying opportunity as the market may be shifting from an oversold condition.
Red Dots : These appear when all three RSI values are above specific thresholds (RSI of the shortest timeframe > 70, the medium timeframe > 60, and the longest timeframe > 50) and the RSI of the shortest timeframe is showing a downward trend (current value is less than the previous value, and the value two periods ago is less than the previous value). This indicates a potential selling opportunity as the market may be shifting from an overbought condition.
These signals help traders identify high-probability turning points in the market by ensuring that momentum is aligned across multiple timeframes.
Detailed Description
Input Variables
RSI Period (`len`) : The number of periods to calculate the RSI. Default is 14.
RSI Source (`src`) : The price source for RSI calculation, defaulting to the average of the high and low prices (`hl2`).
Timeframes (`tf1`, `tf2`, `tf3`) : The different timeframes for which the RSI is calculated, defaulting to 5 minutes, 1 hour, and 8 hours respectively.
Functionality
RSI Calculations : The script calculates the RSI for each of the three specified timeframes using the `request.security` function. This allows the RSI to be plotted for multiple intervals, providing a layered view of market momentum.
```pine
rsi_tf1 = request.security(syminfo.tickerid, tf1, ta.rsi(src, len))
rsi_tf2 = request.security(syminfo.tickerid, tf2, ta.rsi(src, len))
rsi_tf3 = request.security(syminfo.tickerid, tf3, ta.rsi(src, len))
```
Plotting : The RSI values for the three timeframes are plotted with different colors and line widths for clear visual distinction. This makes it easy to compare RSI values across different intervals.
```pine
p1 = plot(rsi_tf1, title="RSI 5m", color=color.rgb(200, 200, 255), linewidth=2)
p2 = plot(rsi_tf2, title="RSI 1h", color=color.rgb(125, 125, 255), linewidth=2)
p3 = plot(rsi_tf3, title="RSI 8h", color=color.rgb(0, 0, 255), linewidth=2)
```
Overbought and Oversold Levels : Horizontal lines are plotted at standard RSI levels (20, 30, 40, 50, 60, 70, 80) to visually identify overbought and oversold conditions. The areas between these levels are filled with varying shades of blue for better visualization.
```pine
h80 = hline(80, title="RSI threshold 80", color=color.gray, linestyle=hline.style_dotted, linewidth=1)
h70 = hline(70, title="RSI threshold 70", color=color.gray, linestyle=hline.style_dotted, linewidth=1)
...
fill(h70, h80, color=color.rgb(33, 150, 243, 95), title="Background")
```
Signal Plotting : The script adds green and red dots to indicate potential buy and sell signals, respectively. A green dot is plotted when all RSI values are under specific thresholds and the RSI of the shortest timeframe is rising. Conversely, a red dot is plotted when all RSI values are above specific thresholds and the RSI of the shortest timeframe is falling.
```pine
plotshape(series=(rsi_tf1 < 30 and rsi_tf2 < 40 and rsi_tf3 < 50 and (rsi_tf1 > rsi_tf1 ) and (rsi_tf1 > rsi_tf1 )) ? 1 : na, location=location.bottom, color=color.green, style=shape.circle, size=size.tiny)
plotshape(series=(rsi_tf1 > 70 and rsi_tf2 > 60 and rsi_tf3 > 50 and (rsi_tf1 < rsi_tf1 ) and (rsi_tf1 < rsi_tf1 )) ? 1 : na, location=location.top, color=color.red, style=shape.circle, size=size.tiny)
```
How to Use
Configuring Inputs : Adjust the RSI period and source as needed. Modify the timeframes to suit your trading strategy.
Interpreting the Indicator : Use the plotted RSI values to gauge momentum across different timeframes. Look for overbought conditions (RSI above 70, 60 and 50) and oversold conditions (RSI below 30, 40 and 50) across multiple intervals to confirm trade signals.
Signal Confirmation : Pay attention to the green and red dots that provide signals to better time dips and peaks. dots are printed when the lower timeframe (5mn by default) shows sign of reversal.
These signals are more reliable when confirmed across all three timeframes.
This script provides a nuanced view of RSI, helping traders make more informed decisions by considering multiple timeframes simultaneously. By combining short, medium, and long-term RSI values, traders can better align their strategies with overarching market trends, thus improving the precision of their trading actions.

ICT IPDAGuided by ICT tutoring, I create this versatile indicator "IPDA".
This indicator shows a different way of viewing the “IPDA” by calculating from START
(-20 / -40 / -60) to (+20 /+40 /+60) Days, showing the Highs and Lows of the IPDA of the Previous days and both of the subsequent ones, the levels of (-20 / -40 / -60) Days can be taken into consideration as objectives to be achieved in the range of days (+20 /+40 /+60)
The user has the possibility to:
- Choose whether to display IPDAs before and after START
- Choose to show High and Low levels
- Choose to show Prices
The indicator should be used as ICT shows in its concepts.
Example on how to evaluate a possible Start IPDA:
Example for Entry targeting IPDAs :
If something is not clear, comment below and I will reply as soon as possible.

Cloud Bunching [5ema]Reused some functions from (i believe made by):
©paaax: The table position function.
@QuantNomad: The function calculated value and array screener for 40+ instruments .
How it uses:
Gives signal when the cloud is bunching with ratio smaller than the set ratio and the close price breaking out the cloud.
Track 40 different symbols, on any timeframe to follow and alert.
When a symbol has a signal, it will display on the chart and send an alert.
How it works:
The cloud created by 5 EMA (20, 50, 200, 460, 610). Upper Cloud is max EMA , Lower Cloud is min EMA . Center line is averange (5 EMA )
If the ratio upper / lower < input bunching (%) -> change color of cloud.
Get the signal if: the close price break out cloud (with bar is shooting, or hammer ,...) and high volume (or not).
With another symbols (max 40 ) also use that function with any time frame. By request.security() and array function.
How it setting:
Change the bunching rate (%) of the clouds for any symbols.
Change the percentage (%) of the close price that breaks out of the bunching cloud.
Choose volume condition.
Show or turn off the cloud, table.
Select the symbol to follow.
Choose a timeframe to follow other symbols.
----
This indicator is for reference only, you need your own method and strategy.
If you have any questions, please let me know in the comments.

GIRISH indicatorHello traders,
This indicator is the enhancement to my previous indicator (RSI+OBV). There is combined RSI and OBV with DMI. This new indicator is combination of RSI and OBV with VWAP . I have been using this indicator for intraday trades in NIFTY & BANKNIFTY .
The white line indicates the movement of VWAP wrt current price. There default range for this has been defined as -40 to 40 .
Entry for long: When white line goes below -40, we need to wait for green background. Entry has to be taken when green background appears. If price goes below the entry point, averaging can be done once. Price will surely go long and give us good profit.
Entry for short: When white line goes above 40 , we need to wait for red background (if darker red comes, it is better) . Entry has to be taken when red background appears. If price goes above the entry point, averaging can be done once. Price will surely go down and give us good profit on short side.
PS: Please do back testing in chart before taking trades.

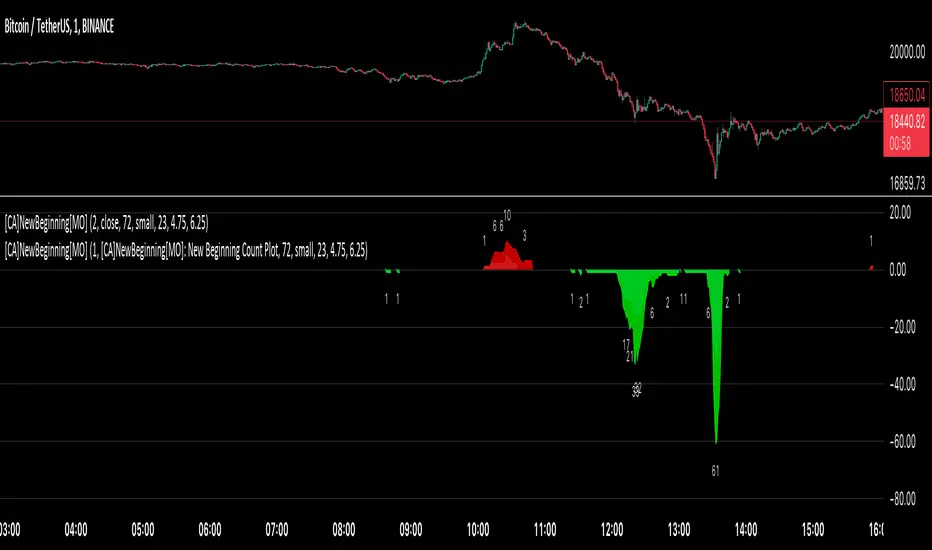
[ChasinAlts] A New Beginning[MO]Hello Tradeurs, firstly let me say this… Please do not think that this dump is over (so I want to gift you one of the best gifts I CAN gift you at the PERFECT TIME...which is now) but I believe it to be the final one before a New Beginning is upon us. I hope that anybody that sees this within the next day or so listens to me when I tell you this… Follow the instructions below, IF ANYTHING, just to set the alert to be notify you so you can see why I’m about to tell you everything that I’m about to tell you. That being that this indicator is pure magic…..BUT you must stay in your lane when using it (ie. ultimately, understand its use case) and most importantly, how many people you expose it to. The good thing about it is it produces very few alerts. In fact, it was built SOLELY to find the very tips of MAJOR dumps/pumps (with its current default settings). I honestly cannot remember where I acquired the code so if anyone recognizes it please direct me to the source so I can give a shoutout. In the past it has been so astonishingly accurate that I didn’t want to publish it but I've just been...in the mood I suppose recently.
Now…it is SPECIFICALLY meant for the 1min TF. I’ll say it again… It is meant for ONE MINUTE CHARTS…it was built for 1min charts, it will only work as well as I’m describing to you on the…you guessed it…ONE MINUTE CHART (again, with the default settings how they are, that is). If any of you use it for this present dump (November 8, 2022) and want to thank me for it or speak very highly about it or give it a bunch of likes… DO NOT!!! I will reword this so you fully comprehend my urgency on this matter. I do not want this indicator getting out for every Joe Schmoe (or stupid YouTuber) to use and spread because the manipulators will see to it that it will no longer work. Things that will happen that will cause it to gain the popularity that I do not want it to have are the following:
1) You "like" the indicator in TradingView to show appreciation/that your using it so that it will show up in your indicators list (to get past this you need to select all of the text of the script on the indicator's page and copy and paste it into the “Pine Editor”. Then select "save" and name it as you wish. Now, it is in your indicator list under the name that you saved it as.
2) You *favorite* the indicator in TradingView
3) You leave comments in the comments section on the indicators page in TradingView (I really do love hearing comments about anything regarding my indicators(positive or negative..though I haven't gotten any negative yet SO BRING IT ON), even though I don’t get too many of them, so if you are grateful (or hateful) PLEASE message me privately (and really I truly truly do appreciate getting comments/messages so if it has benefited you make sure to message me as I might have more for those that do express their gratitude) and tell me anything that you want to tell me or ask me anything that you wanna ask me there).
One major thing that will help to suppress its popularity will be that if anybody goes back on historical charts to see its accuracy they most likely will not be able to go far back enough on the 1min TF to be able to Witness its efficacy so I'm banking on that helping to keep a lid on things.
The settings used (as well as the TF used) really should not be changed if using it for its intended purpose. On little dumps that last for a few hours os so will produce points somewhere in the 40 to 60 range at the dumps/pumps peak. Each coin is worth one point and there are 40 coins per set and 2 sets (that you will have to link together) and when the under the hood indicator is triggered for that coin it will add a point to the score. With the settings how they are and on the 1min TF(if I hadn't mentioned it yet. lol) a good point alert threshold to use to catch the apex of heavy pumps/dumps would be between 70 to 80 points(80 is max). Ultimately is the users choice to input the alert threshold of points in the indicators settings(default is 72). If you’re trying to nail the very bottom of a hard pump/dump, DO NOT fall for times where it peaks at 50 to 60. You’re looking for 70 or above.
*** This is the most important thing to do as you will not receive an alert if you do not do this correctly. You have to add the indicator two times to the chart. One of the indicators needs to be under “Coin Set 1“ and the other under “Coin Set 2“. Now, in “Set 1“ you need to go to the setting entitled “Select New Beginning Count Plot from drop-down“ and you need to open the drop-down and select the plot entitled “A New Beginning Count Plot”. This will link both the indicators and since there are 40 coins per iteration of the script, when you link them it could give you a max of 80 points total at the very peak of a very strong dump...which will obviously be rare. You CAN use only one copy of the script (but need to change the alert setting to a MAX of 40) but in my experience it's best to use both of them and to link them. It gives you a more well-rounded outcome. Good luck my people and always remember...Much love...Much Love. May the force be with your trades. -ChasinAlts out.
Time█ OVERVIEW
This library is a Pine Script™ programmer’s tool containing a variety of time related functions to calculate or measure time, or format time into string variables.
█ CONCEPTS
`formattedTime()`, `formattedDate()` and `formattedDay()`
Pine Script™, like many other programming languages, uses timestamps in UNIX format, expressed as the number of milliseconds elapsed since 00:00:00 UTC, 1 January 1970. These three functions convert a UNIX timestamp to a formatted string for human consumption.
These are examples of ways you can call the functions, and the ensuing results:
CODE RESULT
formattedTime(timenow) >>> "00:40:35"
formattedTime(timenow, "short") >>> "12:40 AM"
formattedTime(timenow, "full") >>> "12:40:35 AM UTC"
formattedTime(1000 * 60 * 60 * 3.5, "HH:mm") >>> "03:30"
formattedDate(timenow, "short") >>> "4/30/22"
formattedDate(timenow, "medium") >>> "Apr 30, 2022"
formattedDate(timenow, "full") >>> "Saturday, April 30, 2022"
formattedDay(timenow, "E") >>> "Sat"
formattedDay(timenow, "dd.MM.yy") >>> "30.04.22"
formattedDay(timenow, "yyyy.MM.dd G 'at' hh:mm:ss z") >>> "2022.04.30 AD at 12:40:35 UTC"
These functions use str.format() and some of the special formatting codes it allows for. Pine Script™ documentation does not yet contain complete specifications on these codes, but in the meantime you can find some information in the The Java™ Tutorials and in Java documentation of its MessageFormat class . Note that str.format() implements only a subset of the MessageFormat features in Java.
`secondsSince()`
The introduction of varip variables in Pine Script™ has made it possible to track the time for which a condition is true when a script is executing on a realtime bar. One obvious use case that comes to mind is to enable trades to exit only when the exit condition has been true for a period of time, whether that period is shorter that the chart's timeframe, or spans across multiple realtime bars.
For more information on this function and varip please see our Using `varip` variables publication.
`timeFrom( )`
When plotting lines , boxes , and labels one often needs to calculate an offset for past or future end points relative to the time a condition or point occurs in history. Using xloc.bar_index is often the easiest solution, but some situations require the use of xloc.bar_time . We introduce `timeFrom()` to assist in calculating time-based offsets. The function calculates a timestamp using a negative (into the past) or positive (into the future) offset from the current bar's starting or closing time, or from the current time of day. The offset can be expressed in units of chart timeframe, or in seconds, minutes, hours, days, months or years. This function was ported from our Time Offset Calculation Framework .
`formattedNoOfPeriods()` and `secondsToTfString()`
Our final two offerings aim to confront two remaining issues:
How much time is represented in a given timestamp?
How can I produce a "simple string" timeframe usable with request.security() from a timeframe expressed in seconds?
`formattedNoOfPeriods()` converts a time value in ms to a quantity of time units. This is useful for calculating a difference in time between 2 points and converting to a desired number of units of time. If no unit is supplied, the function automatically chooses a unit based on a predetermined time step.
`secondsToTfString()` converts an input time in seconds to a target timeframe string in timeframe.period string format. This is useful for implementing stepped timeframes relative to the chart time, or calculating multiples of a given chart timeframe. Results from this function are in simple form, which means they are useable as `timeframe` arguments in functions like request.security() .
█ NOTES
Although the example code is commented in detail, the size of the library justifies some further explanation as many concepts are demonstrated. Key points are as follows:
• Pivot points are used to draw lines from. `timeFrom( )` calculates the length of the lines in the specified unit of time.
By default the script uses 20 units of the charts timeframe. Example: a 1hr chart has arrows 20 hours in length.
• At the point of the arrows `formattedNoOfPeriods()` calculates the line length in the specified unit of time from the input menu.
If “Use Input Time” is disabled, a unit of time is automatically assigned.
• At each pivot point a label with a formatted date or time is placed with one of the three formatting helper functions to display the time or date the pivot occurred.
• A label on the last bar showcases `secondsSince()` . The label goes through three stages of detection for a timed alert.
If the difference between the high and the open in ticks exceeds the input value, a timer starts and will turn the label red once the input time is exceeded to simulate a time-delayed alert.
• In the bottom right of the screen `secondsToTfString()` posts the chart timeframe in a table. This can be multiplied from the input menu.
Look first. Then leap.
█ FUNCTIONS
formattedTime(timeInMs, format)
Converts a UNIX timestamp (in milliseconds) to a formatted time string.
Parameters:
timeInMs : (series float) Timestamp to be formatted.
format : (series string) Format for the time. Optional. The default value is "HH:mm:ss".
Returns: (string) A string containing the formatted time.
formattedDate(timeInMs, format)
Converts a UNIX timestamp (in milliseconds) to a formatted date string.
Parameters:
timeInMs : (series float) Timestamp to be formatted.
format : (series string) Format for the date. Optional. The default value is "yyyy-MM-dd".
Returns: (string) A string containing the formatted date.
formattedDay(timeInMs, format)
Converts a UNIX timestamp (in milliseconds) to the name of the day of the week.
Parameters:
timeInMs : (series float) Timestamp to be formatted.
format : (series string) Format for the day of the week. Optional. The default value is "EEEE" (complete day name).
Returns: (string) A string containing the day of the week.
secondsSince(cond, resetCond)
The duration in milliseconds that a condition has been true.
Parameters:
cond : (series bool) Condition to time.
resetCond : (series bool) When `true`, the duration resets.
Returns: The duration in seconds for which `cond` is continuously true.
timeFrom(from, qty, units)
Calculates a +/- time offset in variable units from the current bar's time or from the current time.
Parameters:
from : (series string) Starting time from where the offset is calculated: "bar" to start from the bar's starting time, "close" to start from the bar's closing time, "now" to start from the current time.
qty : (series int) The +/- qty of units of offset required. A "series float" can be used but it will be cast to a "series int".
units : (series string) String containing one of the seven allowed time units: "chart" (chart's timeframe), "seconds", "minutes", "hours", "days", "months", "years".
Returns: (int) The resultant time offset `from` the `qty` of time in the specified `units`.
formattedNoOfPeriods(ms, unit)
Converts a time value in ms to a quantity of time units.
Parameters:
ms : (series int) Value of time to be formatted.
unit : (series string) The target unit of time measurement. Options are "seconds", "minutes", "hours", "days", "weeks", "months". If not used one will be automatically assigned.
Returns: (string) A formatted string from the number of `ms` in the specified `unit` of time measurement
secondsToTfString(tfInSeconds, mult)
Convert an input time in seconds to target string TF in `timeframe.period` string format.
Parameters:
tfInSeconds : (simple int) a timeframe in seconds to convert to a string.
mult : (simple float) Multiple of `tfInSeconds` to be calculated. Optional. 1 (no multiplier) is default.
Returns: (string) The `tfInSeconds` in `timeframe.period` format usable with `request.security()`.

Runners & Laggers (scanner)Firstly, seems to me this may only work with crypto but I know nothing about the other sectors so i could be wrong. I was trying to think up a good way to find moving coins(other than by volume bc theres holes in the results when using it this way). Thought this was an interesting concept so decided to publish it as I've seen no others like it (though i did not extensively search for it. We need to start with a little Tradingview(TV) common knowledge. When there is no update of trades/volume in a candle TV does not print the candle. So when looking at (let's say) a 1 second chart, if the coin being observed by the user has no update from a trade in the time of that 1 sec candle it is skipped over. This means that a coin with a ton of volume might fill an entire 60 seconds with 60 candles and conversely with a low volume coin there could be as little as 0 1-second candles. BUT even for normally low volume coins, when a pump is beginning with the coin it could literally go from 0 1-second candles within a minute to 60 1-second candles within the next minute. ***NOTE: This DOES NOT show ANY information if the coin is going up or down but rather that a LOT more trading volume is occurring than normal.*** What this script does is scans (via request.security feature) up to 40 coins at a time and counts how many candles are printed within a user set timespan calculated in minute. 1 candle print per incremented timeframe that the chart is on. ie. if the chart is a 1 min chart it counts how many 1 min candles are printed. So, (as is in the captured image for the script) if you wanted to count how many 5 second candles are printed for each coin in 1 min then you would have to put the charts timeframe on 5sec and the setting titled 'Window of TIME(in minutes) to count bars' as 1.0 (which bc it's in minutes 1.0m = 60sec and bc 60s / 5s = 12 there would be 12 possible values that each coin can be at depending on how many bars are counted within that 1min/60sec. *** I will update to show an image of what I'm talking about here. Now, the exchange I'm scanning here is Kucoin's Margin Coins. There are 170 something coins total but I removed a few i didn't care for to make it a round 40 coins per set (there being 4 sets of 40 coins total=160 coins being scanned). To scan all 4 sets the indicator must be added 4 times to the chart and a different 'set' selected for each iteration of the script on the chart. Free users can only scan 3 at the most. All others can scan all 4 sets. In the script you can change the exchange and coins as necessary. If there done so and there are not 40 coins total just put '' '' in the extra coins spots that are not filled and the script will skip over these blankly filled spots. The suffix (traded pair) for the tickerID on all Kucoin's Margin Coin's is USDT so that's what i have inputted in the main function on line 46 (will need to be changed if that differs from the coins you want to scan. Next in the line of settings is 'Window of TIME(in minutes) to count bars' which has already been discussed. Following that is the setting "Table Shows" which the results are all in a table and the table will present the coins that have either "Passed" or "Failed" depending on which you choose. The next setting determines what passes or fails. If there are 12 possible rows for the coins to be in (as described above) then this setting is the "Pass/Fail Cutoff" level. So if you want to show all the coins that are in rows 11 and 12 (as in the image at top) then 11 should be selected here. At this point you will see all the coins that have a lot of volume in them. Finding coin names in the table that are usually not with a ton of volume will present your present movers. NOTE: coins like BTC and ETH will almost always be in these levels so it does not indicate anything different from the norm of these coins. Last setting is the ability to show the table on the main window or not. Hope you enjoy and find use in it. BTW this screener format is the same as the others I have published. If you like, check those out too. If you find difficulty using then refer to those as well as they have additional info in them on how to use the scanner and its format. Lastly, in the script is the ability to print the plots and labels but I commented them out bc its really just a jumbled mess. In the commented out sections there is a Random Color Function (provided by @hewhomustnotbenamed which was developed on the basis of Function-HSL-color by @RicardoSantos. All right, peace brothers....and sisters.
**** Also, I see how the "levels" could be confusing so I will put them into a % format soon (probably not today) so that the "Pass/Fail Cutoff" can be in % format so that if "passed" is chosen and 50% is chosen (in the new setting that will be changed) then it'll show you all the coins that have more than 50% of the bars printed within the time window chosen. Goodluck in all your trading adventures. ChasinAlts out.

[kai]Futility RatioAn indicator that measures movement inefficiency
Inefficient movement, that is, the range market becomes a high number, the limit is reached at about 60 and a trend occurs
When the range breaks and a trend occurs, the inefficiency drops to about 40 and many trends end.
The full-scale trend goes down further and goes down to about 25, which is evaluated as an efficient movement, the limit is reached and the trend ends.
As for how to use this Inge, the direction of the trend needs to be considered in other ways.
Create a position when you reach 60
Position closed or contrarian at 40 or 25
I assume the usage
動きの非効率性を測定するインジケーターです
非効率な動きをするつまりレンジ相場は高い数字になって、60程度で限界が訪れてトレンドが発生します
レンジがブレイクしトレンドが発生すると40程度まで非効率性は下がりって多くのトレンドは終了します
本格的なトレンドはさらに下がっていって効率的な動きと評価される25程度まで下がって限界が訪れてトレンドが終了します
このインジの使い方はトレンドの方向は他の方法で考える必要がありますが
60まで上がったときにポジション作成
40又は25でポジションクローズ又は逆張り
という使い方を想定しています

Multiple Screeners with AlertsI already published few version of my custom screeners. Unfortunately, because of TradingView's security function call limit you can't use more than 40 stocks in 1 screener.
Fortunately, you can compute multiple values in your function and screen few indicators at once.
In this script I show how you can compute 5 indicators at the same time for 40 instruments. I display then in different labels.
Every label consist of list of instruments satisfying current indicator conditions and a value for it. It can be absolute value as for RSI or -1/1 representing Bullish/Bearish event.
Also you can create 1 alert with result of all screeners inside.
In this example I took 5 indicators with following conditions:
RSI - "RSI < 30" or "RSI > 70"
TSI - "TSI < -30" or "RSI >30"
ADX - "ADX > 40"
MACD - "MACD Bullish Cross" or "MACD Bearish Cross" (1 and -1 in screener)
AO - "AO Crosses 0 UP" or "AO Crosses 0 DOWN" (1 and -1 in screener)
Params
- bars_apart - this parameter define how may bars apart you labels are on your chart. If you see labels overlapping, increase this number.
- Parameters for all used indicators
- 40 symbol inputs for instruments you want to use in this screener
Alerts
You can create an alert from it easily by selecting screener name from the list and then selecting "Any alert() function call".
No additional configuration is required, message and alert on close is generated in the code.
You should better change default name for your alert. Sometimes because of big amount of inputs you might receive an error.
Disclaimer
Please remember that past performance may not be indicative of future results.
Due to various factors, including changing market conditions, the strategy may no longer perform as good as in historical backtesting.
This post and the script don’t provide any financial advice.

RSI_SpeedUp_Volume measures the speed of purchases.If the RSI indicator shows the dominance of purchases over sales, it is interesting to know the speed of purchases. We calculate the speed using the wt indicator. We compute WT (RSI,len). Setting and designation of indicator RSI_SpeedUP. The RSI lines you are looking for are shown in smooth lines. The speed is shown by stepped lines.
In the indicator RSI and speed are calculated in two ways. The first method-calculations are made from the closing price.
The second way is from the volume price. Volume price is the closing price multiplied by volume. Basic settings of the RSI_SpeedUp-V indicator (1,24,9,40,14). What they mean?
RSI is calculated for two periods 24 and 9. The first parameter in the setting is "1", that the display of lines will be from the first period = 24. If the parameter is "2", the lines will be displayed from the second period = 9.
If the parameter is "3", the display will be simultaneously from both periods.
The fourth parameter " 40 " shows the width of the green and pink areas.
The fifth parameter " 14 " is the period with which the wt rate is calculated(rsi,14).
By default, the indicator window displays only the rates from the simple price and the volume price. In order to enable the display of RSI lines, press the "vkl RSI"button.
The blue line is RSI (close). Blue line-RSI (close*volume). Stepped green-speed from simple price wt(rsi (close)). Step brown line-speed from the volume price wt(rsi (close*volume)).
How to use. The volume price starts to react to the trend change earlier. Long before the reversal, it changes its direction. Comparison with the simple price speed line gives additional information about the market mood.
Good luck with your trading.
--------------------------
Если индикатор RSI показывает доминирование покупок над продажами, то интересно знать скорость покупок. Скорость мы вычисляем с помощью индикатора WT. Мы вычисляем WT ( RSI,len). Настройки и обозначения индикатора RSI_SpeedUP. Искомые линии RSI показаны гладкими линиями. Скорость показана ступенчатыми линиями.
В индикаторе RSI и скорость вычисляются двумя способами. Первый способ - вычисления производятся от цены закрытия. Второй способ от объемной цены. Объемная цена это цена закрытия умноженная на объем. Базовые настройки индикатора RSI_SpeedUp-V (1,24,9,40,14). Что они означают?
RSI вычисляется для двух периодов 24 и 9. Первый параметр в настройке "1" , что отображение линий будет от первого периода = 24. Если параметр "2", то отображение линий будет от второго периода = 9. Если параметр "3", то отображение будет одновременно от обоих периодов.
Четвертый параметр "40" показывает ширину области зеленой и розовой.
Пятый параметр "14" это период с которым вычисляется скорость wt(rsi,14).
По умолчанию в окне индикатора отображаются только скорости от простой цены и от объемной цены. Для того чтобы включить отображение линий RSI надо нажать кнопочку "vkl RSI".
Синяя линия - RSI (close). Голубая линия - RSI (close*volume). Ступенчатая зеленая - скорость от простой цены wt(rsi(close)). Ступенчатая коричневая линия - скорость от объемной цены wt(rsi(close*volume)).
Как пользоваться. Объемная цена раньше начинает реагировать на изменение тенденции. Задолго до разворота она изменяет своё направление. Сравнение с линией скорости простой цены дает дополнительную информацию о настроении рынка.
Успехов Вам в торговле.

Aroon Single Line This indicator converts double lined Aroon indicator into a single line oscillator.
It is simply obtained by subtracting Aroon down from Aroon Up.
*If Oscillator points 100 value, it means there is a Strong Uptrend.
*If Oscillator points values between 100 and 40, it means there is an uptrend.
*If Oscillator points values between 20 and -20, it means no trend, it is sideways.But, when it is sideways; generally, oscillator makes FLAT LINES
between 20 and -20 values. 0 value is pointed out when the trend is downward as well, which means aroon up=aroon down.
*If Oscillator points values between -40 and -100, it means there is a downtrend.
*If Oscillator points -100 value, it means there is a Strong downtrend.
(20, 40) and (-20, -40) intervals are not mentioned, because; generally these are transition values and hard to comment, it will be more certain to
wait till values are between or at the reference values given.

15-Min RSI Scalper [SwissAlgo]15-Min RSI Scalper
Tracks RSI Momentum Loss and Gain to Generate Signals
-------------------------------------------------------
WHAT THIS INDICATOR CALCULATES
This indicator attempts to identify RSI directional changes (RSI momentum) using a step-by-step "ladder" method. It reads RSI(14) from the next higher timeframe relative to your chart. On a 15-minute chart, it uses 1-hour RSI. On a 5-minute chart, it uses 15-minute RSI, and so on.
How the ladder logic works:
The indicator doesn't track RSI all the time. It only starts tracking when RSI crosses into potentially extreme territory (these are called "events" in the code):
For sell signals : when RSI crosses above a dynamic upper threshold (typically between 60-80, calculated as the 90th percentile of recent RSI)
For buy signals : when RSI crosses below a dynamic lower threshold (typically between 20-40, calculated as the 10th percentile of recent RSI)
Once tracking begins, RSI movement is divided into 2-point steps (boxes). The indicator counts how many boxes RSI climbs or falls.
A signal generates only when:
RSI reverses direction by at least 2 boxes (4 RSI points) from its extreme
RSI holds that reversal for 3 consecutive confirmed bars
Example: Dynamic threshold is at 68. RSI crosses above 68 → tracking starts. RSI climbs to 76 (4 boxes up). Then it drops back to 72 and stays below that level for 3 bars → sell signal prints. The buy signal works the same way in reverse.
-------------------------------------------------------
SIGNAL GENERATION METHODOLOGY
Sell Signal (Red Triangle)
RSI crosses above a dynamic start level (calculated as the 90th percentile of the last 1000 bars, constrained between 60-80)
Indicator tracks upward progression in 2-point boxes
RSI reverses and drops below a boundary 2 boxes below the highest box reached
RSI remains below that boundary for 3 confirmed bars
Red triangle plots above price
Reset condition: RSI returns below 50
Buy Signal (Green Triangle)
RSI crosses below a dynamic start level (10th percentile of last 1000 bars, constrained between 20-40)
Indicator tracks downward progression in 2-point boxes
RSI reverses and rises above a boundary 2 boxes above the lowest box reached
RSI remains above that boundary for 3 confirmed bars
Green triangle plots below price
Reset condition: RSI returns above 50
-------------------------------------------------------
TECHNICAL PARAMETERS
All parameters are hardcoded:
RSI Period: 14
Box Size: 2 RSI points
Reversal Threshold: 2 boxes (4 RSI points)
Confirmation Period: 3 bars
Reset Level: RSI 50
Sell Start Range: 60-80 (dynamic)
Buy Start Range: 20-40 (dynamic)
Lookback for Percentile: 1000 bars
Note: Since the code is open source, users can modify these hardcoded values directly in the script to adjust sensitivity. For example, increasing the confirmation period from 3 to 5 bars will produce fewer but more conservative signals. Decreasing the box size from 2 to 1 will make the indicator more responsive to smaller RSI movements.
-------------------------------------------------------
KEY FEATURES
Automatic Higher Timeframe RSI
When applied to a 15-minute chart, the indicator automatically reads 1-hour RSI data. This is the next standard timeframe above 15 minutes in the indicator's logic.
Dynamic Adaptive Start Levels
Sell signals use the 90th percentile of RSI over the last 1000 bars, constrained between 60-80. Buy signals use the 10th percentile, constrained between 20-40. These thresholds recalculate on each bar based on recent data.
Ladder Box System
RSI movements are tracked in 2-point boxes. The indicator requires a 2-box reversal followed by 3 consecutive bars maintaining that reversal before generating a signal.
Dual Signal Output
Red down-triangles plot above price when the sell signal conditions are met. Green up-triangles plot below the price when buy signal conditions are met.
-------------------------------------------------------
REPAINTING
This indicator does not repaint. All calculations use "barstate.isconfirmed" to ensure signals appear only on closed bars. The request.security() call uses lookahead=barmerge.lookahead_off to prevent forward-looking bias.
-------------------------------------------------------
INTENDED CHART TIMEFRAME
This indicator is designed for use on 15-minute charts. The visual reminder table at the top of the chart indicates this requirement.
On a 15-minute chart:
RSI data comes from the 1-hour timeframe
Signals reflect 1-hour momentum shifts
3-bar confirmation equals 45 minutes of price action
Using it on other timeframes will change the higher timeframe RSI source and may produce different behavior.
-------------------------------------------------------
WHAT THIS INDICATOR DOES NOT DO
Does not predict future price movements
Does not provide entry or exit advice
Does not guarantee profitable trades
Does not replace comprehensive technical analysis
Does not account for fundamental factors, news events, or market structure
Does not adapt to all market conditions equally
-------------------------------------------------------
EDUCATIONAL USE
This indicator demonstrates one approach to momentum reversal detection using:
Multi-timeframe analysis
Adaptive thresholds via percentile calculation
Step-wise momentum tracking
Multi-bar confirmation logic
It is designed as a technical study, not a trading system. Signals represent calculated conditions based on RSI behavior, not trade recommendations. Always do your own analysis before taking market positions.
-------------------------------------------------------
RISK DISCLOSURE
Trading involves substantial risk of loss. This indicator:
Is for educational and informational purposes only
Does not constitute financial, investment, or trading advice
Should not be used as the sole basis for trading decisions
Has not been tested across all market conditions
May produce false signals, late signals, or no signals in certain conditions
Past performance of any indicator does not predict future results. Users must conduct their own analysis and risk assessment before making trading decisions. Always use proper risk management, including stop losses and position sizing appropriate to your account and risk tolerance.
MIT LICENSE
This code is open source and provided as-is without warranties of any kind. You may use, modify, and distribute it freely under the MIT License.

FirstStrike Long 200 - Daily Trend Rider [KedArc Quant]Strategy Description
FirstStrike Long 200 is a disciplined, long-only momentum strategy designed for daily "strike-first" entries in trending markets. It scans for RSI momentum above a customizable trigger (default 50), confirmed by EMA trend filters, and limits you to *exactly one trade per day* to avoid overtrading. It uses ATR for dynamic risk management (1.5x stop, 2:1 RR target) and optional trailing stops to ride winners. Backtested with realistic commissions and sizing, it prioritizes low drawdowns (<1% max in tests) over aggressive gains—ideal for swing traders seeking quality setups in bull runs.
Why It's Different from Other Strategies
Unlike generic RSI crossover bots or EMA ribbon mashups that spam signals and bleed in chop, FirstStrike enforces a "one-and-done" daily gate, blending precision momentum (RSI modes with grace/sustain) with robust filters (volume, sessions, rearm dips).
How It Helps Traders
- Reduces Emotional Trading: One entry/day forces discipline—miss a setup? Wait for tomorrow. Perfect for busy pros avoiding screen fatigue.
- Adapts to Regimes: Switch modes for trends ("Cross+Grace") vs. ranges ("Any bar")—boosts win rates 5-10% in backtests on high-beta names like .
- Risk-First Design: ATR scales stops to vol capping DD at 0.2% while targeting 2R winners. Trailing option locks +3-5% runs without early exits.
- Quick Insights: Labels/alerts flag entries with RSI values; bgcolor highlights signals for visual scanning. Helps spot "first-strike" edges in uptrends, filtering ~60% noise.
Why This Is Not a Mashup
This isn't a Frankenstein of off-the-shelf indicators—while it uses standard RSI/EMA/ATR (core Pine primitives), the innovation lies in:
- Custom Trigger Engine: Switchable modes (e.g., "Cross+Grace+Sustain" requires post-cross hold) prevent perpetual signals, unlike basic `ta.crossover()`.
- Daily Rearm Gate: Resets eligibility only after a dip (if enabled), tying momentum to mean-reversion—original logic not found in common scripts.
- Per-Day Isolation: `var` vars + `ta.change(time("D"))` ensure zero pyramiding/overlaps, beyond simple session filters.
All formulae are derived in-house for "first-strike" (early RSI pops in trends), not copied from public repos.
Input Configurations
Let's break down every input in the FirstStrike Long 200 strategy. These settings let you tweak the strategy like a dashboard—start with defaults for quick testing,
then adjust based on your asset or timeframe (5m for intraday). They're grouped logically to keep things organized, and most have tooltips in the script for quick reminders.
RSI / Trigger Group: The Heart of Momentum Detection
This is where the magic starts—the strategy hunts for "upward energy" using RSI (Relative Strength Index), a tool that measures if a stock is overbought (too hot) or oversold (too cold) on a 0-100 scale.
- RSI Length: How many bars (candles) back to calculate RSI. Default is 14, like a 14-day window for daily charts. Shorter (e.g., 9) makes it snappier for fast markets; longer (21) smooths out noise but misses quick turns.
- Trigger Level (RSI >= this): The key RSI value where the strategy says, "Go time!" Default 50 means enter when RSI crosses or holds above the neutral midline. Why is this trigger required? It acts as your "green light" filter—without it, you'd enter on every tiny price wiggle, leading to endless losers. RSI above this shows building buyer power, avoiding weak or sideways moves. It's essential for quality over quantity, especially in one-trade-per-day setups.
- Trigger Mode: Picks how strict the RSI signal must be. Options: "Cross only" (exact RSI crossover above trigger—super precise, fewer trades); "Cross+Grace" (crossover or within a grace window after—gives a second chance); "Cross+Grace+Sustain" (crossover/grace plus RSI holding steady for bars—best for steady climbs); "Any bar >= trigger" (looser, any bar above—more opportunities but riskier in chop). Start with "Any bar" for trends, switch to "Cross only" for caution.
- Grace Window (bars after cross): If mode allows, how many bars post-RSI-cross you can still enter if RSI dips but recovers. Default 30 (about 2.5 hours on 5m). Zero means no wiggle room—pure precision.
- Sustain Bars (RSI >= trigger): In sustain mode, how many straight bars RSI must stay above trigger. Default 3 ensures it's not a fluke spike.
- Require RSI Dip Below Rearm Before Any Entry?: A yes/no toggle. If on, the strategy "rearms" only after RSI dips below a low level (like a breather), preventing back-to-back signals in overextended rallies.
- Rearm Level (if requireDip=true): The dip threshold for rearming. Default 45—RSI must go below this to reset eligibility. Lower (30) for deeper pullbacks in volatile stocks.
For the trigger level itself, presets matter a lot—default 50 is neutral and versatile for broad trends. Bump to 55-60 for "strong momentum only" (fewer but higher-win trades, great in bull runs like tech surges); drop to 40-45 for "early bird" catches in recoveries (more signals but watch for fakes in ranges). The optimize hint (40-60) lets you test these in TradingView to match your risk—higher presets cut noise by 20-30% in backtests.
Trend / Filters Group: Keeping You on the Right Side of the Market
These EMAs (Exponential Moving Averages) act like guardrails, ensuring you only long in uptrends.
- EMA (Fast) Confirmation: Short-term EMA for price action. Default 20 periods—price must be above this for "recent strength." Shorter (10) reacts faster to intraday pops.
- EMA (Trend Filter): Long-term EMA for big-picture trend. Default 200 (classic "above the 200-day" rule)—price above it confirms bull market. Minimum 50 to avoid over-smoothing.
Optional Hour Window Group: Timing Your Strikes
Avoid bad hours like lunch lulls or after-hours tricks.
- Restrict by Session?: Yes/no for using exact market hours. Default off.
- Session (e.g., 0930-1600 for NYSE): Time string like "0930-1600" for open to close. Auto-skips pre/post-market noise.
- Restrict by Hour Range?: Fallback yes/no for simple hours. Default off.
- Start Hour / End Hour: Clock times (0-23). Defaults 9-15 ET—focus on peak volume.
Volume Filter Group: No Volume, No Party
Confirms conviction—big moves need big participation.
- Require Volume > SMA?: Yes/no toggle. Default off—only fires on above-average volume.
- Volume SMA Length: Periods for the average. Default 20—compares current bar to recent norm.
Risk / Exits Group: Protecting and Profiting Smartly
Dynamic stops based on volatility (ATR = Average True Range) keep things realistic.
- ATR Length: Bars for ATR calc. Default 14—measures recent "wiggle room" in price.
- ATR Stop Multiplier: How far below entry for stop-loss. Default 1.5x ATR—gives breathing space without huge risk
- Take-Profit R Multiple: Reward target as multiple of risk. Default 2.0 (2:1 ratio)—aims for twice your stop distance.
- Use Trailing Stop?: Yes/no for profit-locking trail. Default off—activates after entry.
- Trailing ATR Multiplier: Trail distance. Default 2.0x ATR—looser than initial stop to let winners run.
These inputs make the strategy plug-and-play: Defaults work out-of-box for trending stocks, but tweak RSI trigger/modes first for your style.
Always backtest changes—small shifts can flip a 40% win rate to 50%+!
Outputs (Visuals & Alerts):
- Plots: Blue EMA200 (trend line), Orange EMA20 (price filter), Green dashed entry price.
- Labels: Green "LONG" arrow with RSI value on entries.
- Background: Light green highlight on signal bars.
- Alerts: "FirstStrike Long Entry" fires on conditions (integrates with TradingView notifications).
Entry-Exit Logic
Entry (Long Only, One Per Day):
1. Daily Reset: New day clears trade gate and (if required) rearm status.
2. Filters Pass: Time/session OK + Close > EMA200 (trend) + Close > EMA20 (price) + Volume > SMA (if enabled) + Rearmed (dip below rearm if toggled).
3. Trigger Fires: RSI >= trigger via selected mode (e.g., crossover + grace window).
4. Execute: Enter long at close; set daily flag to block repeats.
Exit:
- Stop-Loss: Entry - (ATR * 1.5) – dynamic, vol-scaled.
- Take-Profit: Entry + (Risk * 2.0) – fixed RR.
- Trailing (Optional): Activates post-entry; trails at Close - (ATR * 2.0), updating on each bar for trend extension.
No shorts or hedging—pure long bias.
Formulae Used
- RSI: `ta.rsi(close, rsiLen)` – Standard 14-period momentum oscillator (0-100).
- EMAs: `ta.ema(close, len)` – Exponential moving averages for trend/price filters.
- ATR: `ta.atr(atrLen)` – True range average for stop sizing: Stop = Entry - (ATR * mult).
- Volume SMA: `ta.sma(volume, volLen)` – Simple average for relative strength filter.
- Grace Window: `bar_index - lastCrossBarIndex <= graceBars` – Counts bars since RSI crossover.
- Sustain: `ta.barssince(rsi < trigger) >= sustainBars` – Consecutive bars above threshold.
- Session Check: `time(timeframe.period, sessionStr) != 0` – TradingView's built-in session validator.
- Risk Distance: `riskPS = entry - stop; TP = entry + (riskPS * RR)` – Asymmetric reward calc.
FAQ
Q: Why only one trade/day?
A: Prevents revenge trading in volatile sessions . Backtests show it cuts losers by 20-30% vs. multi-entry bots.
Q: Does it work on all assets/timeframes?
A: Best for trending stocks/indices on 5m-1H. Test on crypto/forex with wider ATR mult (2.0+).
Q: How to optimize?
A: Use TradingView's optimizer on RSI trigger (40-60) and EMA fast (10-30). Aim for PF >1.0 over 1Y data.
Q: Alerts don't fire—why?
A: Ensure `alertcondition` is enabled in script settings. Test with "Any alert() function calls only."
Q: Trailing stop too loose?
A: Tune `trailMult` to 1.5 for tighter; it activates alongside fixed TP/SL for hybrid protection.
Glossary
- Grace Window: Post-RSI-cross period (bars) where entry still allowed if RSI holds trigger.
- Rearm Dip: Optional pullback below a low RSI level (e.g., 45) to "reset" eligibility after signals.
- Profit Factor (PF): Gross profit / gross loss—>1.0 means winners outweigh losers.
- R Multiple: Risk units (e.g., 2R = 2x stop distance as target).
- Sustain Bars: Consecutive bars RSI stays >= trigger for mode confirmation.
Recommendations
- Backtest First: Run on your symbols (/) over 6-12M; tweak RSI to 55 for +5% win rate.
- Live Use: Start paper trading with `useSession=true` and `useVol=true` to filter noise.
- Pairs Well With: Higher TF (daily) for bias; add ADX (>25) filter for strong trends (code snippet in prior chats).
- Risk Note: 10% sizing suits $100k+ accounts; scale down for smaller. Not financial advice—past performance ≠ future.
- Publish Tip: Add tags like "momentum," "RSI," "long-only" on TradingView for visibility.
Strategy Properties & Backtesting Setup
FirstStrike Long 200 is configured with conservative, realistic backtesting parameters to ensure reliable performance simulations. These settings prioritize capital preservation and transparency, making it suitable for both novice and experienced traders testing on stocks.
Initial Capital
$100,000 Standard starting equity for portfolio-level testing; scales well for retail accounts. Adjust lower (e.g., $10k) for smaller simulations.
Base Currency
Default (USD) Aligns with most US equities (e.g., NASDAQ symbols); auto-converts for other assets.
Order Size
1 (Quantity) Fixed share contracts for simplicity—e.g., buys 1 share per trade. For % of equity, switch to "Percent of Equity" in strategy code.
Pyramiding
0 Orders No additional entries on open positions; enforces strict one-trade-per-day discipline to avoid overexposure.
Commission
0.1% Realistic broker fee (e.g., Interactive Brokers tier); factors in round-trip costs without over-penalizing winners.
Verify Price for Limit Orders
0 Ticks No slippage delay on TPs—assumes ideal fills for historical accuracy.
Slippage
0 Ticks Zero assumed slippage for clean backtests; real-world trading may add 1-2 ticks on volatile opens.
These defaults yield low drawdowns (<0.3% max in tests) while capturing trend edges. For live trading, enable slippage (1-3 ticks) to mimic execution gaps. Always forward-test before deploying!
⚠️ Disclaimer
This script is provided for educational purposes only.
Past performance does not guarantee future results.
Trading involves risk, and users should exercise caution and use proper risk management when applying this strategy.

Confluence Engine Confluence Engine is a practical, non-repainting decision aid that scores market conditions from −100…+100 by combining six proven modules: Trend, Momentum, Volatility, Volume, Structure, and an HTF confirmation. It’s designed for crypto, forex, indices, and stocks, and it fires entries only on confirmed bar closes.
What’s inside
Trend: EMA 20/50/200 alignment plus a Supertrend/KAMA toggle (you choose the baseline).
Momentum: RSI + MACD with confirmed-pivot divergence detection.
Volatility: ATR% and Bollinger Band width vs its average to favor expansion over chop.
Volume: OBV-style cumulative flow slope + volume surge vs SMA×multiplier.
Market Structure: Confirmed pivots, BOS (break of structure) and CHOCH (change of character).
HTF Filter: Closed higher-timeframe context via request.security(..., barmerge.gaps_on, barmerge.lookahead_off).
Why it does not repaint
Signals are computed and plotted on closed bars only.
Pivots/divergences use confirmed pivot points (no forward look).
HTF series are fetched with lookahead_off and use the last closed HTF bar in realtime.
No future bar references are used for entries or alerts.
How to use (3 steps)
Pick a timeframe pair: use a 4–6× HTF multiplier (5m→30m, 15m→1h, 1h→4h, 4h→1D, 1D→1W).
Trade with the HTF: take longs only when the HTF filter is bullish; shorts only when bearish.
Prefer expansion: act when BB width > its average and ATR% is elevated; skip most signals in compression.
Suggested presets (start here)
Crypto (BTC/ETH): 15m→1h, 1h→4h. stLen=10, stMult=3.0, bbLen=20, surgeMul=1.8–2.2, thresholds +40 / −40 (intraday can try +35 / −35).
Forex majors: 15m→1h, 1h→4h. stLen=10–14, stMult=2.5–3.0, surgeMul=1.5–1.8, thresholds +35 / −35 (swing: +45 / −45).
US equities (liquid): 5m→30m/1h, 15m→1h/2h. stMult=3.0–3.5, surgeMul=1.6–2.0, thresholds +45 / −45 to reduce chop.
Indices (ES/NQ): 5m→30m, 15m→1h. Defaults are fine; start at +40 / −40.
Gold/Oil: 15m→1h, 1h→4h. Thresholds +35 / −35, surgeMul=1.6–1.9.
Inputs (plain English)
Use Supertrend (off = KAMA): choose the trend baseline.
EMA Fast/Mid/Slow: 20/50/200 by default for classic stack.
RSI/MACD + divergence pivots: momentum and exhaustion context.
ATR Length & BB Length: volatility regime detection.
Volume SMA & Surge Multiplier: defines “meaningful” volume spikes.
Pivot left/right & “Confirm BOS/CHOCH on Close”: structure strictness.
Enable HTF & Higher Timeframe: confirms the lower timeframe direction.
Thresholds (+long / −short): when the score crosses these, you get signals.
Signals & alerts (IDs preserved)
Entry shapes plot at bar close when the score crosses thresholds.
Alerts you can enable:
CONFLUENCE LONG — long entry signal
CONFLUENCE SHORT — short entry signal
BULLISH BIAS — score turned positive
BEARISH BIAS — score turned negative
Best practices
Focus on signals with HTF agreement and volatility expansion; require volume participation (surge or rising OBV slope) for higher quality.
Raise thresholds (+45/−45 or +50/−50) to reduce whipsaws in choppy sessions.
Lower thresholds (+35/−35) only if you also require volatility/volume filters.
Performance & scope
Works across crypto/FX/equities/indices; no broker data or special feeds required.
No repainting by design; signals/alerts are computed on closed bars.
As with any tool, results vary by regime; always combine with risk management.
Disclosure
This script is for educational purposes only and is not financial advice. Trading involves risk. Test on historical data and paper trade before using live.

ADX MTF mura visionOverview
ADX MTF — mura vision measures trend strength and visualizes a higher-timeframe (HTF) ADX on any chart. The current-TF ADX is drawn as a line; the HTF ADX is rendered as “step” segments to reflect closed HTF bars without repainting. Optional soft fills highlight the 20–25 (trend forming) and 40–50 (strong trend) zones.
How it works
ADX (current TF) : Classic Wilder formulation using DI components and RMA smoothing.
HTF ADX : Requested via request.security(..., lookahead_off, gaps_off).
When a new HTF bar opens, the previous value is frozen as a horizontal segment.
The current HTF bar is shown as a live moving segment.
This staircase look is expected on lower timeframes.
Auto timeframe mapping
If “Auto” is selected, the HTF is derived from the chart TF:
<30m → 60m, 30–<240m → 240m, 240m–<1D → 1D, 1D → 1W, 1W/2W → 1M, ≥1M → same.
Inputs
DI Length and ADX Smoothing — core ADX parameters.
Higher Time Frame — Auto or a fixed TF.
Line colors/widths for current ADX and HTF ADX.
Fill zone 20–25 and Fill zone 40–50 — optional light background fills.
Number of HTF ADX Bars — limits stored HTF segments to control chart load.
Reading the indicator
ADX < 20: typically range-bound conditions; trend setups require extra caution.
20–25: trend emergence; breakouts and continuation structures gain validity.
40–50: strong trend; favor continuation and manage with trailing stops.
>60 and turning down: possible trend exhaustion or transition toward range.
Note: ADX measures strength, not direction. Combine with your directional filter (e.g., price vs. MA, +DI/−DI, structure/levels).
Non-repainting behavior
HTF values use lookahead_off; closed HTF bars are never revised.
The only moving piece is the live segment for the current HTF bar.
Best practices
Use HTF ADX as a regime filter; time entries with the current-TF ADX rising through your threshold.
Pair with ATR-based stops and a MA/structure filter for direction.
Consider higher thresholds on highly volatile altcoins.
Performance notes
The script draws line segments for HTF bars. If your chart becomes heavy, reduce “Number of HTF ADX Bars.”
Disclaimer
This script is for educational purposes only and does not constitute financial advice. Trading involves risk.

Martingale Strategy Simulator [BackQuant]Martingale Strategy Simulator
Purpose
This indicator lets you study how a martingale-style position sizing rule interacts with a simple long or short trading signal. It computes an equity curve from bar-to-bar returns, adapts position size after losing streaks, caps exposure at a user limit, and summarizes risk with portfolio metrics. An optional Monte Carlo module projects possible future equity paths from your realized daily returns.
What a martingale is
A martingale sizing rule increases stake after losses and resets after a win. In its classical form from gambling, you double the bet after each loss so that a single win recovers all prior losses plus one unit of profit. In markets there is no fixed “even-money” payout and returns are multiplicative, so an exact recovery guarantee does not exist. The core idea is unchanged:
Lose one leg → increase next position size
Lose again → increase again
Win → reset to the base size
The expectation of your strategy still depends on the signal’s edge. Sizing does not create positive expectancy on its own. A martingale raises variance and tail risk by concentrating more capital as a losing streak develops.
What it plots
Equity – simulated portfolio equity including compounding
Buy & Hold – equity from holding the chart symbol for context
Optional helpers – last trade outcome, current streak length, current allocation fraction
Optional diagnostics – daily portfolio return, rolling drawdown, metrics table
Optional Monte Carlo probability cone – p5, p16, p50, p84, p95 aggregate bands
Model assumptions
Bar-close execution with no slippage or commissions
Shorting allowed and frictionless
No margin interest, borrow fees, or position limits
No intrabar moves or gaps within a bar (returns are close-to-close)
Sizing applies to equity fraction only and is capped by your setting
All results are hypothetical and for education only.
How the simulator applies it
1) Directional signal
You pick a simple directional rule that produces +1 for long or −1 for short each bar. Options include 100 HMA slope, RSI above or below 50, EMA or SMA crosses, CCI and other oscillators, ATR move, BB basis, and more. The stance is evaluated bar by bar. When the stance flips, the current trade ends and the next one starts.
2) Sizing after losses and wins
Position size is a fraction of equity:
Initial allocation – the starting fraction, for example 0.15 means 15 percent of equity
Increase after loss – multiply the next allocation by your factor after a losing leg, for example 2.00 to double
Reset after win – return to the initial allocation
Max allocation cap – hard ceiling to prevent runaway growth
At a high level the size after k consecutive losses is
alloc(k) = min( cap , base × factor^k ) .
In practice the simulator changes size only when a leg ends and its PnL is known.
3) Equity update
Let r_t = close_t / close_{t-1} − 1 be the symbol’s bar return, d_{t−1} ∈ {+1, −1} the prior bar stance, and a_{t−1} the prior bar allocation fraction. The simulator compounds:
eq_t = eq_{t−1} × (1 + a_{t−1} × d_{t−1} × r_t) .
This is bar-based and avoids intrabar lookahead. Costs, slippage, and borrowing costs are not modeled.
Why traders experiment with martingale sizing
Mean-reversion contexts – if the signal often snaps back after a string of losses, adding size near the tail of a move can pull the average entry closer to the turn
Behavioral or microstructure edges – some rules have modest edge but frequent small whipsaws; size escalation may shorten time-to-recovery when the edge manifests
Exploration and stress testing – studying the relationship between streaks, caps, and drawdowns is instructive even if you do not deploy martingale sizing live
Why martingale is dangerous
Martingale concentrates capital when the strategy is performing worst. The main risks are structural, not cosmetic:
Loss streaks are inevitable – even with a 55 percent win rate you should expect multi-loss runs. The probability of at least one k-loss streak in N trades rises quickly with N.
Size explodes geometrically – with factor 2.0 and base 10 percent, the sequence is 10, 20, 40, 80, 100 (capped) after five losses. Without a strict cap, required size becomes infeasible.
No fixed payout – in gambling, one win at even odds resets PnL. In markets, there is no guaranteed bounce nor fixed profit multiple. Trends can extend and gaps can skip levels.
Correlation of losses – losses cluster in trends and in volatility bursts. A martingale tends to be largest just when volatility is highest.
Margin and liquidity constraints – leverage limits, margin calls, position limits, and widening spreads can force liquidation before a mean reversion occurs.
Fat tails and regime shifts – assumptions of independent, Gaussian returns can understate tail risk. Structural breaks can keep the signal wrong for much longer than expected.
The simulator exposes these dynamics in the equity curve, Max Drawdown, VaR and CVaR, and via Monte Carlo sketches of forward uncertainty.
Interpreting losing streaks with numbers
A rough intuition: if your per-trade win probability is p and loss probability is q=1−p , the chance of a specific run of k consecutive losses is q^k . Over many trades, the chance that at least one k-loss run occurs grows with the number of opportunities. As a sanity check:
If p=0.55 , then q=0.45 . A 6-loss run has probability q^6 ≈ 0.008 on any six-trade window. Across hundreds of trades, a 6 to 8-loss run is not rare.
If your size factor is 1.5 and your base is 10 percent, after 8 losses the requested size is 10% × 1.5^8 ≈ 25.6% . With factor 2.0 it would try to be 10% × 2^8 = 256% but your cap will stop it. The equity curve will still wear the compounded drawdown from the sequence that led to the cap.
This is why the cap setting is central. It does not remove tail risk, but it prevents the sizing rule from demanding impossible positions
Note: The p and q math is illustrative. In live data the win rate and distribution can drift over time, so real streaks can be longer or shorter than the simple q^k intuition suggests..
Using the simulator productively
Parameter studies
Start with conservative settings. Increase one element at a time and watch how the equity, Max Drawdown, and CVaR respond.
Initial allocation – lower base reduces volatility and drawdowns across the board
Increase factor – set modestly above 1.0 if you want the effect at all; doubling is aggressive
Max cap – the most important brake; many users keep it between 20 and 50 percent
Signal selection
Keep sizing fixed and rotate signals to see how streak patterns differ. Trend-following signals tend to produce long wrong-way streaks in choppy ranges. Mean-reversion signals do the opposite. Martingale sizing interacts very differently with each.
Diagnostics to watch
Use the built-in metrics to quantify risk:
Max Drawdown – worst peak-to-trough equity loss
Sharpe and Sortino – volatility and downside-adjusted return
VaR 95 percent and CVaR – tail risk measures from the realized distribution
Alpha and Beta – relationship to your chosen benchmark
If you would like to check out the original performance metrics script with multiple assets with a better explanation on all metrics please see
Monte Carlo exploration
When enabled, the forecast draws many synthetic paths from your realized daily returns:
Choose a horizon and a number of runs
Review the bands: p5 to p95 for a wide risk envelope; p16 to p84 for a narrower range; p50 as the median path
Use the table to read the expected return over the horizon and the tail outcomes
Remember it is a sketch based on your recent distribution, not a predictor
Concrete examples
Example A: Modest martingale
Base 10 percent, factor 1.25, cap 40 percent, RSI>50 signal. You will see small escalations on 2 to 4 loss runs and frequent resets. The equity curve usually remains smooth unless the signal enters a prolonged wrong-way regime. Max DD may rise moderately versus fixed sizing.
Example B: Aggressive martingale
Base 15 percent, factor 2.0, cap 60 percent, EMA cross signal. The curve can look stellar during favorable regimes, then a single extended streak pushes allocation to the cap, and a few more losses drive deep drawdown. CVaR and Max DD jump sharply. This is a textbook case of high tail risk.
Strengths
Bar-by-bar, transparent computation of equity from stance and size
Explicit handling of wins, losses, streaks, and caps
Portable signal inputs so you can A–B test ideas quickly
Risk diagnostics and forward uncertainty visualization in one place
Example, Rolling Max Drawdown
Limitations and important notes
Martingale sizing can escalate drawdowns rapidly. The cap limits position size but not the possibility of extended adverse runs.
No commissions, slippage, margin interest, borrow costs, or liquidity limits are modeled.
Signals are evaluated on closes. Real execution and fills will differ.
Monte Carlo assumes independent draws from your recent return distribution. Markets often have serial correlation, fat tails, and regime changes.
All results are hypothetical. Use this as an educational tool, not a production risk engine.
Practical tips
Prefer gentle factors such as 1.1 to 1.3. Doubling is usually excessive outside of toy examples.
Keep a strict cap. Many users cap between 20 and 40 percent of equity per leg.
Stress test with different start dates and subperiods. Long flat or trending regimes are where martingale weaknesses appear.
Compare to an anti-martingale (increase after wins, cut after losses) to understand the other side of the trade-off.
If you deploy sizing live, add external guardrails such as a daily loss cut, volatility filters, and a global max drawdown stop.
Settings recap
Backtest start date and initial capital
Initial allocation, increase-after-loss factor, max allocation cap
Signal source selector
Trading days per year and risk-free rate
Benchmark symbol for Alpha and Beta
UI toggles for equity, buy and hold, labels, metrics, PnL, and drawdown
Monte Carlo controls for enable, runs, horizon, and result table
Final thoughts
A martingale is not a free lunch. It is a way to tilt capital allocation toward losing streaks. If the signal has a real edge and mean reversion is common, careful and capped escalation can reduce time-to-recovery. If the signal lacks edge or regimes shift, the same rule can magnify losses at the worst possible moment. This simulator makes those trade-offs visible so you can calibrate parameters, understand tail risk, and decide whether the approach belongs anywhere in your research workflow.

Top Crypto Above 28-Day AverageDescription
The “Top Crypto Above 28-Day Average” (CRYPTOTW) script scans a selectable universe of up to 120 top-capitalization cryptocurrencies (divided into customizable 40-symbol batches), then plots the count of those trading above their own 28-period simple moving average. It helps you gauge broad market strength and identify which tokens are showing momentum relative to their recent trend.
Key Features
• Batch Selection: Choose among “Top40,” “Mid40,” or “Low40” market-cap groups, or set a custom batch size (up to 40 symbols) to keep within the API limit.
• Dynamic Plot: Displays a live line chart of how many cryptos are above their 28-day MA on each bar.
• Reference Lines: Automatic horizontal lines at 25%, 50%, and 75% of your batch to provide quick visual thresholds.
• Background Coloration: The chart background shifts green/yellow/red based on whether more than 70%, 50–70%, or under 50% of the batch is above the MA.
• Optional Table: On the final bar, show a sortable table of up to 28 tickers currently above their 28-day MA, including current price, percent above MA, and “Above” status color-coding.
• Alerts:
• Strong Batch Performance: Fires when >70% of the batch is above the MA.
• Weak Batch Performance: Fires when <10 cryptos (i.e. <25%) are above the MA.
Inputs
• Show Results Table (show_table): Toggle the detailed table on/off.
• Table Position (table_position): Select one of the four corners for your table overlay.
• Max Cryptos to Display (max_display): Limit the number of rows in the results table.
• Current Batch (current_batch): Pick “Top40,” “Mid40,” or “Low40.”
• Batch Size (batch_size): Define the number of symbols (1–40) you want to include from the chosen batch.
How to Use
1. Add the CRYPTOTW indicator to any chart.
2. Select your batch and size to focus on the segment of the crypto market you follow.
3. Watch the plotted line to see the proportion of tokens with bullish momentum.
4. (Optional) Enable the results table to see exactly which tokens are outperforming their 28-day average.
5. Set alerts to be notified when the batch either overheats (strong performance) or cools off significantly.
Why It Matters
By tracking the share of assets riding their 28-day trend, you gain a macro-level view of market breadth—crucial for spotting emerging rallies or early signs of broad weakness. Whether you’re swing-trading individual altcoins or assessing overall market mood, this tool distills complex data into an intuitive, actionable signal.

Momentum Trail Oscillator [AlgoAlpha]🟠 OVERVIEW
This script builds a Momentum Trail Oscillator designed to measure directional momentum strength and dynamically track shifts in trend bias using a combination of smoothed price change calculations and adaptive trailing bands. The oscillator aims to help traders visualize when momentum is expanding or contracting and to identify transitions between bullish and bearish conditions.
🟠 CONCEPTS
The core idea combines two methods. First, the script calculates a normalized momentum measure by smoothing price changes relative to their absolute values, which creates a bounded oscillator that highlights whether moves are directional or choppy. Second, it uses a trailing band mechanism inspired by volatility stops, where bands adapt to the oscillator’s volatility, adjusting the thresholds that define a shift in directional bias. This dual approach seeks to address both the magnitude and persistence of momentum, reducing false signals in ranging markets.
🟠 FEATURES
The momentum calculation applies Hull Moving Averages and double EMA smoothing to price changes, producing a smooth, responsive oscillator.
The trailing bands are derived by offsetting a weighted moving average of the oscillator by a multiple of recent momentum volatility. A directional state variable tracks whether the oscillator is above or below the bands, updating when the momentum crosses these dynamic thresholds.
Overbought and oversold zones are visually marked between fixed levels (+30/+40 and -30/-40), with color fills to highlight when momentum is in extreme areas. The script plots signals on both the oscillator pane and optionally overlays markers on the main price chart for clarity.
🟠 USAGE
To use the indicator, apply it to any symbol and timeframe. The “Oscillator Length” controls how sensitive the momentum line is to recent price changes—lower values react faster, higher values smooth out noise. The “Trail Multiplier” sets how far the adaptive bands sit from the oscillator mid-line, which affects how often trend state changes occur. When the momentum line rises into the upper filled area and then crosses back below +40, it signals potential overbought exhaustion. The opposite applies for the oversold zone below -40. The plotted trailing bands switch visibility depending on the current directional state: when momentum is trending up, the lower band acts as the active trailing stop, and when trending down, the upper band becomes active. Trend changes are marked with circular symbols when the direction variable flips, and optional overlay arrows appear on the price chart to highlight overbought or oversold reversals. Traders can combine these signals with their own price action or volume analysis to confirm entries or exits.

Market Matrix ViewThis technical indicator is designed to provide traders with a quick and integrated view of market dynamics by combining several popular indicators into a single tool. It's not a magic bullet, but a practical aid for analyzing buying/selling pressure, trends, volume, and divergences, saving you time in the decision-making process. Built for flexibility, the indicator adapts to various trading styles (scalping, swing, or long-term) and offers customizable settings to suit your needs.
🟡 Multi-Timeframe Trends
➤ This section displays the trend direction (bullish, bearish, or neutral) across 15-minute, 1-hour, 4-hour, and Daily timeframes, providing multi-timeframe market context. Timeframes lower than the one currently selected will show "N/A."
➤It utilizes fast and slow Exponential Moving Averages (EMAs) for each timeframe:
15m: Fast EMA 42, Slow EMA 170
1h: Fast EMA 40, Slow EMA 100
4h: Fast EMA 36, Slow EMA 107
Daily: Fast EMA 20, Slow EMA 60
🟡 Smart Flow & RVOL
➤ This section displays "Buying Pressure" or "Selling Pressure" signals based on indicator confluence, alongside volume activity ("High Activity," "Normal Activity," or "Low Activity").
➤ Smart Flow combines Chaikin Money Flow (CMF) and Money Flow Index (MFI) to detect buying/selling pressure. CMF measures money flow based on price position within the high-low range, while MFI analyzes money flow considering typical price and volume. A signal is generated only when both indicators simultaneously increase/decrease beyond an adjustable threshold ("Buy/Sell Sensitivity") and volume exceeds a Simple Moving Average (SMA) scaled by the "Volume Multiplier."
➤ RVOL (Relative Volume) calculates relative volume separately for bullish and bearish candles, comparing recent volume (fast SMA) with a reference volume (slow SMA). Thresholds are adjusted based on the selected mode.
🟡 ADX & RSI
This section displays trend strength ("Strong," "Moderate," or "Weak"), its direction ("Bullish" or "Bearish"), and the RSI momentum status ("Overbought," "Oversold," "Buy/Sell Momentum," or "Neutral").
➤ ADX (Average Directional Index) measures trend strength (above 40 = "Strong," 20–40 = "Moderate," below 20 = "Weak"). Direction is determined by comparing +DI (upward movement) with -DI (downward movement). Additionally, an arrow indicates whether the trend's strength is decreasing or increasing.
➤RSI (Relative Strength Index) evaluates price momentum. Extreme levels (above 80/85 = "Overbought," below 15/20 = "Oversold") and intermediate zones (47–53 = "Neutral," above 53 = "Buy Momentum," below 47 = "Sell Momentum") are adjusted based on the selected mode.
🟡 When these signals are active for a potential trade setup, the table's background lights up green or red, respectively.
🟡 Volume Spikes
➤This feature highlights bars with significantly higher volume than the recent average, coloring them yellow on the chart to draw attention to intense market activity.
➤It uses the Z-Score method to detect volume anomalies. Current volume is compared to a 10-bar Simple Moving Average (SMA) and the standard deviation of volume over the same period. If the Z-Score exceeds a certain threshold, the bar is marked as a volume spike.
🟡 Divergences (Volume Divergence Detection)
➤ This feature marks divergences between price and technical indicators on the chart, using diamond-shaped labels (green for bullish divergences, red for bearish divergences) to signal potential trend reversals.
➤ It compares price deviations from a Simple Moving Average (SMA) with deviations of three indicators: Chaikin Money Flow (CMF), Money Flow Index (MFI), and On-Balance Volume (OBV). A bullish divergence occurs when price falls below its average, but CMF, MFI, and OBV rise above their averages, indicating hidden accumulation. A bearish divergence occurs when price rises above its average, but CMF, MFI, and OBV fall, suggesting distribution. The length of the moving averages is adjustable (default 13/10/5 bars for Scalping/Balanced/Swing), and detection thresholds are scaled by "Divergence Sensitivity" (default 1.0).
🟡 Adaptive Stop-Loss (ATR)
➤Draws dynamic stop-loss lines (red, dashed) on the chart for buy or sell signals, helping traders manage risk.Uses the Average True Range (ATR) to calculate stop-loss levels, set at low/high ± ATR × multiplier
🟡 Alerts for trend direction changes in the Info Panel:
➤ Triggers notifications when the trend shifts to Bullish (when +DI crosses above -DI) or Bearish (when +DI crosses below -DI), helping you stay informed about key market shifts.
How to use: Set alerts in Trading View for “Trend Changed to Bullish” or “Trend Changed to Bearish” with “Once Per Bar Close” for reliable signals.
🟡 Settings (Inputs)
➤ The indicator offers customizable settings to fit your trading style, but it's already optimized for Scalping (1m–15m), Balanced (16m–3h59m), and Swing (4h–Daily) modes, which automatically adjust based on the selected timeframe. The visible inputs allow you to adjust the following parameters:
Show Info Panel: Enables/disables the information panel (default: enabled).
Show Volume Spikes: Turns on/off coloring for volume spike bars (default: enabled).
Spike Sensitivity: Controls the Z-Score threshold for detecting volume spikes (default: 2.0; lower values increase signal frequency).
Show Divergence: Enables/disables the display of divergence labels (default: enabled).
Divergence Sensitivity: Adjusts the thresholds for divergence detection (default: 1.0; higher values reduce sensitivity).
Divergence Lookback Length: Sets the length of the moving averages used for divergences (default: 5, automatically adjusted to 13/10/5 for Scalping/Balanced/Swing).
RVOL Reference Period: Defines the reference period for relative volume (default: 20, automatically adjusted to 7/15/20).
RSI Length: Sets the RSI length (default: 14, automatically adjusted to 5/10/14).
Buy Sensitivity: Controls the increase threshold for Buying Pressure signals (default: 0.007; higher values reduce frequency).
Sell Sensitivity: Controls the decrease threshold for Selling Pressure signals (default: 0.007; higher values reduce frequency).
Volume Multiplier (B/S Pressure): Adjusts the volume threshold for Smart Flow signals (default: 0.6; higher values require greater volume).
🟡 This indicator is created to simplify market analysis, but I am not a professional in Pine Script or technical indicators. This indicator is not a standalone solution. For optimal results, it must be integrated into a well-defined trading strategy that includes risk management and other confirmations.

Langlands-Operadic Möbius Vortex (LOMV)Langlands-Operadic Möbius Vortex (LOMV)
Where Pure Mathematics Meets Market Reality
A Revolutionary Synthesis of Number Theory, Category Theory, and Market Dynamics
🎓 THEORETICAL FOUNDATION
The Langlands-Operadic Möbius Vortex represents a groundbreaking fusion of three profound mathematical frameworks that have never before been combined for market analysis:
The Langlands Program: Harmonic Analysis in Markets
Developed by Robert Langlands (Fields Medal recipient), the Langlands Program creates bridges between number theory, algebraic geometry, and harmonic analysis. In our indicator:
L-Function Implementation:
- Utilizes the Möbius function μ(n) for weighted price analysis
- Applies Riemann zeta function convergence principles
- Calculates quantum harmonic resonance between -2 and +2
- Measures deep mathematical patterns invisible to traditional analysis
The L-Function core calculation employs:
L_sum = Σ(return_val × μ(n) × n^(-s))
Where s is the critical strip parameter (0.5-2.5), controlling mathematical precision and signal smoothness.
Operadic Composition Theory: Multi-Strategy Democracy
Category theory and operads provide the mathematical framework for composing multiple trading strategies into a unified signal. This isn't simple averaging - it's mathematical composition using:
Strategy Composition Arity (2-5 strategies):
- Momentum analysis via RSI transformation
- Mean reversion through Bollinger Band mathematics
- Order Flow Polarity Index (revolutionary T3-smoothed volume analysis)
- Trend detection using Directional Movement
- Higher timeframe momentum confirmation
Agreement Threshold System: Democratic voting where strategies must reach consensus before signal generation. This prevents false signals during market uncertainty.
Möbius Function: Number Theory in Action
The Möbius function μ(n) forms the mathematical backbone:
- μ(n) = 1 if n is a square-free positive integer with even number of prime factors
- μ(n) = -1 if n is a square-free positive integer with odd number of prime factors
- μ(n) = 0 if n has a squared prime factor
This creates oscillating weights that reveal hidden market periodicities and harmonic structures.
🔧 COMPREHENSIVE INPUT SYSTEM
Langlands Program Parameters
Modular Level N (5-50, default 30):
Primary lookback for quantum harmonic analysis. Optimized by timeframe:
- Scalping (1-5min): 15-25
- Day Trading (15min-1H): 25-35
- Swing Trading (4H-1D): 35-50
- Asset-specific: Crypto 15-25, Stocks 30-40, Forex 35-45
L-Function Critical Strip (0.5-2.5, default 1.5):
Controls Riemann zeta convergence precision:
- Higher values: More stable, smoother signals
- Lower values: More reactive, catches quick moves
- High frequency: 0.8-1.2, Medium: 1.3-1.7, Low: 1.8-2.3
Frobenius Trace Period (5-50, default 21):
Galois representation lookback for price-volume correlation:
- Measures harmonic relationships in market flows
- Scalping: 8-15, Day Trading: 18-25, Swing: 25-40
HTF Multi-Scale Analysis:
Higher timeframe context prevents trading against major trends:
- Provides market bias and filters signals
- Improves win rates by 15-25% through trend alignment
Operadic Composition Parameters
Strategy Composition Arity (2-5, default 4):
Number of algorithms composed for final signal:
- Conservative: 4-5 strategies (higher confidence)
- Moderate: 3-4 strategies (balanced approach)
- Aggressive: 2-3 strategies (more frequent signals)
Category Agreement Threshold (2-5, default 3):
Democratic voting minimum for signal generation:
- Higher agreement: Fewer but higher quality signals
- Lower agreement: More signals, potential false positives
Swiss-Cheese Mixing (0.1-0.5, default 0.382):
Golden ratio φ⁻¹ based blending of trend factors:
- 0.382 is φ⁻¹, optimal for natural market fractals
- Higher values: Stronger trend following
- Lower values: More contrarian signals
OFPI Configuration:
- OFPI Length (5-30, default 14): Order Flow calculation period
- T3 Smoothing (3-10, default 5): Advanced exponential smoothing
- T3 Volume Factor (0.5-1.0, default 0.7): Smoothing aggressiveness control
Unified Scoring System
Component Weights (sum ≈ 1.0):
- L-Function Weight (0.1-0.5, default 0.3): Mathematical harmony emphasis
- Galois Rank Weight (0.1-0.5, default 0.2): Market structure complexity
- Operadic Weight (0.1-0.5, default 0.3): Multi-strategy consensus
- Correspondence Weight (0.1-0.5, default 0.2): Theory-practice alignment
Signal Threshold (0.5-10.0, default 5.0):
Quality filter producing:
- 8.0+: EXCEPTIONAL signals only
- 6.0-7.9: STRONG signals
- 4.0-5.9: MODERATE signals
- 2.0-3.9: WEAK signals
🎨 ADVANCED VISUAL SYSTEM
Multi-Dimensional Quantum Aura Bands
Five-layer resonance field showing market energy:
- Colors: Theme-matched gradients (Quantum purple, Holographic cyan, etc.)
- Expansion: Dynamic based on score intensity and volatility
- Function: Multi-timeframe support/resistance zones
Morphism Flow Portals
Category theory visualization showing market topology:
- Green/Cyan Portals: Bullish mathematical flow
- Red/Orange Portals: Bearish mathematical flow
- Size/Intensity: Proportional to signal strength
- Recursion Depth (1-8): Nested patterns for flow evolution
Fractal Grid System
Dynamic support/resistance with projected L-Scores:
- Multiple Timeframes: 10, 20, 30, 40, 50-period highs/lows
- Smart Spacing: Prevents level overlap using ATR-based minimum distance
- Projections: Estimated signal scores when price reaches levels
- Usage: Precise entry/exit timing with mathematical confirmation
Wick Pressure Analysis
Rejection level prediction using candle mathematics:
- Upper Wicks: Selling pressure zones (purple/red lines)
- Lower Wicks: Buying pressure zones (purple/green lines)
- Glow Intensity (1-8): Visual emphasis and line reach
- Application: Confluence with fractal grid creates high-probability zones
Regime Intensity Heatmap
Background coloring showing market energy:
- Black/Dark: Low activity, range-bound markets
- Purple Glow: Building momentum and trend development
- Bright Purple: High activity, strong directional moves
- Calculation: Combines trend, momentum, volatility, and score intensity
Six Professional Themes
- Quantum: Purple/violet for general trading and mathematical focus
- Holographic: Cyan/magenta optimized for cryptocurrency markets
- Crystalline: Blue/turquoise for conservative, stability-focused trading
- Plasma: Gold/magenta for high-energy volatility trading
- Cosmic Neon: Bright neon colors for maximum visibility and aggressive trading
📊 INSTITUTIONAL-GRADE DASHBOARD
Unified AI Score Section
- Total Score (-10 to +10): Primary decision metric
- >5: Strong bullish signals
- <-5: Strong bearish signals
- Quality ratings: EXCEPTIONAL > STRONG > MODERATE > WEAK
- Component Analysis: Individual L-Function, Galois, Operadic, and Correspondence contributions
Order Flow Analysis
Revolutionary OFPI integration:
- OFPI Value (-100% to +100%): Real buying vs selling pressure
- Visual Gauge: Horizontal bar chart showing flow intensity
- Momentum Status: SHIFTING, ACCELERATING, STRONG, MODERATE, or WEAK
- Trading Application: Flow shifts often precede major moves
Signal Performance Tracking
- Win Rate Monitoring: Real-time success percentage with emoji indicators
- Signal Count: Total signals generated for frequency analysis
- Current Position: LONG, SHORT, or NONE with P&L tracking
- Volatility Regime: HIGH, MEDIUM, or LOW classification
Market Structure Analysis
- Möbius Field Strength: Mathematical field oscillation intensity
- CHAOTIC: High complexity, use wider stops
- STRONG: Active field, normal position sizing
- MODERATE: Balanced conditions
- WEAK: Low activity, consider smaller positions
- HTF Trend: Higher timeframe bias (BULL/BEAR/NEUTRAL)
- Strategy Agreement: Multi-algorithm consensus level
Position Management
When in trades, displays:
- Entry Price: Original signal price
- Current P&L: Real-time percentage with risk level assessment
- Duration: Bars in trade for timing analysis
- Risk Level: HIGH/MEDIUM/LOW based on current exposure
🚀 SIGNAL GENERATION LOGIC
Balanced Long/Short Architecture
The indicator generates signals through multiple convergent pathways:
Long Entry Conditions:
- Score threshold breach with algorithmic agreement
- Strong bullish order flow (OFPI > 0.15) with positive composite signal
- Bullish pattern recognition with mathematical confirmation
- HTF trend alignment with momentum shifting
- Extreme bullish OFPI (>0.3) with any positive score
Short Entry Conditions:
- Score threshold breach with bearish agreement
- Strong bearish order flow (OFPI < -0.15) with negative composite signal
- Bearish pattern recognition with mathematical confirmation
- HTF trend alignment with momentum shifting
- Extreme bearish OFPI (<-0.3) with any negative score
Exit Logic:
- Score deterioration below continuation threshold
- Signal quality degradation
- Opposing order flow acceleration
- 10-bar minimum between signals prevents overtrading
⚙️ OPTIMIZATION GUIDELINES
Asset-Specific Settings
Cryptocurrency Trading:
- Modular Level: 15-25 (capture volatility)
- L-Function Precision: 0.8-1.3 (reactive to price swings)
- OFPI Length: 10-20 (fast correlation shifts)
- Cascade Levels: 5-7, Theme: Holographic
Stock Index Trading:
- Modular Level: 25-35 (balanced trending)
- L-Function Precision: 1.5-1.8 (stable patterns)
- OFPI Length: 14-20 (standard correlation)
- Cascade Levels: 4-5, Theme: Quantum
Forex Trading:
- Modular Level: 35-45 (smooth trends)
- L-Function Precision: 1.6-2.1 (high smoothing)
- OFPI Length: 18-25 (disable volume amplification)
- Cascade Levels: 3-4, Theme: Crystalline
Timeframe Optimization
Scalping (1-5 minute charts):
- Reduce all lookback parameters by 30-40%
- Increase L-Function precision for noise reduction
- Enable all visual elements for maximum information
- Use Small dashboard to save screen space
Day Trading (15 minute - 1 hour):
- Use default parameters as starting point
- Adjust based on market volatility
- Normal dashboard provides optimal information density
- Focus on OFPI momentum shifts for entries
Swing Trading (4 hour - Daily):
- Increase lookback parameters by 30-50%
- Higher L-Function precision for stability
- Large dashboard for comprehensive analysis
- Emphasize HTF trend alignment
🏆 ADVANCED TRADING STRATEGIES
The Mathematical Confluence Method
1. Wait for Fractal Grid level approach
2. Confirm with projected L-Score > threshold
3. Verify OFPI alignment with direction
4. Enter on portal signal with quality ≥ STRONG
5. Exit on score deterioration or opposing flow
The Regime Trading System
1. Monitor Aether Flow background intensity
2. Trade aggressively during bright purple periods
3. Reduce position size during dark periods
4. Use Möbius Field strength for stop placement
5. Align with HTF trend for maximum probability
The OFPI Momentum Strategy
1. Watch for momentum shifting detection
2. Confirm with accelerating flow in direction
3. Enter on immediate portal signal
4. Scale out at Fibonacci levels
5. Exit on flow deceleration or reversal
⚠️ RISK MANAGEMENT INTEGRATION
Mathematical Position Sizing
- Use Galois Rank for volatility-adjusted sizing
- Möbius Field strength determines stop width
- Fractal Dimension guides maximum exposure
- OFPI momentum affects entry timing
Signal Quality Filtering
- Trade only STRONG or EXCEPTIONAL quality signals
- Increase position size with higher agreement levels
- Reduce risk during CHAOTIC Möbius field periods
- Respect HTF trend alignment for directional bias
🔬 DEVELOPMENT JOURNEY
Creating the LOMV was an extraordinary mathematical undertaking that pushed the boundaries of what's possible in technical analysis. This indicator almost didn't happen. The theoretical complexity nearly proved insurmountable.
The Mathematical Challenge
Implementing the Langlands Program required deep research into:
- Number theory and the Möbius function
- Riemann zeta function convergence properties
- L-function analytical continuation
- Galois representations in finite fields
The mathematical literature spans decades of pure mathematics research, requiring translation from abstract theory to practical market application.
The Computational Complexity
Operadic composition theory demanded:
- Category theory implementation in Pine Script
- Multi-dimensional array management for strategy composition
- Real-time democratic voting algorithms
- Performance optimization for complex calculations
The Integration Breakthrough
Bringing together three disparate mathematical frameworks required:
- Novel approaches to signal weighting and combination
- Revolutionary Order Flow Polarity Index development
- Advanced T3 smoothing implementation
- Balanced signal generation preventing directional bias
Months of intensive research culminated in breakthrough moments when the mathematics finally aligned with market reality. The result is an indicator that reveals market structure invisible to conventional analysis while maintaining practical trading utility.
🎯 PRACTICAL IMPLEMENTATION
Getting Started
1. Apply indicator with default settings
2. Select appropriate theme for your markets
3. Observe dashboard metrics during different market conditions
4. Practice signal identification without trading
5. Gradually adjust parameters based on observations
Signal Confirmation Process
- Never trade on score alone - verify quality rating
- Confirm OFPI alignment with intended direction
- Check fractal grid level proximity for timing
- Ensure Möbius field strength supports position size
- Validate against HTF trend for bias confirmation
Performance Monitoring
- Track win rate in dashboard for strategy assessment
- Monitor component contributions for optimization
- Adjust threshold based on desired signal frequency
- Document performance across different market regimes
🌟 UNIQUE INNOVATIONS
1. First Integration of Langlands Program mathematics with practical trading
2. Revolutionary OFPI with T3 smoothing and momentum detection
3. Operadic Composition using category theory for signal democracy
4. Dynamic Fractal Grid with projected L-Score calculations
5. Multi-Dimensional Visualization through morphism flow portals
6. Regime-Adaptive Background showing market energy intensity
7. Balanced Signal Generation preventing directional bias
8. Professional Dashboard with institutional-grade metrics
📚 EDUCATIONAL VALUE
The LOMV serves as both a practical trading tool and an educational gateway to advanced mathematics. Traders gain exposure to:
- Pure mathematics applications in markets
- Category theory and operadic composition
- Number theory through Möbius function implementation
- Harmonic analysis via L-function calculations
- Advanced signal processing through T3 smoothing
⚖️ RESPONSIBLE USAGE
This indicator represents advanced mathematical research applied to market analysis. While the underlying mathematics are rigorously implemented, markets remain inherently unpredictable.
Key Principles:
- Use as part of comprehensive trading strategy
- Implement proper risk management at all times
- Backtest thoroughly before live implementation
- Understand that past performance does not guarantee future results
- Never risk more than you can afford to lose
The mathematics reveal deep market structure, but successful trading requires discipline, patience, and sound risk management beyond any indicator.
🔮 CONCLUSION
The Langlands-Operadic Möbius Vortex represents a quantum leap forward in technical analysis, bringing PhD-level pure mathematics to practical trading while maintaining visual elegance and usability.
From the harmonic analysis of the Langlands Program to the democratic composition of operadic theory, from the number-theoretic precision of the Möbius function to the revolutionary Order Flow Polarity Index, every component works in mathematical harmony to reveal the hidden order within market chaos.
This is more than an indicator - it's a mathematical lens that transforms how you see and understand market structure.
Trade with mathematical precision. Trade with the LOMV.
*"Mathematics is the language with which God has written the universe." - Galileo Galilei*
*In markets, as in nature, profound mathematical beauty underlies apparent chaos. The LOMV reveals this hidden order.*
— Dskyz, Trade with insight. Trade with anticipation.
