MTF VWAP + Candlestick VWAP Reactions (Bounce + Score)It’s an intraday VWAP + candlestick confluence tool that:
Draws daily, weekly, monthly, yearly VWAPs.
Detects textbook candlestick patterns, classed as BuH/BuM (bullish high/moderate) and BeH/BeM (bearish high/moderate) with colored boxes.
Triggers long/short arrows only when price bounces off a VWAP by at least 0.15% AND there’s a recent matching pattern.
Grades every signal as A / B / C with a score 1–10:
A (8–10) = high-reliability pattern (BuH/BeH) + strong 2-candle body reaction (your A+ setups).
B (5–8) = moderate pattern (BuM/BeM) + one solid bounce.
C (1–5) = weaker / mixed context (scalpy or gamble).
חפש סקריפטים עבור "纳斯达克期货cfd"

amir Liquidity Sweeps [amir]this indicator is from luxalgon i think this is the code that made this incdicator never get destroyed by aanyone

9:00-9:59 NY Range -> 10:00-11:00 Lines (v6)//@version=6
indicator("9:00-9:59 NY Range -> 10:00-11:00 Lines (v6)", overlay=true, max_lines_count=500)
// --- state vars ---
var float sessionHigh = na
var float sessionLow = na
var line hiLine = na
var line loLine = na
var line v10 = na
var line v11 = na
// --- New York time ---
t_ny = time("America/New_York")
hr = hour(t_ny)
mn = minute(t_ny)
// --- reset / clear at 16:00 (4 PM NY) ---
if hr == 16 and mn == 0
sessionHigh := na
sessionLow := na
if not na(hiLine)
line.delete(hiLine)
hiLine := na
if not na(loLine)
line.delete(loLine)
loLine := na
if not na(v10)
line.delete(v10)
v10 := na
if not na(v11)
line.delete(v11)
v11 := na
// --- accumulate 9:00 - 9:59 NY range ---
if hr == 9
if mn == 0
sessionHigh := high
sessionLow := low
else
sessionHigh := na(sessionHigh) ? high : math.max(sessionHigh, high)
sessionLow := na(sessionLow) ? low : math.min(sessionLow, low)
// --- at 10:00 NY: draw horizontal lines (start) and vertical dashed at 10:00 ---
if hr == 10 and mn == 0
// delete previous day's horizontal lines if any
if not na(hiLine)
line.delete(hiLine)
hiLine := na
if not na(loLine)
line.delete(loLine)
loLine := na
hiLine := line.new(bar_index, sessionHigh, bar_index, sessionHigh, color=color.red, width=1, extend=extend.none)
loLine := line.new(bar_index, sessionLow, bar_index, sessionLow, color=color.red, width=1, extend=extend.none)
if not na(v10)
line.delete(v10)
v10 := na
v10 := line.new(bar_index, low, bar_index, high, color=color.red, width=1, style=line.style_dashed)
// --- at 11:00 NY: draw vertical dashed at 11:00 ---
if hr == 11 and mn == 0
if not na(v11)
line.delete(v11)
v11 := na
v11 := line.new(bar_index, low, bar_index, high, color=color.red, width=1, style=line.style_dashed)
// --- extend the horizontal lines forward every bar, but only until 11:00 ---
if hr < 11
if not na(hiLine)
line.set_x2(hiLine, bar_index)
if not na(loLine)
line.set_x2(loLine, bar_index)
// --- required output so script compiles (hidden) ---
plot(na)

30m Hollow Candle on 5m - SSThis indicator overlays 30-minute candles on a 5-minute chart using clean, hollow-style higher-timeframe (HTF) candles.
The design keeps your chart readable while giving you full insight into the 30m structure that drives intraday price movements.
Each 30-minute candle is drawn as a transparent, hollow outline, so your 5-minute candles remain perfectly visible. The indicator preserves all candle characteristics:
Wicks (high & low)
Open/close levels
Color-coded direction (green = bullish, red = bearish)
Invisible body to avoid overlapping or chart clutter
This tool allows intraday traders to track 30m market structure without constantly switching timeframes.

1h Hollow Candle on 5m - SSThis indicator displays 1-hour candles on a 5-minute chart using a clean, minimal visual style designed for intraday traders who want to track higher-timeframe structure without cluttering the chart.
The higher-timeframe (HTF) candles are drawn as hollow outlines, which makes them easy to read while keeping the underlying 5-minute price action fully visible. Each 1-hour candle includes:
Wicks (high & low)
Open/close borders
Color-coded direction (green = bullish, red = bearish)
Transparent body so they never block real candles
This is ideal for traders who want to:
Identify HTF structure during scalping
Spot key reversals inside hourly candles
Track premium/discount zones relative to each 1h candle
Improve top-down analysis without switching timeframes

9/15 EMA Scalper 9/15 EMA Scalper — by uzairbaloch
This script is a price-action based scalping system built around the 9 EMA and 15 EMA trend structure.
It identifies short-term reversal points where the market pulls back into the EMAs and confirms direction with a strong candle signal.
The strategy looks for:
• A clear EMA trend (9 above 15 for buys, 9 below 15 for sells)
• Pullback into EMA9/EMA15 with candle bodies touching the fast EMA
• Strong confirmation candle (engulfing / strong momentum / controlled wick)
• Optional slope filter to avoid flat, choppy sessions
• Automatic trade labels showing Entry, SL and TP (based on R:R)
The script is designed for scalping on gold, indices, and high-volatility FX pairs.
It resets trade logic immediately after SL or TP is hit, so it can catch the next valid signal without delay.
This tool is meant as an indicator — not a full strategy — and can be used to visually mark high-probability EMA pullback setups with precise levels.
Author: uzairbaloch


Macketings 1min ScalpingThis is a hyper-reactive scalping strategy designed for the 1-minute chart. It utilizes a strict four-EMA hierarchy (80/90/340/500) to ensure trades are only taken in the strongest aligned market trend. The strategy is built to be extremely tight on risk and focuses on capturing the immediate, high-momentum swing that follows a confirmed EMA retest or breakout.
Key Mechanics (How it Works):
Strict Trend Alignment: Entry is only permitted when the faster EMA band (80/90) and the price action are correctly aligned with the slow trend (340/500).
Long: EMA 80/90 must be above EMA 340/500, AND EMA 340 must be above EMA 500. (And vice-versa for Short.)
Expanded Retest Entry: The strategy waits for the price to retest or briefly enter the 80/90 band, then immediately enters upon the confirmed momentum breakout from that band.
Dynamic Risk Management (Tight Ride): The strategy is engineered to ride the wave aggressively while protecting capital immediately:
Extremely Tight Initial Stop Loss (0.2% default): Limits initial risk instantly.
Break-Even Security: Once profit hits 0.3%, the Stop Loss is automatically trailed to secure 0.2% profit (a risk-free trade).
Aggressive Exit Logic: Positions are closed not only upon hitting the Take Profit target (2.5%) but also immediately if the 80/90 EMA band crosses the 340 EMA, signaling a critical loss of momentum.
Disclaimer:
This strategy requires high-liquidity instruments and is best used on low timeframes (1-minute) due to its dependency on fast momentum shifts and tight stops. Backtesting and forward testing are crucial before deployment.

XAUUSD Scalper — VolEx + Imbalance (Cleaned)this scalping technique is only applicable for Gold Scalp Trading.

Footprint Safe FinalThis script is made for guide purpose only. It has some few important functions that can help you with your trading strategy.

Energy Meter (Candle Range/ATR Ratio)Purpose:
This indicator is a simple, intuitive way to visualize auction energy — the actual force behind a price move — rather than just its appearance on the chart. It’s built on a single idea:
If a bar travels farther than normal in its fixed amount of time, something pushed harder than usual.
That “push” is auction energy, and it’s the raw material of microstructure inference: reading intent and imbalance from nothing more than candles, tempo, and volatility.
Traditional indicators focus on price patterns or volume. This one focuses on pressure — the underlying imbalance driving each bar.
How It Works
Each bar’s True Range is divided by its ATR, producing a normalized ratio:
1.0 = Average energy
>1.2 (default) = Above-normal energy
<1.0 = Quiet, low-pressure bars
This ratio is plotted as a histogram to highlight bursts of force, with a smoothed line added to show the tempo of recent energy changes.
When the histogram spikes, you’re seeing the auction flash its teeth: aggression, initiative, failed absorption, breakout ignition, or the first punch of a reversal.
When the line rolls over, you’re seeing the engine lose torque.
It’s a minimalist tool for seeing who is actually winning the auction, even when price looks deceptively calm.
Why It Matters
Price moves because of imbalance, not geometry. Two candles that look identical can represent completely different internal dynamics.
This indicator helps you see:
Breakout strength vs. fakeouts
Acceleration vs. drift
Exhaustion after extended runs
Reversal attempts with real intent
Quiet absorption before explosive moves
Shifts in aggression hidden inside consolidation
For new traders, it’s a clean introduction to microstructure inference — extracting meaningful order-flow insights without needing L2, DOM, or volume profile.
For experienced traders, it's a compact impulse detector that complements trend, volatility, and liquidity models.
Summary
This is a lightweight, first-principles tool designed to expose the energy signature of the auction: how hard the market is trying to go somewhere.
It doesn’t predict direction — it reveals pressure, so you can judge the quality of the move you’re trading.
Energy beats geometry.
Intent beats patterns.
Microstructure is hiding in every candle; this indicator makes it visible.

AI Candlestick Pattern Identifier — Arrows & AlertsAI shows you high confidence candlestick patterns so that you can identify them quickly. Buy/Sell arrows will be placed alongside the pattern to alert you of which direction the indicator believes the market will go, as well as showing you the confidence in that indicator.

EQT Stochastic RibbonEQT Stochastic Ribbon is a modified Stochastic Oscillator with ribbon fill visualization.
Features:
- Dynamic color ribbon that changes based on trend direction (Blue for bullish, White for bearish)
- Crossover signals with triangle markers when %K crosses %D
- Customizable colors and signal offset
- Dashed lines at 80/20 levels for overbought/oversold zones
How to use:
- Blue ribbon = Bullish momentum (%K above %D)
- White ribbon = Bearish momentum (%K below %D)
- Triangle up = Buy signal (K crosses above D)
- Triangle down = Sell signal (K crosses below D)
Settings:
- K, D, Smooth - Standard Stochastic parameters
- Signal Offset - Distance of signal arrows from the line
- Bullish/Bearish Colors - Customize ribbon and signal colors

Smart Margin Zone
SMART MARGIN ZONE - CME-BASED SUPPORT & RESISTANCE INDICATOR
TITLE FOR PUBLICATION:
Smart Margin Zone - CME Margin-Based Support and Resistance
CATEGORY:
Support and Resistance
SHORT DESCRIPTION (for preview):
Automatically plots margin zones based on CME Group requirements. These zones represent critical price levels where leveraged traders face margin calls, creating natural support and resistance through forced liquidations.
═══════════════════════════════════════════════════════════════
FULL DESCRIPTION FOR TRADINGVIEW:
═══════════════════════════════════════════════════════════════
📊 Smart Margin Zone - Professional Trading Zones Based on CME Data
This indicator automatically calculates and displays margin zones derived from official CME Group margin requirements. These zones represent critical price levels where traders using leverage receive margin calls, triggering forced position closures that create natural support and resistance levels.
═══════════════════════════════════════════════════════════════
🎯 CORE CONCEPT
═══════════════════════════════════════════════════════════════
When price reaches calculated margin zones, traders using 2:1 or 4:1 leverage on CME futures receive margin calls. Brokers automatically liquidate these positions, creating waves of buying or selling pressure that form strong support and resistance levels.
This is not theoretical - it's based on actual margin requirements from CME Group, the world's largest derivatives marketplace.
═══════════════════════════════════════════════════════════════
📐 CALCULATION METHODOLOGY
═══════════════════════════════════════════════════════════════
The indicator uses the following formula to calculate zone sizes:
Zone Size = (Margin Requirement / Tick Value) × Tick Size × 1.10
Where:
• Margin Requirement = Official CME initial margin (updated November 2024)
• Tick Value = Dollar value of minimum price movement
• Tick Size = Minimum price increment
• 1.10 = 10% buffer for realistic zone width
SUPPORTED INSTRUMENTS WITH CME DATA:
Currency Pairs:
• EURUSD: $2,100 margin → 0.0168 zone size
• GBPUSD: $1,800 margin → 0.0144 zone size
• AUDUSD: $1,300 margin → 0.0065 zone size
• NZDUSD: $1,100 margin → 0.0055 zone size
• USDJPY: $3,200 margin → custom calculation
• USDCAD: $950 margin → calculated
• USDCHF: $1,650 margin → calculated
Commodities:
• Gold (XAUUSD): $8,000 margin → 80 points zone size
• Silver (XAGUSD): $6,500 margin → calculated
• WTI Crude Oil: $4,500 margin → calculated
═══════════════════════════════════════════════════════════════
🔍 HOW IT WORKS
═══════════════════════════════════════════════════════════════
1. SWING POINT DETECTION
The indicator automatically identifies swing highs and swing lows using a configurable lookback period (default 10 bars). These become anchor points for zone calculations.
2. FIVE ZONE LEVELS
From each swing point, five zone levels are calculated:
• Zone 1/4 (25%) - First correction level
• Zone 1/2 (50%) - KEY ZONE for trend determination
• Zone 3/4 (75%) - Intermediate level
• Zone 1/1 (100%) - Full margin zone (strongest level)
• Zone 5/4 (125%) - Extended zone
3. TREND IDENTIFICATION
• Close above Zone 1/2 resistance = Bullish trend
• Close below Zone 1/2 support = Bearish trend
• Between zones = Range/consolidation
4. HISTORICAL CONTEXT
Current zones are displayed prominently with fills and labels. Historical zones appear as thin, semi-transparent lines for context without cluttering the chart.
═══════════════════════════════════════════════════════════════
⚙️ FEATURES
═══════════════════════════════════════════════════════════════
AUTOMATED CALCULATION:
✅ Auto-detection of swing highs and lows
✅ Real-time zone updates as new swings form
✅ CME margin data built-in for major instruments
✅ Manual override option for custom calculations
VISUAL CLARITY:
✅ Color-coded zones (red=resistance, green=support)
✅ Adjustable transparency for fills and lines
✅ Current zones bold with fills and price labels
✅ Historical zones thin and transparent
✅ Swing point markers show calculation origins
CUSTOMIZATION:
✅ Show/hide individual zone levels (1/4, 1/2, 3/4, 1/1, 5/4)
✅ Toggle historical zones on/off
✅ Adjustable lookback period (5-50 bars)
✅ Customizable colors for all elements
✅ Line width and transparency controls
✅ Zone extension options (none/right/both)
TREND ANALYSIS:
✅ Optional trend background coloring
✅ Customizable trend colors and transparency
✅ Real-time trend identification display
STATISTICS:
✅ Live statistics table showing:
- Current instrument
- Active zone size
- Calculation mode
- Current trend direction
- Number of zones displayed
ALERTS:
✅ Zone 1/2 breakout (up/down)
✅ Full margin zone 1/1 reached
✅ Customizable alert messages
═══════════════════════════════════════════════════════════════
📈 TRADING APPLICATIONS
═══════════════════════════════════════════════════════════════
ENTRY SIGNALS:
• Bounces from zone levels = potential entry points
• Zone 1/2 breakouts = trend continuation entries
• Zone rejections = reversal opportunities
RISK MANAGEMENT:
• Zone levels = logical stop-loss placement
• Zone 1/1 = maximum risk level
• Zone spacing = position sizing guide
PROFIT TARGETS:
• Next zone level = first target
• Zone 1/1 = full profit target
• Zone breakouts = extended targets
TREND CONFIRMATION:
• Price above Zone 1/2 resistance = confirmed uptrend
• Price below Zone 1/2 support = confirmed downtrend
• Consolidation between zones = wait for breakout
═══════════════════════════════════════════════════════════════
📚 USAGE INSTRUCTIONS
═══════════════════════════════════════════════════════════════
GETTING STARTED:
1. Add indicator to chart of any supported instrument
2. Zones automatically calculate and display
3. Adjust swing detection period if needed (default 10 works well)
4. Customize colors and visibility to your preference
OPTIMAL SETTINGS:
• Best timeframes: H1, H4, Daily, Weekly
• Default swing length (10) suitable for most markets
• Show 2-3 historical zones for context
• Enable swing point markers to see calculation origins
INTERPRETATION:
• Watch for price reactions at zone boundaries
• Strong bounces = respect for margin level
• Clean breaks = momentum continuation
• Multiple touches = zone strength confirmation
SET ALERTS:
• Zone 1/2 breakouts for trend entries
• Zone 1/1 reaches for profit-taking
• Custom alerts for your specific strategy
═══════════════════════════════════════════════════════════════
⚠️ IMPORTANT NOTES
═══════════════════════════════════════════════════════════════
DATA ACCURACY:
• CME margin requirements updated November 2024
• Margins change periodically - check CME Group website
• Manual mode available for latest margin data
• Indicator provides analysis tool, not financial advice
STATISTICAL PERFORMANCE:
• Historical data shows >60% probability of continued movement after Zone 1/2 breakout
• Zone effectiveness varies by market conditions
• Best results in trending markets with clear swings
LIMITATIONS:
• Margin requirements change - monitor CME updates
• Works best on liquid instruments with clear swings
• Not a standalone trading system
• Should be combined with additional analysis
═══════════════════════════════════════════════════════════════
🔧 METHODOLOGY CREDIT
═══════════════════════════════════════════════════════════════
This indicator is based on the margin zones concept developed by Alexander Bazylev (BTrade indicator for MetaTrader platforms).
The TradingView implementation has been completely rewritten with original enhancements:
• Multiple zone levels instead of single level
• Automatic swing point detection algorithm
• Direct CME data integration
• Historical zone visualization
• Advanced customization options
• Comprehensive statistics and alerts
All code is original and specifically designed for TradingView's Pine Script v5 environment.
═══════════════════════════════════════════════════════════════
💡 BEST PRACTICES
═══════════════════════════════════════════════════════════════
COMBINE WITH:
• Volume analysis for confirmation
• Trend indicators for direction bias
• Price action patterns at zones
• Higher timeframe analysis
AVOID:
• Trading against strong trends at minor zones
• Over-leveraging based solely on zone placement
• Ignoring broader market context
• Expecting perfect bounces every time
OPTIMIZE:
• Adjust swing length for different timeframes
• Shorter period (5-7) for intraday trading
• Longer period (15-20) for swing trading
• Test historical effectiveness on your instruments
═══════════════════════════════════════════════════════════════
📖 EDUCATIONAL VALUE
═══════════════════════════════════════════════════════════════
This indicator helps traders understand:
• How institutional margin requirements affect price
• Where forced liquidations create pressure
• Natural support and resistance formation
• Relationship between leverage and price levels
• Market structure and key technical levels
═══════════════════════════════════════════════════════════════
🔄 VERSION HISTORY
═══════════════════════════════════════════════════════════════
Version 1.0 (Initial Release):
• CME-based zone calculation for 10 instruments
• Automatic swing high/low detection
• 5 zone levels with customizable display
• Historical zones with transparency control
• Swing point markers
• Trend background indicator
• Live statistics table
• Multiple alert conditions
• Fully customizable colors and styles
• English language interface
═══════════════════════════════════════════════════════════════
📞 SUPPORT & FEEDBACK
═══════════════════════════════════════════════════════════════
Questions or suggestions? Leave a comment below!
If you find this indicator useful:
⭐ Please leave a like
💬 Share your experience in comments
🔔 Follow for updates and new indicators
═══════════════════════════════════════════════════════════════
⚖️ DISCLAIMER
═══════════════════════════════════════════════════════════════
This indicator is provided for educational and analytical purposes only. It is not financial advice and should not be the sole basis for trading decisions.
• Past performance does not guarantee future results
• Trading involves substantial risk of loss
• CME margin requirements subject to change
• Always do your own research and risk management
• Consult a financial advisor for investment advice
The creator is not responsible for any trading losses incurred through use of this indicator.

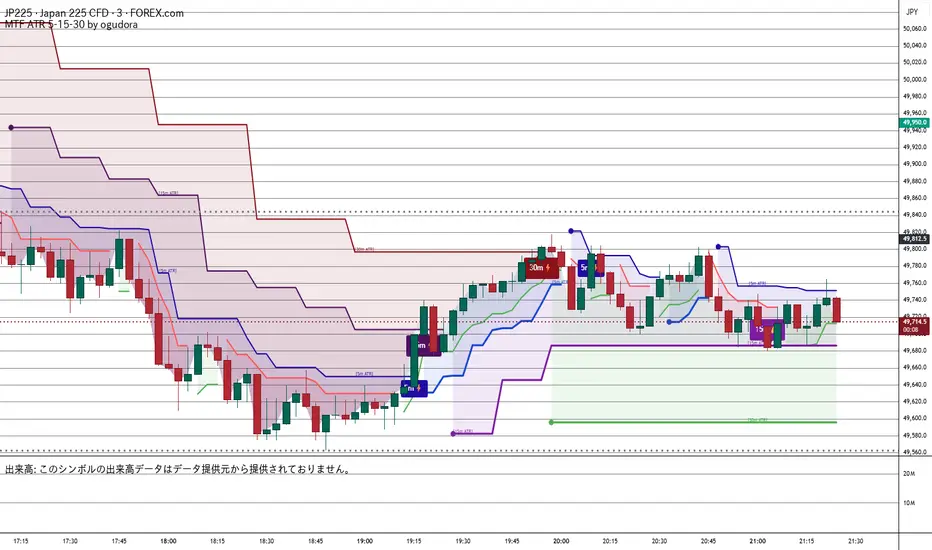
Multitime ATR (5m/15m/30m)Special thanks to Ogura
“This indicator displays ATR values for timeframes shorter than 30 minutes.”
“An ATR indicator designed to visualize volatility across 5-minute, 15-minute, and 30-minute timeframes.”
30分未満のATRを表示するインジケーターです。おぐさんありがとう。
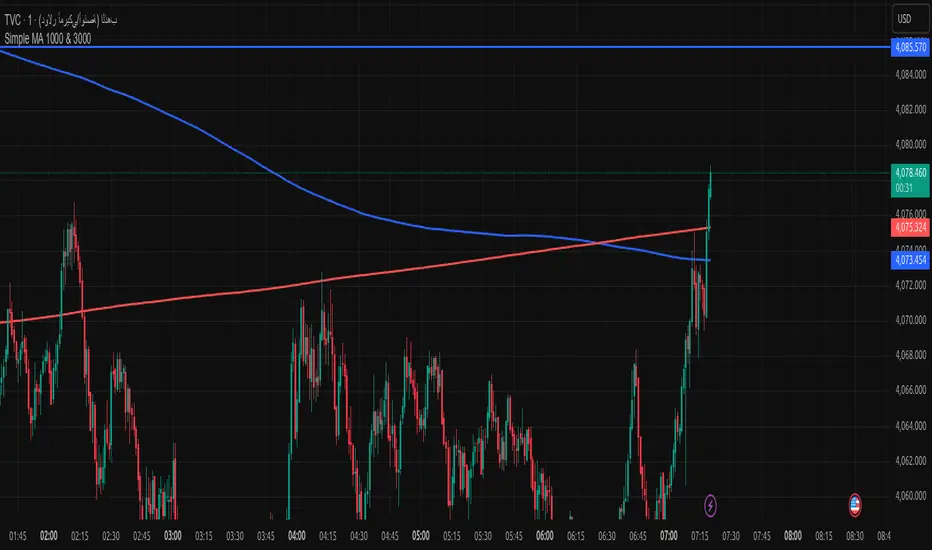
Simple MA 1000 & 3000when toche moving address add buy if from high or sell if from donw with sl 20pip
DANGHIEU EMA 34/89/200 Ribbon (Scaled HTF)📘 Indicator Description – EMA 34/89/200 Ribbon (Scaled HTF)
The EMA 34/89/200 Ribbon (Scaled HTF) indicator is designed to replicate higher-timeframe EMAs directly on your current chart without switching timeframes.
Using a precise HTF Scaling Algorithm, the script converts EMAs from 1H, 2H, 4H, 6H, 12H, 1D, and even 1W into equivalent lengths on lower timeframes—allowing traders to perform true multi-timeframe trend analysis on a single chart.
The 34-EMA and 89-EMA form a dynamic trend ribbon that changes color based on the relationship between the two moving averages. This helps traders quickly identify trend direction, momentum strength, and potential market reversals. The indicator also includes optional crossover markers (X symbols) to highlight bullish and bearish crossovers for cleaner signal recognition. EMA200 is included as the long-term trend anchor.
This tool is ideal for scalpers, day traders, and swing traders who require higher-timeframe context while trading lower-timeframe entries.
🟦 How to Use the Indicator
1. Choose the Higher Timeframe to Simulate
Use the “HTF to Simulate” dropdown to select the timeframe you want to emulate (e.g., 4H, 2H, 1D, 1W).
The script automatically scales the EMA lengths so they match the selected HTF.
2. Read the Ribbon for Trend Direction
Green Ribbon → EMA34 above EMA89 → Bullish momentum
Red Ribbon → EMA34 below EMA89 → Bearish momentum
The ribbon expands when momentum strengthens and contracts during consolidation.
3. Use EMA Crossovers as Signal Zones
Optional X markers highlight crossover points:
Bullish Crossover → EMA34 crosses above EMA89
Bearish Crossover → EMA34 crosses below EMA89
These crossovers often align with trend shifts or early momentum changes.
4. EMA200 as Trend Filter
The EMA200 acts as the macro trend filter:
Price above EMA200 → only consider long setups
Price below EMA200 → only consider short setups
Combining ribbon trend + EMA200 alignment improves signal accuracy.
5. Multi-Timeframe Trading Strategy
This indicator is powerful for:
Scalping with HTF bias
Pullback entry on lower timeframe during HTF trend
Identifying trend exhaustion when the ribbon flips
Confirming wave structure (Elliott Wave, Dow Theory)
Spotting strong momentum phases and squeeze zones
Example workflow:
Select 4H as HTF simulation.
Trade on 15m or 5m chart.
Enter only when price aligns with the HTF ribbon + EMA200 trend.
Use EMA crossovers as confirmation signals.

Multi-Timeframe Stochastic (4x) z Podświetlaniem - PawelA script that provides information when most of the stocks are in the overbought or oversold zone.

Multi-Timeframe RSI (4x) z Podświetlaniem - PawełRSI z podświetleniem z różnych tfów z ustawianiem intensywnosci i kolorów.

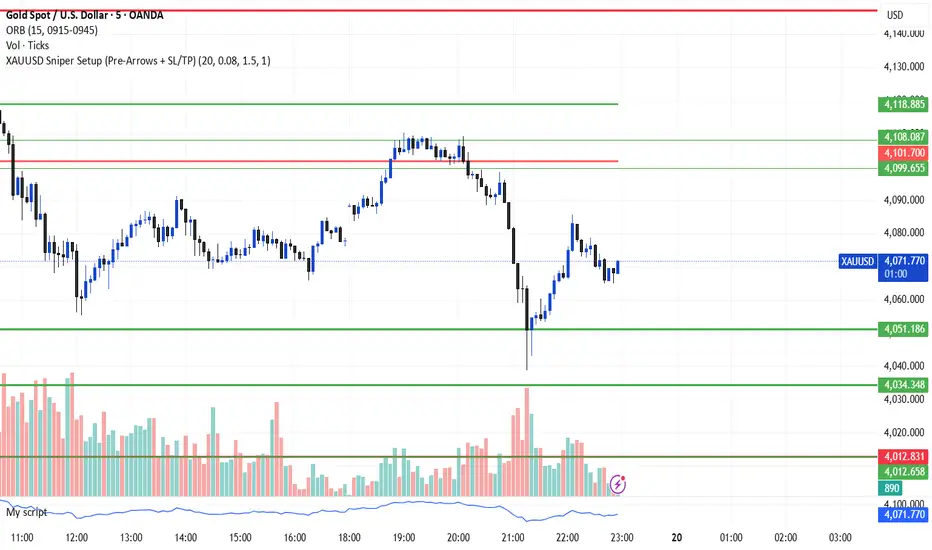
XAUUSD Sniper Setup (Pre-Arrows + SL/TP)//@version=5
indicator("XAUUSD Sniper Setup (Pre-Arrows + SL/TP)", overlay=true)
// === Inputs ===
rangePeriod = input.int(20, "Lookback Bars for Zone", minval=5)
maxRangePercent = input.float(0.08, "Max Range % for Consolidation", step=0.01)
tpMultiplier = input.float(1.5, "TP Multiplier")
slMultiplier = input.float(1.0, "SL Multiplier")
// === Consolidation Detection ===
highestPrice = ta.highest(high, rangePeriod)
lowestPrice = ta.lowest(low, rangePeriod)
priceRange = highestPrice - lowestPrice
percentRange = (priceRange / close) * 100
isConsolidation = percentRange < maxRangePercent
// === Zones ===
demandZone = lowestPrice
supplyZone = highestPrice
// === Plot Consolidation Zone Background ===
bgcolor(isConsolidation ? color.new(color.gray, 85) : na)
// === Plot Potential Buy/Sell Levels ===
plot(isConsolidation ? demandZone : na, color=color.green, title="Potential Buy Level", linewidth=2)
plot(isConsolidation ? supplyZone : na, color=color.red, title="Potential Sell Level", linewidth=2)
// === Liquidity Sweep ===
liquidityTakenBelow = low < demandZone
liquidityTakenAbove = high > supplyZone
// === Engulfing Candles ===
bullishEngulfing = close > open and close < open and close > open
bearishEngulfing = close < open and close > open and close < open
// === Break of Structure ===
bosUp = high > ta.highest(high , 5)
bosDown = low < ta.lowest(low , 5)
// === Sniper Entry Conditions ===
buySignal = isConsolidation and liquidityTakenBelow and bullishEngulfing and bosUp
sellSignal = isConsolidation and liquidityTakenAbove and bearishEngulfing and bosDown
// === SL & TP Levels ===
slBuy = demandZone - (priceRange * slMultiplier)
tpBuy = close + (priceRange * tpMultiplier)
slSell = supplyZone + (priceRange * slMultiplier)
tpSell = close - (priceRange * tpMultiplier)
// === PRE-ARROWS (Show Before Breakout) ===
preBuyArrow = isConsolidation ? 1 : na
preSellArrow = isConsolidation ? -1 : na
plotarrow(preBuyArrow, colorup=color.new(color.green, 50), maxheight=20, minheight=20, title="Pre-Buy Arrow")
plotarrow(preSellArrow, colordown=color.new(color.red, 50), maxheight=20, minheight=20, title="Pre-Sell Arrow")
// === SNIPER CONFIRMATION ARROWS ===
buyArrow = buySignal ? 1 : na
sellArrow = sellSignal ? -1 : na
plotarrow(buyArrow, colorup=color.green, maxheight=60, minheight=60, title="Sniper BUY Arrow")
plotarrow(sellArrow, colordown=color.red, maxheight=60, minheight=60, title="Sniper SELL Arrow")
// === BUY SIGNAL ===
if buySignal
label.new(bar_index, low, "BUY\nSL/TP Added", style=label.style_label_up, color=color.green, textcolor=color.white)
line.new(bar_index, slBuy, bar_index + 5, slBuy, color=color.red, style=line.style_dotted)
line.new(bar_index, tpBuy, bar_index + 5, tpBuy, color=color.green, style=line.style_dotted)
label.new(bar_index, slBuy, "SL", color=color.red, style=label.style_label_down)
label.new(bar_index, tpBuy, "TP", color=color.green, style=label.style_label_up)
// === SELL SIGNAL ===
if sellSignal
label.new(bar_index, high, "SELL\nSL/TP Added", style=label.style_label_down, color=color.red, textcolor=color.white)
line.new(bar_index, slSell, bar_index + 5, slSell, color=color.red, style=line.style_dotted)
line.new(bar_index, tpSell, bar_index + 5, tpSell, color=color.green, style=line.style_dotted)
label.new(bar_index, slSell, "SL", color=color.red, style=label.style_label_up)
label.new(bar_index, tpSell, "TP", color=color.green, style=label.style_label_down)
// === Alerts ===
alertcondition(buySignal, title="Sniper BUY", message="Sniper BUY setup on XAUUSD")
alertcondition(sellSignal, title="Sniper SELL", message="Sniper SELL setup on XAUUSD")
OANDA:XAUUSD
FxAST Ichi ProSeries Enhanced Full Market Regime EngineFxAST Ichi ProSeries v1.x is a modernized Ichimoku engine that keeps the classic logic but adds a full market regime engine for any market and instrument.”
Multi-timeframe cloud overlay
Oracle long-term baseline
Trend regime classifier (Bull / Bear / Transition / Range)
Chikou & Cloud breakout signals
HTF + Oracle + Trend dashboard
Alert-ready structure for automation
No repainting: all HTF calls use lookahead_off.
1. Core Ichimoku Engine
Code sections:
Input group: Core Ichimoku
Function: ichiCalc()
Variables: tenkan, kijun, spanA, spanB, chikou
What it does
Calculates the classic Ichimoku components:
Tenkan (Conversion Line) – fast Donchian average (convLen)
Kijun (Base Line) – slower Donchian average (baseLen)
Senkou Span A (Span A / Lead1) – (Tenkan + Kijun)/2
Senkou Span B (Span B / Lead2) – Donchian over spanBLen
Chikou – current close shifted back in time (displace)
Everything else in the indicator builds on this engine.
How to use it (trading)
Tenkan vs Kijun = short-term vs medium-term balance.
Tenkan above Kijun = short-term bullish control; below = bearish control.
Span A / B defines the cloud, which represents equilibrium and support/resistance.
Price above cloud = bullish bias; price below cloud = bearish bias.
Graphic
2. Display & Cloud Styling
Code sections:
Input groups: Display Options, Cloud Styling, Lagging Span & Signals
Variables: showTenkan, showKijun, showChikou, showCloud, bullCloudColor, bearCloudColor, cloudLineWidth, laggingColor
Plots: plot(tenkan), plot(kijun), plot(chikou), p1, p2, fill(p1, p2, ...)
What it does
Lets you toggle individual components:
Show/hide Tenkan, Kijun, Chikou, and the cloud.
Customize cloud colors & opacity:
bullCloudColor when Span A > Span B
bearCloudColor when Span A < Span B
Adjust cloud line width for clarity.
How to use it
Turn off components you don’t use (e.g., hide Chikou if you only want cloud + Tenkan/Kijun).
For higher-timeframe or noisy charts, use thicker Kijun & cloud so structure is easier to see.
Graphic
Before
After
3. HTF Cloud Overlay (Multi-Timeframe)
Code sections:
Input group: HTF Cloud Overlay
Vars: showHTFCloud, htfTf, htfAlpha
Logic: request.security(..., ichiCalc(...)) → htfSpanA, htfSpanB
Plots: pHTF1, pHTF2, fill(pHTF1, pHTF2, ...)
What it does
Pulls higher-timeframe Ichimoku cloud (e.g., 1H, 4H, Daily) onto your current chart.
Uses the same Ichimoku settings but aggregates on htfTf.
Plots an extra, semi-transparent cloud ahead of price:
Greenish when HTF Span A > Span B
Reddish when HTF Span B > Span A
How to use it
Trade LTF (e.g., 5m/15m) only in alignment with HTF trend:
HTF cloud bullish + LTF Ichi bullish → look for longs
HTF cloud bearish + LTF Ichi bearish → look for shorts
Treat HTF cloud boundaries as major S/R zones.
Graphic
4. Oracle Module
Code sections:
Input group: Oracle Module
Vars: useOracle, oracleLen, oracleColor, oracleWidth, oracleSlopeLen
Logic: oracleLine = donchian(oracleLen); slope check vs oracleLine
Plot: plot(useOracle ? oracleLine : na, "Oracle", ...)
What it does
Creates a long-term Donchian baseline (default 208 bars).
Uses a simple slope check:
Current Oracle > Oracle oracleSlopeLen bars ago → Oracle Bull
Current Oracle < Oracle oracleSlopeLen bars ago → Oracle Bear
Slope state is also shown in the dashboard (“Bull / Bear / Flat”).
How to use it
Think of Oracle as your macro anchor :
Only take longs when Oracle is sloping up or flat.
Only take shorts when Oracle is sloping down or flat.
Works well combined with HTF cloud:
HTF cloud bullish + Oracle Bull = higher conviction long bias.
Ideal for Gold / Indices swing trades as a trend filter.
Graphic idea
5. Trend Regime Classifier
Code sections:
Input group: Trend Regime Logic
Vars: useTrendRegime, bgTrendOpacity, minTrendScore
Logic:
priceAboveCloud, priceBelowCloud, priceInsideCloud
Tenkan vs Kijun alignment
Cloud bullish/bearish
bullScore / bearScore (0–3)
regime + regimeLabel + regimeColor
Visuals: bgcolor(regimeColor) and optional barcolor() in priceColoring mode.
What it does
Scores the market in three dimensions :
Price vs Cloud
Tenkan vs Kijun
Cloud Direction (Span A vs Span B)
Each condition contributes +1 to either bullScore or bearScore .
Then:
Bull regime when:
bullScore >= minTrendScore and bullScore > bearScore
Price in cloud → “Range”
Everything else → “Transition”
These regimes are shown as:
Background colors:
Teal = Bull
Maroon = Bear
Orange = Range
Silver = Transition
Optional candle recoloring when priceColoring = true.
How to use it
Filters:
Only buy when regime = Bull or Transition and Oracle/HTF agree.
Only sell when regime = Bear or Transition and Oracle/HTF agree.
No trade zone:
When regime = Range (price inside cloud), avoid new entries; wait for break.
Aggressiveness:
Adjust minTrendScore to be stricter (3) or looser (1).
Graphic
6. Signals: Chikou & Cloud Breakout
Code sections :
Logic:
chikouBuySignal = ta.crossover(chikou, close)
chikouSellSignal = ta.crossunder(chikou, close)
cloudBreakUp = priceInsideCloud and priceAboveCloud
cloudBreakDown = priceInsideCloud and priceBelowCloud
What it does
1. Two key signal groups:
Chikou Cross Signals
Buy when Chikou crosses up through price.
Sell when Chikou crosses down through price.
Classic Ichi confirmation idea: Chikou breaking free of price cluster.
2. Cloud Breakout Signals
Long trigger: yesterday inside cloud → today price breaks above cloud.
Short trigger: yesterday inside cloud → today price breaks below cloud.
Captures “equilibrium → expansion” moves.
These are conditions only in this version (no chart shapes yet) but are fully wired for alerts. (Future Updates)
How to use it
Use Chikou signals as confirmation, not standalone entries:
Eg., Bull regime + Oracle Bull + cloud breakout + Chikou Buy.
Use Cloud Breakouts to catch the first impulsive leg after consolidation.
Graphic
7. Alerts (Automation Ready)
[
b]Code sections:
Input group: Alerts
Vars: useAlertTrend, useAlertChikou, useAlertCloudBO
Alert lines like: "FxAST Ichi Bull Trend", "FxAST Ichi Bull Trend", "FxAST Ichi Cloud Break Up"
What it does
Provides ready-made alert hooks for:
Trend regime (Bull / Bear)
Chikou cross buy/sell
Cloud breakout up/down
Each type can be globally toggled on/off via the inputs (helpful if a user only wants one kind).
How to use it
In TradingView: set alerts using “Any alert() function call” on this indicator.
Then filter which ones fire by:
Turning specific alert toggles on/off in input panel, or
Filtering text in your external bot / webhook side.
Example simple workflow ---> Indicator ---> TV Alert ---> Webhook ---> Bot/Broker
8. FxAST Dashboard
Code sections:
Input group: Dashboard
Vars: showDashboard, dashPos, dash, dashInit
Helper: getDashPos() → position.*
Table cells (updated on barstate.islast):
Row 0: Regime + label
Row 1: Oracle status (Bull / Bear / Flat / Off)
Row 2: HTF Cloud (On + TF / Off)
Row 3: Scores (BullScore / BearScore)
What it does
Displays a compact panel with the state of the whole system :
Current Trend Regime (Bull / Bear / Transition / Range)
Oracle slope state
Whether HTF Cloud is active + which timeframe
Raw Bull / Bear scores (0–3 each)
Position can be set: Top Right, Top Left, Bottom Right, Bottom Left.
How to use it
Treat it like a pilot instrument cluster :
Quick glance: “Are my trend, oracle and HTF all aligned?”
Great for streaming / screenshots: everything important is visible in one place without reading the code.
Graphic (lower right of chart )

Trend Following Volatility Trail*Script was previously removed by Moderators at 1.8k boosts* - This was out of my control. This script was very popular and seemed to help a lot of traders. I am re uploading to help the community!
Trend Following Volatility Trail
The Trend Following Volatility Trail is a dynamic trend-following tool that adapts its stop, bias, and zones to real-time volatility and trend strength. Instead of using static ATR multiples like a normal Supertrend or Chandelier Stop, it continuously adjusts itself based on how stretched the market is and how persistent the trend has been. This indicator is based on volatility weighted EMAC
This makes the system far more reactive during momentum phases and more conservative during consolidation, helping avoid fake flips and late entries.
How It Works
The indicator builds an adaptive trail around a smoothed price basis:
– It starts with a short EMA as the “core trend line.”
– It measures volatility expansion versus normal volatility.
– It measures trend persistence by reading whether price has been rising or falling consistently.
– These two components combine to adjust the ATR multiplier dynamically.
As volatility expands or the trend becomes more persistent, the bands widen.
When volatility compresses or the trend weakens, the bands tighten.
These adaptive bands form the foundation of the trailing system.
Bull & Bear State Logic
The tool constantly tracks whether price is above or below the adaptive trail:
Price above the upper trail → Bullish regime
Price below the lower trail → Bearish regime
But instead of flipping immediately, it waits for confirmation bars to avoid noise.
This greatly reduces whipsaws and keeps the focus on sustained moves.
Once a new regime is confirmed:
– A coloured cloud appears (bull or bear)
– A label marks the flip point
– Alerts can be triggered automatically
Best Uses
Identifying regime shifts early
Riding sustained trends with confidence
Avoiding choppy markets by requiring confirmation
Using the adaptive cloud as a directional bias layer
