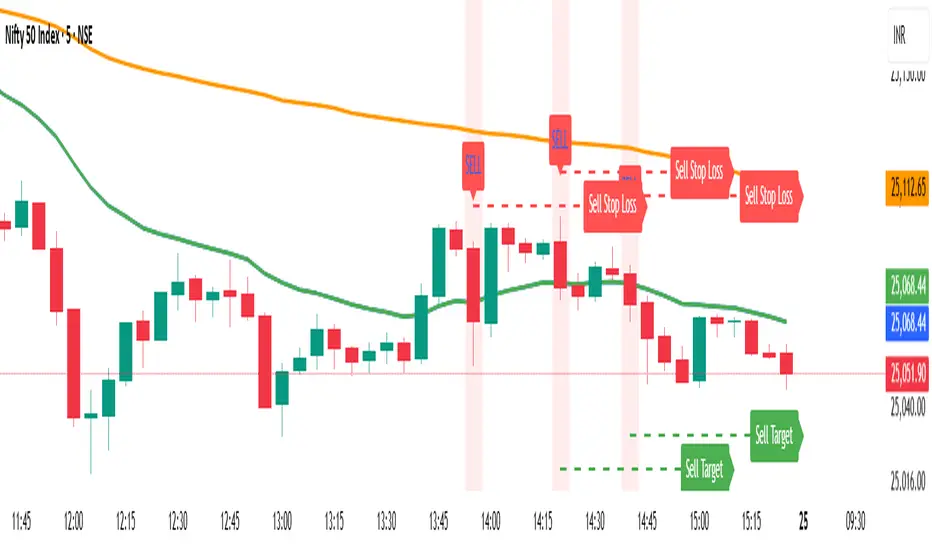
EMA 20 and Anchored VWAP with Typical PriceIntraday scalping using EMA 20 and VWAP along with targets and Stoploss
חפש סקריפטים עבור "黄金近20年走势"
10/20 MA Coil: Progressive Colors & Multi-Day BreakoutThis indicator detects price “coil” setups and highlights potential breakout or breakdown opportunities using moving average alignment and volatility compression.
Features:
• Coil Detection:
• Identifies consolidation when:
• The 10 and 20 MAs are tightly aligned (within user-defined tolerance)
• Price is above both MAs and within 1.5x ADR of them
• The 50 MA is rising
• Progressive Coil Coloring:
• Coil candles are colored in progressively darker orange as the streak continues
• Bullish Breakout Signal:
• Triggers when a green candle follows a coiled bar
• The candle’s body must be greater than or equal to 1 ATR
• Colored lime green
• Bearish Breakdown Signal:
• Triggers when a red candle follows a coiled bar
• The candle’s body must be greater than or equal to 1 ATR to the downside
• Colored black
• Custom Candle Rendering:
• Candle body color represents coil or breakout state
• Wick and border are red or green to reflect price direction
• Optional Debug Tools:
• Coil streak, ATR, and distance from MAs can be plotted for deeper analysis
This script is designed for traders looking to spot price compression and prepare for high-probability moves following low-volatility setups.

Mark specific candle (e.g. bar 20)This Pine Script indicator, "Mark specific candle (e.g. bar 20)" (short title "Mark candle"), is a simple yet powerful tool to visually highlight a particular candle on your chart.
What it does:
It marks a specific candle (e.g., the 20th, 10th, or any number you choose) counting backwards from the most recent candle on your chart. The marked candle will be colored in a subtle light grey and also feature a tiny, matching grey arrow pointing down from above it.
Why it's useful:
This indicator helps you quickly identify and track a consistent reference point in recent price action. It's great for strategies that depend on fixed look-back periods or for simply keeping an eye on a specific historical candle's position as new data comes in.
Key Features:
Adjustable Candle Number: Easily change which candle is marked (e.g., 20th, 10th, 5th) directly from the indicator settings using the "Candle Number to Mark (from end)" input.
Clear Visuals: Both the candle color and a small arrow provide a subtle, yet effective, visual cue.
How to use:
Simply add this script to your TradingView chart. Then, open the indicator's settings to set your desired candle number.

EMA 10/20/50 Alignment Strategy### 📘 **Strategy Name**
**EMA 10/20/50 Trend Alignment Strategy**
---
### 📝 **Description (for Publishing)**
This strategy uses the alignment of Exponential Moving Averages (EMAs) to identify strong bullish trends. It enters a long position when the short-term EMA is above the mid-term EMA, which is above the long-term EMA — a classic sign of trend strength.
#### 🔹 Entry Criteria:
* **EMA10 > EMA20 > EMA50**: A bullish alignment that signals momentum in an upward direction.
* The strategy enters a **long position** when this alignment occurs.
#### 🔹 Exit Criteria:
* The long position is closed when the EMA alignment breaks (i.e., the trend weakens or reverses).
#### 🔹 Additional Features:
* Includes a **date range filter**, allowing you to backtest the strategy over a specific period.
* Uses **100% of available capital** for each trade (position size auto-scales with account balance).
* No short positions, stop loss, or take profit are applied — this is a trend-following strategy meant to ride bullish moves.
---
### ✅ Best For:
* Traders looking for a **simple, trend-based entry system**
* Testing price momentum strategies during specific market regimes
* Visualizing EMA stacking patterns in historical data

Velez Price Action Signals (with 20 & 200 SMA)Velez Price Action Signals – With 20 & 200 SMA Overlay
This TradingView Pine Script is a clean and powerful reversal signal tool inspired by Oliver Velez’s price action philosophy, enhanced with trend context via two Simple Moving Averages.
🔍 Signal Logic
Buy Signal:
Current candle sweeps below the previous 5-bar low (liquidity grab).
Candle is bullish (close > open).
The lower wick is significantly larger than the body (e.g. ratio > 1.5).
Sell Signal:
Current candle sweeps above the previous 5-bar high.
Candle is bearish (close < open).
The upper wick is significantly larger than the body.
Signals appear as BUY/SELL labels on the chart (non-repainting).

HMA 200 + EMA 20 Crossover StrategyThis strategy combines a long-term trend filter using the Hull Moving Average (HMA 200) with a short-term entry trigger using the Exponential Moving Average (EMA 20).
📈 Entry Logic:
Buy Entry: When price is above the HMA 200 and crosses above the EMA 20.
Sell Entry: When price is below the HMA 200 and crosses below the EMA 20.
The strategy closes the current position and reverses on the opposite signal.
⚙️ Strategy Settings (Backtest Configuration):
Position size: 10% of equity per trade
Commission: 0.1% per trade (to simulate broker fees)
Slippage: 2 ticks (to reflect realistic fill conditions)
✅ Purpose:
This script is designed to identify high-probability trades in the direction of the overall trend, avoiding whipsaw conditions. It is useful for traders looking for a dynamic crossover-based system that filters trades based on longer-term momentum.
🔎 Make sure to test across multiple assets and timeframes. For best results, apply this strategy to liquid trending markets like major FX pairs, indices, or high-cap stocks.

Moyenne des EMA (5, 9, 20, 50, 100, 200)La moyenne des EMA 5,9,20,50,100,200 haut, bas, ouverture ou fermeture pour le calcul.

Multi-Asset Ratio (20 vs 5) - LuchapThis indicator calculates and displays the ratio between the sum of the prices of several base assets and the sum of the prices of several quote assets. You can select up to 20 base assets and 5 quote assets, and enable or disable each asset individually to refine your analysis. This ratio allows you to quickly evaluate the relative performance of different groups of assets.
SMA 10/20 Trend Info Table - QullamaggieThe Qullamaggie Index Trend Filter is a momentum-based technical indicator designed to identify strong bullish or bearish trends in the market by analyzing the relationship and movement of two simple moving averages (SMAs): the 10-period SMA and the 20-period SMA. It simplifies trend analysis and provides clear visual cues for traders to align their trades with the prevailing market direction.

BTC Top Indicator - Extension from 20 Week SMA (Normalized)This Indicator calculates the logarithmic deviation of the BTCUSD price from its 20-week SMA and dynamically normalizes it between a lower signal line (-0.57) and an upper trendline defined by two historical points (May 30, 2011, at 1.75 and March 4, 2024, at 0.45).
The indicator line color changes dynamically:
green below 0
blue at 0.5
red above 1
Ideal for analyzing BTCUSD on the Index chart to identify potential overbought or oversold levels. It's better suited for identifying tops, than bottoms.

EMA 20/50/100/200 PricesDescription:
Introducing the EMA Indicator with Dynamic Labels, a unique addition to the TradingView Public Library. This innovative script enhances trend analysis and decision-making by overlaying four Exponential Moving Averages (EMAs) – 20, 50, 100, and 200 periods – on your chart, each with a distinct color for quick identification.
What sets this script apart?
Unlike standard EMA indicators, this script includes dynamic labels that display the current price level of each EMA at the latest price bar. This feature provides an instant snapshot of market sentiment, offering insights into potential dynamic support or resistance levels.
Key Features:
Customizable EMA Periods: Tailor the EMA periods according to your trading strategy, allowing for flexibility across different timeframes and assets.
Adaptive Label Sizes: A unique function adjusts label sizes based on user input, ensuring optimal readability across various display settings.
Color-Coded EMAs: Quickly differentiate between the EMAs with pre-defined colors, enhancing visual clarity and trend recognition.
How to Use:
Trend Analysis: Use the EMAs to identify the overall market trend. When shorter EMAs are above longer ones, it suggests a bullish trend, and vice versa.
Trade Entries and Exits: Look for crossovers of the EMAs as potential entry or exit signals. Dynamic labels will help you pinpoint the exact levels.
Customization: Adjust the EMA periods and label sizes under the indicator settings to match your trading style and preferences.
Underlying Concepts:
This script utilizes the classic EMA calculation but innovates by integrating dynamic, real-time labels and customizable periods. The choice of four different periods allows for a nuanced analysis of trend strength and direction, catering to both short-term traders and long-term investors.
Originality and Contribution:
The "Advanced EMA Indicator with Dynamic Labels" is original in its approach to providing real-time, actionable data through dynamic labels. It caters to the community's need for more interactive and informative indicators that go beyond basic trend analysis.
Conclusion:
Whether you're a novice trader seeking to understand market trends or an experienced investor looking for nuanced analysis tools, this script offers valuable insights and flexibility. It stands as a testament to the power of Pine Script in creating practical, user-centric trading tools.
EMA 20/50/100/200 [NT-DIGITALS]This script plots Exponential Moving Averages (EMA) of 20, 50, 100, and 200 periods on the chart. EMAs are commonly used by traders to identify trends and potential reversal points in the market. The EMA smooths out price data to create a single line that follows the overall trend more closely than a simple moving average. By plotting multiple EMAs of different periods, traders can observe the interaction between short-term and long-term trends, aiding in decision-making for entry and exit points.
Exponential Moving Average (EMA) is a type of moving average that gives more weight to recent price data, making it more responsive to current price movements compared to a simple moving average (SMA). The EMA is calculated by applying a smoothing factor to the previous EMA value and adding a fraction of the difference between the current price and the previous EMA value. This weighting mechanism results in EMAs reacting more quickly to price changes, making them popular for traders looking to capture short-term trends in the market.
TSF 20What kind of traders/investors are we?
We are trend followers. We look for assets that are outperforming the market. Our scripts are designed to be used on the higher timeframes (weekly/daily) to catch the large moves/trends in the market.
Our scripts have been designed to help you follow the trend in an asset.
What does this script do?
This script is designed to colour candles on a chart based on their position relative to two sets of Bollinger Bands. Here's a breakdown of how it functions:
Bollinger Bands Setup:
The script uses two sets of Bollinger Bands, both with a length of 20 and based on the closing prices of candles.
The first set of Bollinger Bands uses a standard deviation (StdDev) of 1.
The second set uses a standard deviation of 2.
Neither set of bands is displayed on the chart.
Coloring Candles:
Green Candle: A candle is coloured green if its close is above the upper Bollinger Band with StdDev 1 but below the upper Bollinger Band with StdDev 2. This indicates a moderately bullish sentiment.
Dark Green Candle: A candle is colored dark green when its close is above the upper Bollinger Band with StdDev 2. This implies a stronger bullish sentiment.
Red Candle: A candle is coloured red if its close is below the lower Bollinger Band with StdDev 1 but above the lower Bollinger Band with StdDev 2. This indicates a moderately bearish sentiment.
Dark Red Candle: A candle is colored dark red if its close is below the lower Bollinger Band with StdDev 2, indicating a stronger bearish sentiment.
Grey Candle: A candle is coloured grey if it closes between the upper and lower Bollinger Bands with StdDev 1. This usually signifies a neutral market condition or periods of consolidation.
In summary, this script is an analytical tool that visually represents the market's bullishness or bearishness relative to the Bollinger Bands, without displaying the bands themselves. It's designed to help investors quickly assess market conditions and sentiment based on the colour-coded representation of price action in relation to these volatility bands.
What makes this script unique?
Innovative Color-Coding System: Candles are colored in varying shades of green and red, providing an immediate visual cue about the market's bullish or bearish tendencies. A neutral grey is also used, offering a quick assessment of market indecision or consolidation phases.
Dual Bollinger Band Analysis: Utilizes two sets of Bollinger Bands (StdDev 1 and StdDev 2) to gauge market volatility and sentiment. This dual-band approach enhances the precision of sentiment analysis compared to using a single standard deviation.
Customizable and Non-Obtrusive: Designed to keep your charts clean and readable. The Bollinger Bands themselves are not displayed, reducing visual clutter and allowing for a focus on price action.
Versatile and Adaptable: Suitable for various trading styles and timeframes. Whether you are a short-term or long-term investor, this indicator can be seamlessly integrated into your analysis toolkit.
Valuable Addition to Market Analysis: Enhances traditional candlestick analysis and complements other technical indicators and strategies. It offers an additional layer of understanding market dynamics and can be used to confirm or question other signals.
How It Adds Value:
Enhanced Visual Analysis: By colour-coding candles based on Bollinger Band positioning, it simplifies the interpretation of market sentiment and volatility, making it easier to spot trends and reversals.
Strategic Decision Making: Helps traders make more informed decisions by clearly highlighting bullish and bearish strength, or lack thereof, in the market.
Time Efficiency: Reduces the time spent analyzing charts by providing an immediate visual representation of market conditions.
Originality: Offers a fresh perspective and an innovative approach to using Bollinger Bands, making it a unique addition to the community's toolbox.

9-20 sma multi timeframe indicatorThis is an indicator to help visualizing the 9 and the 20 sma on 3 different timeframes.
When they cross, you will see a cross on the band representing the timeframe.
When a trade is favorable the band will color in green for up trend and in red for downtrend:
- Conditions in uptrend: Start after the first green candle closed above the 9 sma, Stop after the first red candle closed under the 9 sma
- Conditions in downtrend: Start after the first red candle closed below the 9 sma, Stop after the first green candle closed above the 9 sma
Adjusted Volume - 20 to 18-dayScript based off the definition Adjusted Volume means the sum of trading volume for a period of 20 consecutive trading days ending on the day preceding the date of determination; provided, however, that the day with the highest volume and the day with the lowest volume shall be eliminated and only the remaining 18 days summed.

LuizinTradezone - 9 MME + 20,50,200 MMAScript que inclui a média móvel de 9 (exponencial), e as médias aritméticas de 20, 50 e 200
Simple and Exponential Moving Averages (20, 50, 200)Displays the 20, 50, and 200 simple and exponential moving averages in 1 indicator.
Simple Moving Averages (20, 50, 200)Allows you to plot 20 day, 50 day, and 200 day simple moving averages using only 1 indicator.
ln(close/20 sma) adjusted for time (BTC)(This indicator was designed for the BTC index chart)
Designed for Bitcoin. Plots the log of the close/20W SMA with a linear offset m*t, where m is the gradient I've chosen and t is the candle index. Anything above 1 is a mania phase/market cycle top. If it peaks around 0.92 and rolls over, it could be a local/market cycle top.
This will obviously not work at all in the long term as Bitcoin will not continue following the trend line on the log plot (you can even see it start to deviate in the Jan-Feb 2021 peaks where the indicator went to 1.15).
It identifies the 2011, 2013 (both of them), 2017 tops as being just above 1. It also identifies the 2019 local peak and 2021 market cycle top at ~0.94.
Feel free to change the gradient or even add a function to curve the straight line eventually. I made this for fun, feel free to use it as you wish.

Ribbon % OF stocks above 20/50/100/200 DayMA S&P500Moving average ribbon of % stocks above 20/50/100/200 Day moving average in th S&P500. Directional color. Pretty good indicator for big bottoms. Tops - not so much. use 1D timeframe.

Simple Moving Averages (10 & 20 & 50 & 200) for ScalpingSimple Moving Averages for Scalping (10 / 20 / 50 / 200 SMAs)

EMA 9 & 20 Cross StrategyThis is for 9 and 20 Exponential Moving Averages to identify buy and sell opportunities
