Enterprise Digital Clock Pro# Enterprise Digital Clock Pro - User Documentation
## Overview
Enterprise Digital Clock Pro is a professional-grade trading indicator designed to provide real-time global market session monitoring directly on your chart. This comprehensive tool helps traders stay synchronized with international market hours, track multiple trading sessions simultaneously, and receive timely alerts for market transitions.
## Purpose & Benefits
### Why Use This Indicator?
- **Global Market Awareness**: Monitor up to 8 major financial markets simultaneously
- **Real-Time Updates**: Live clock with second-by-second precision
- **Session Management**: Know exactly when markets open, close, or enter pre/post-market sessions
- **Time Zone Flexibility**: Automatically handles time zone conversions
- **Professional Visualization**: Enterprise-grade display with multiple theme options
- **Trading Efficiency**: Never miss important market openings or closings with alert notifications
### Who Should Use This Indicator?
- International traders managing positions across multiple markets
- Day traders focusing on specific session overlaps
- Institutional traders requiring professional market monitoring
- Anyone trading across different time zones
- Traders seeking better timing for entry and exit points
## Features
### Core Functionality
1. **Real-Time Digital Clock**: Displays current time in your selected timezone with live updates
2. **Multi-Market Dashboard**: Track 8 major global markets simultaneously
3. **Market Status Indicators**: Visual indicators showing:
- LIVE (Market Open)
- CLOSED (Market Closed)
- PRE (Pre-Market)
- POST (After-Hours)
- WKND (Weekend)
4. **Time Until Change**: Shows remaining time until market opens or closes
5. **Alert System**: 5-minute warnings before market transitions
6. **Professional Themes**: Multiple pre-configured color schemes
## Configuration Guide
### 🎨 Theme Settings
#### Theme Preset
Choose from professionally designed themes:
- **Dark Professional**: Modern dark theme with high contrast (Default)
- **Light Corporate**: Clean, bright theme for well-lit environments
- **Bloomberg Terminal**: Classic financial terminal appearance
- **Trading Floor**: Professional trading desk aesthetic
- **Custom**: Create your own color scheme
### ⏰ Clock Settings
#### Local Timezone
Select your preferred timezone from extensive global options. The indicator supports all major financial centers including:
- Americas (New York, Chicago, Los Angeles, Toronto, São Paulo, etc.)
- Europe (London, Frankfurt, Paris, Madrid, Bucharest, etc.)
- Asia-Pacific (Tokyo, Shanghai, Hong Kong, Singapore, Sydney, etc.)
**Default**: Europe/Bucharest
#### Dashboard Position
Choose where the clock appears on your chart:
- Top Right (Default)
- Top Left
- Bottom Right
- Bottom Left
- Top Center
- Bottom Center
#### Clock Text Size
Adjust the main clock display size:
- Small
- Normal
- Large (Default)
#### Market Text Size
Control the size of market information text:
- Small
- Normal (Default)
- Large
### ✨ Visual Enhancements
#### Enable Gradient Effects
Adds subtle gradient transitions to enhance visual appeal
- **Default**: Enabled
#### Enable Shadow Effects
Creates depth with shadow effects for better readability
- **Default**: Enabled
#### Enable Animated Status Indicators
Provides dynamic visual feedback for market status changes
- **Default**: Enabled
#### Corner Radius
Adjust the roundness of dashboard corners (0-5)
- **Default**: 2
#### Border Style
Select the dashboard border appearance:
- None
- Subtle (Default)
- Professional
- Bold
### 🎨 Custom Colors
*Only active when "Custom" theme is selected*
- **Header Background**: Background color for the clock header
- **Header Text**: Text color for the clock display
- **Body Background**: Background color for market information
- **Body Text**: Text color for market listings
- **Accent Color**: Highlight color for important elements
- **Market Open**: Color indicating open markets
- **Market Closed**: Color indicating closed markets
- **Warning/Pre-Market**: Color for warnings and pre-market sessions
### 🌏 Market Display
Toggle visibility for each market:
- **Show Tokyo Market** (Default: On)
- **Show Shanghai Market** (Default: On)
- **Show Hong Kong Market** (Default: On)
- **Show Sydney Market** (Default: On)
- **Show London Market** (Default: On)
- **Show Frankfurt Market** (Default: On)
- **Show Bucharest Market** (Default: On)
- **Show NY Market** (Default: On)
- **Show Time Until Open/Close** (Default: On)
### Market Session Settings
Configure trading hours for each market in 24-hour format (HHMM-HHMM):
#### 🇯🇵 Tokyo Session
- **Trading Hours**: Set Tokyo Stock Exchange hours
- **Default (Winter)**: 0200-0800 (Bucharest time)
#### 🇨🇳 Shanghai Session
- **Trading Hours**: Set Shanghai Stock Exchange hours
- **Default (Winter)**: 0330-0900 (Bucharest time)
#### 🇭🇰 Hong Kong Session
- **Trading Hours**: Set Hong Kong Stock Exchange hours
- **Default (Winter)**: 0330-1000 (Bucharest time)
#### 🇦🇺 Sydney Session
- **Trading Hours**: Set Australian Securities Exchange hours
- **Default (Winter)**: 0100-0700 (Bucharest time)
#### 🇩🇪 Frankfurt Session
- **Trading Hours**: Set Frankfurt Stock Exchange hours
- **Default**: 0900-1830 (Bucharest time)
#### 🇷🇴 Bucharest Session
- **Trading Hours**: Set Bucharest Stock Exchange hours
- **Default**: 0930-1600 (Bucharest time)
#### 🇬🇧 London Session
- **Trading Hours**: Set London Stock Exchange hours
- **Default**: 1000-1830 (Bucharest time)
#### 🇺🇸 New York Session
- **Trading Hours**: Set NYSE/NASDAQ hours
- **Default**: 1630-2300 (Bucharest time)
## Usage Instructions
### Initial Setup
1. Add the indicator to your chart
2. Select your local timezone in Clock Settings
3. Choose your preferred theme or customize colors
4. Select which markets you want to monitor
5. Adjust display position and text sizes to your preference
6. Configure session times if different from defaults
### Reading the Display
The dashboard shows:
- **Top Row**: Current time in your selected timezone
- **Date Row**: Current date and timezone information
- **Market Rows**: Each selected market displays:
- Country flag
- Market name
- Status indicator (LIVE/CLOSED/PRE/POST/WKND)
- Current local time in that market
- Time until next status change (optional)
- **Footer**: Summary of active markets
### Status Indicators Explained
- **● LIVE**: Market is currently open for trading
- **○ CLOSED**: Market is closed
- **◐ PRE**: Pre-market session (1 hour before open)
- **◑ POST**: After-hours session (1 hour after close)
- **◉ WKND**: Weekend (market closed)
### Alert System
The indicator automatically generates alerts:
- 5-minute warning before market opening
- 5-minute warning before market closing
- Alerts appear once per bar to avoid spam
## Best Practices
### For Day Traders
- Focus on markets relevant to your trading pairs
- Use the "Time Until Change" feature to prepare for volatility
- Set alerts for session overlaps (highest liquidity periods)
### For Swing Traders
- Monitor major market opens for gap opportunities
- Track after-hours activity in relevant markets
- Use weekend status to plan Monday strategies
### For International Traders
- Keep all markets visible for complete global overview
- Adjust session times for daylight saving changes
- Use Custom theme to match your trading platform
## Troubleshooting
### Common Issues & Solutions
**Clock not updating:**
- Ensure your chart is on a live/real-time data feed
- Refresh your chart or switch timeframes
**Incorrect market status:**
- Verify session times are correctly configured
- Check if daylight saving time affects your settings
- Ensure weekend detection is working properly
**Display issues:**
- Try different position settings if overlapping with price action
- Adjust text sizes for better visibility
- Switch themes for better contrast
**Time zone confusion:**
- All session times should be entered in your local timezone
- The indicator automatically handles conversions
- Verify your selected timezone matches your actual location
## Tips for Optimal Use
1. **Session Overlap Trading**: The most volatile and liquid periods occur when major sessions overlap
2. **Pre-Market Preparation**: Use PRE status to prepare for market opens
3. **Weekend Planning**: Review weekly performance when all markets show WKND
4. **Mobile Trading**: Choose larger text sizes for mobile device visibility
5. **Multi-Monitor Setup**: Position dashboard on secondary monitors using corner options
## Performance Notes
- The indicator updates in real-time without requiring chart refreshes
- Minimal resource usage ensures smooth chart performance
- Compatible with all timeframes and chart types
- Works seamlessly with other indicators
## Conclusion
Enterprise Digital Clock Pro transforms your trading chart into a professional command center for global market monitoring. Whether you're trading forex during London-New York overlap, catching the Asian session, or monitoring international equities, this indicator ensures you're always synchronized with global markets.
Stay informed, trade professionally, and never miss important market transitions with Enterprise Digital Clock Pro.
Session

Opening Range HarmoniX
This is an all-in-one, modular toolkit designed for intraday traders, especially those focusing on the New York session. It combines a fully customizable Opening Range (OR) with a suite of essential indicators (Moving Average, VWAP, Supertrend, and Pivots) to provide a complete and clean view of the market.
All modules (indicators) can be toggled on or off individually, and the entire settings menu is fully translated in both English and Farsi (Persian).
Key Features
1. Customizable Opening Range (OR):
Range Timeframe: Set your OR timeframe (5, 15, or 30 min).
Precise Start Time: Define the exact start hour and minute (default 9:30 NY Time).
Key Levels: Includes OR High, OR Low, and a crucial Mid Line for price equilibrium.
Extension Method: Choose how lines extend: "Until NY Session Close" (16:00) or for a fixed "Number of Bars".
Full Styling: Complete control over color, width, and line style (solid, dashed, dotted) for all levels.
2. Dynamic Day Label:
Automatically displays the day of the week (in English or Farsi) and the selected OR timeframe (e.g., "Monday - 15m") at the start of the range.
3. Built-in Indicator Suite (All Toggleable):
Moving Average (MA):
Multiple Types: Choose from SMA, EMA, WMA, HMA, or VWMA.
Dynamic Coloring: MA line color automatically changes based on its upward (Uptrend) or downward (Downtrend) slope.
VWAP (Daily):
Features similar dynamic coloring to quickly identify the intraday trend bias.
Supertrend:
A classic trend-following tool with customizable ATR Period and Factor.
Dynamic trend-based coloring (uptrend/downtrend).
Pivot Points:
Classic high/low pivots with customizable lookback periods (left/right) to spot key turning points in the market.
💡 Core Concept
Use the Opening Range levels (High, Low, and Mid) as primary support/resistance and to establish the bias for the day. Then, use the additional indicators (MA, VWAP, Supertrend) to confirm trend direction and identify entry/exit opportunities in relation to the OR levels.

Killzone Session High/Low Levels [SmartFoxy]Killzone Session High/Low Levels
The Killzone Session High/Low Levels indicator by SmartFoxy provides a complete intraday framework for understanding session-based liquidity, market structure rotation, and breakout behavior across global trading sessions.
It automatically plots the High/Low ranges for each selected session, highlights session killzones, and tracks breakout events with optional alerts.
This tool is designed for traders who rely on session dynamics (Asia, Frankfurt, London, New York) to identify liquidity targets, sweep zones, key ranges, and continuation/reversal opportunities.
________________________________________
How It Works
The indicator detects the active trading sessions for each day and builds structural High/Low ranges for them:
• Asia Session Range (High/Low);
• Frankfurt Session Range;
• London Session Range;
• New York Session Range;
• Optional custom session (NY Open, or any killzone).
For each session, the script can display:
• Session box or column;
• High/Low levels;
• Labels for every range (H/L);
• True session boundaries using user-defined timezone;
• Auto-extended levels up to the latest candle;
• Break levels after a breakout;
• Conditional removal or recoloring after a level is breached.
This gives traders a clean visual map of session liquidity and how price interacts with it throughout the day.
________________________________________
Key Features
1. Multiple Global Sessions •➤ Asia, Frankfurt, London, New York, plus one custom session for advanced killzone mapping.
2. Session High/Low Liquidity Levels •➤ Automatic plotting of every session’s High and Low, with optional labels and price markers.
3. Session Boxes or Columns •➤ Two display modes allow traders to visualize the session either as a filled box or a clear vertical column.
4. Breakout Logic & Temporary Levels .
When price breaks a session High/Low:
• Levels can be extended for a selected number of bars
• Or removed instantly after a breakout
• Or recolored to highlight the sweep event
This enables clean identification of liquidity grabs, breakouts, and continuation setups.
5. Alerts for Session Breakouts .
Set alerts when price breaks:
• Any session level
• Only levels formed on the current day
Perfect for traders who want real-time notifications of sweeps or key structure breaks.
6. Full Customization
You can configure:
• Session times;
• Timezone;
• Colors;
• Labels;
• Line styles and widths;
• Breakout behavior;
• Killzone range handling.
Everything is adjustable to match any trading style.
________________________________________
How to Use
1. Enable the sessions you want to track •➤ Asia, Frankfurt, London, New York, or custom.
2. Choose display mode
Box mode for visual range blocks;
Column mode for clean vertical alignment.
3. Enable High/Low Levels .
These act as liquidity magnets and key rejection zones.
4. Turn on Breakout Levels (optional)
Useful for spotting sweeps and continuation setups.
5. Turn on Alerts if you want notifications when price breaks levels.
6. Use session levels as liquidity reference points .
They work exceptionally well with smart money concepts (SMC), ICT, and intraday structure analysis.
________________________________________
Why This Indicator Is Useful
Shows exactly where liquidity is placed each session;
Highlights market structure transitions as sessions hand over control;
Helps identify stop hunts, sweeps, reversals, and continuation patterns;
Provides real-time alerts for structural breaks;
Organizes the chart and reduces noise;
Works with any intraday timeframe and any market.
This makes it valuable for scalpers, day traders, and SMC/ICT-style analysts.
________________________________________
Summary
Killzone Session High/Low Levels delivers a complete, highly customizable intraday mapping system based on global trading sessions.
It clarifies the session structure, reveals liquidity targets, and empowers traders to make confident trading decisions using clean, objective market data.

AEON | Liquidity HunterA visual tool for identifying high-probability liquidity zones across multiple timeframes and sessions.
Overview
Liquidity Hunter is a multi-timeframe, all market tool designed to help traders visualise areas where price may be drawn in search of resting liquidity. These liquidity zones often align with swing highs and lows, session extremes, or significant higher-time-frame reference points.
Rather than producing entry or exit signals, this indicator aims to support market behaviour analysis and contextual awareness.
Core Functions
The indicator identifies potential liquidity areas using four optional methods:
1. Current Time Frame Analysis – Automatically locates swing highs and lows based on a customisable setting for sensitivity and lookback depth.
2. Higher Time Frame Analysis – Uses the same logic as above, but projects liquidity zones from a selected higher time frame (HTF).
3. Session Highs & Lows – Highlights the Asian, London, New York, or user-defined session extremes where liquidity commonly pools.
4. Time-Based Highs & Lows – Marks the final bar of any higher time frame (for example, the last H4 or D1 candle) to show potential liquidity reference points.
Each method can be enabled or disabled independently and visually customised, allowing traders to tailor the display to their preferred style and time frame.
How to Use
When applied, the indicator plots horizontal levels representing potential liquidity pools. These levels persist until price engages with or mitigates them, at which point users can opt to modify their visual style or delete them as preferred.
Adjusting the sensitivity of the current and higher time frame levels may reflect the market's likelihood of treating them as targets or reversal points.
Many traders combine these levels with concepts such as market structure shifts, displacement, or fair-value gaps to build a narrative around price behaviour.
Disclaimer
This indicator is provided for educational and informational purposes only. It does not constitute financial advice or a trade signal. Past performance or visual confluence does not guarantee future results.
---
About the Author
Created by a passionate developer focused on algorithmic and quantitative concepts.
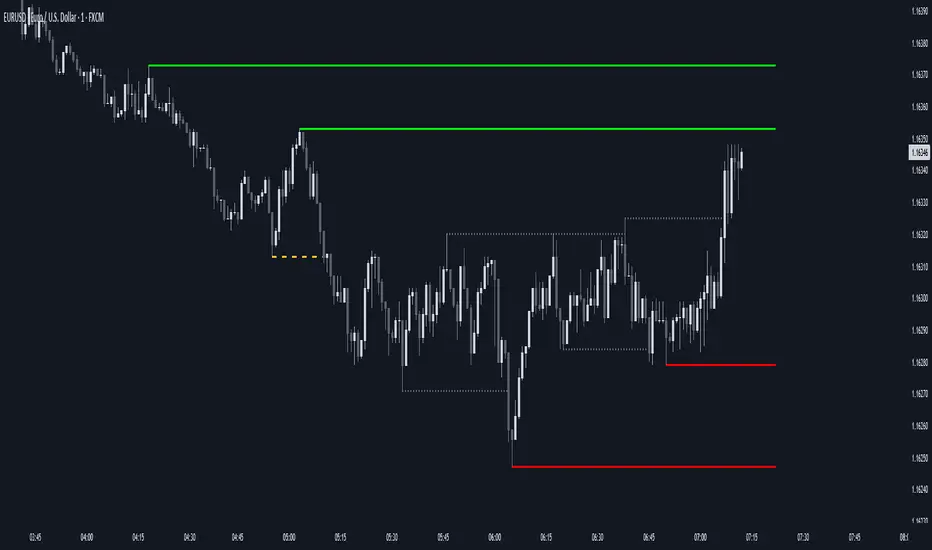
IB SessionsMarks the initial balance of each session (first hour).
Also the weekly IB is marked (first asian session)
Breakout lines for each session to determine possible breakouts on the session.

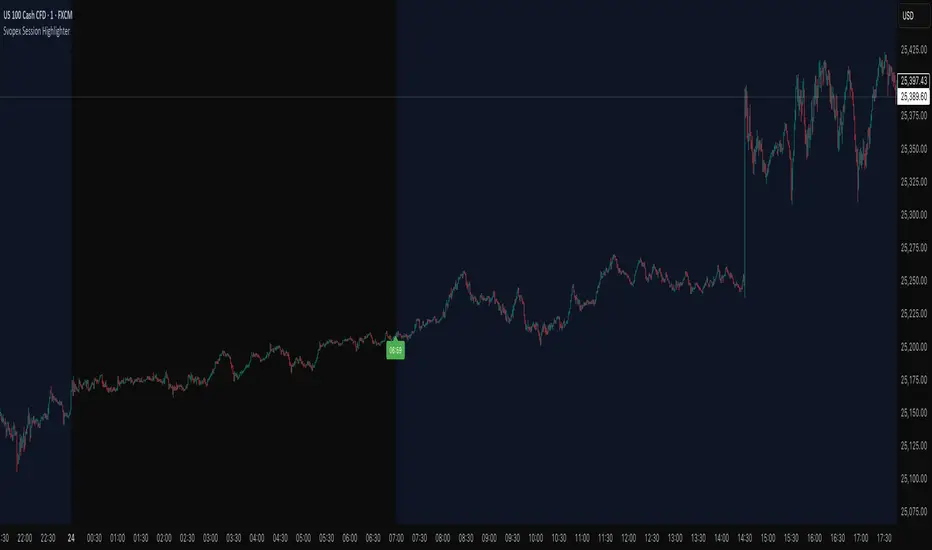
Svopex Session Highlighter# Session Highlighter
## Description
**Session Highlighter** is a powerful Pine Script indicator designed to visually identify and mark specific trading hours on your chart. This tool helps traders focus on their preferred trading sessions by highlighting the background during active hours and marking the session start with customizable visual markers.
## Key Features
- **📊 Session Background Highlighting**: Automatically shades the chart background during your defined trading hours (default: 7:00 - 23:00)
- **🎯 Smart Session Start Marker**: Places a marker on the last candle before session start, intelligently adapting to your timeframe:
- 1 Hour chart: Marker at 6:00
- 15 Minute chart: Marker at 6:45
- 5 Minute chart: Marker at 6:55
- 1 Minute chart: Marker at 6:59
- **🌍 Timezone Support**: Choose from multiple timezones (Europe/Prague, Europe/London, America/New_York, UTC)
- **🎨 5 Marker Styles**: Customize your session start indicator:
- Triangle
- Circle
- Diamond
- Label with time text
- Vertical line
- **⚙️ Fully Customizable**: Adjust start/end hours, timezone, and marker style through simple settings
## Settings
- **Start Hour**: Set your session start time (0-23)
- **End Hour**: Set your session end time (0-23)
- **Timezone**: Select your trading timezone
- **Marker Style**: Choose your preferred visual marker
## Use Cases
- Identify London/New York trading sessions
- Mark Asian session hours
- Highlight your personal trading windows
- Avoid trading during off-hours
- Perfect for day traders and scalpers
## Installation
1. Copy the Pine Script code
2. Open TradingView Pine Editor
3. Paste the code and click "Add to Chart"
4. Configure settings to match your trading schedule
Major Trading Sessions IndicatorsThis indicator displays vertical lines on your chart to mark the opening times of the major global trading sessions (Tokyo, Shanghai/HK, London, and New York). As a crypto trader I want to find price action patterns after sessions open.
It's fully customizable and extendable (you could add closing time for sessions as well)
Works best on short timeframes.
Features:
6 configurable vertical lines (4 preset for major sessions + 2 custom)
Each line shows a customizable label (e.g., "Tokyo", "London")
Individual time and color settings for each line
UTC offset for each line to handle Daylight Saving Time
Option to fix all labels at a specific price level for cleaner appearance (need to set and save it for each chart, it becomes a mess if you don't). Default behavior and limit of Pine Script is that it will be attached to the price wick.
Default Sessions:
Tokyo: 00:00 UTC (midnight)
Shanghai/HK: 01:30 UTC
London: 08:00 UTC (winter) - adjust offset to +1 for summer
New York: 13:00 UTC (winter) - adjust offset to -4 for summer
DST Adjustments:
Simply change the UTC offset when daylight saving time begins/ends:
London: 0 (winter) or +1 (summer)
New York: -5 (winter) or -4 (summer)
Lines extend from top to bottom of the chart and appear precisely when each session opens.
My preferred configuration: shorten names and reduce opacity of colors to 20-30%.

Daily Vertical LineThis indicator draws vertical lines at a specific time each day, helping you visualize important intraday levels or session opens/closes.
Features:
Customizable time in EST timezone (hour and minute inputs)
Adjustable line color, width, and style (solid, dashed, or dotted)
Automatically draws lines for all historical days
Projects one line into the future for the next occurrence
Works on all intraday timeframes. Future line appears as semi-transparent and dashed to distinguish from historical data.

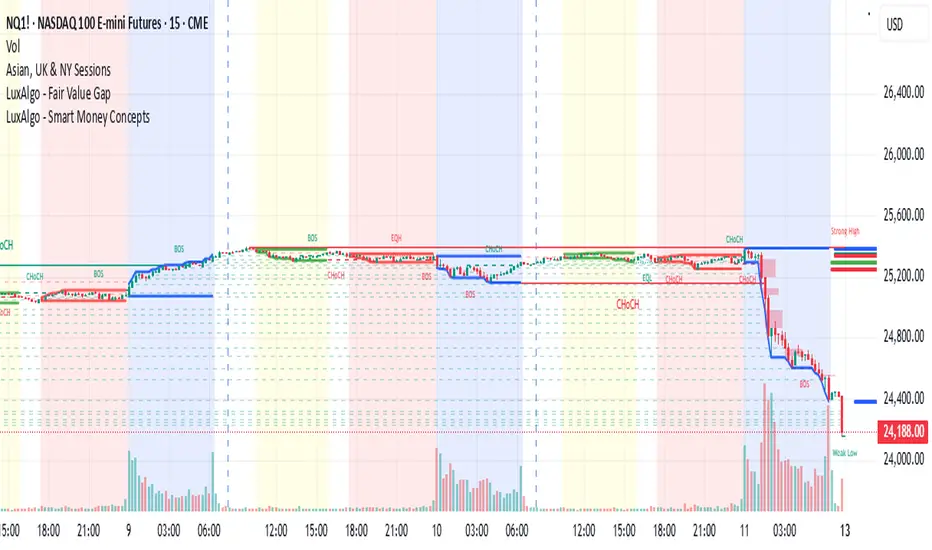
Asian, UK & NY SessionTimes and Day Highs and LowsWhat It Does
The Asian, UK & NY Sessions indicator automatically identifies and highlights the three major global trading sessions on your chart.
For each session, it:
Detects session time in its local timezone.
Tracks the session’s highest and lowest prices.
Plots colored horizontal lines to show those levels throughout the trading day.
Optionally shades each session’s background in its signature color for instant visual context:
🟡 Asian Session: Yellow background
🔴 London Session: Red background
🔵 New York Session: Blue background
This helps traders see how price reacts within and between sessions — spotting overlaps, liquidity zones, and daily ranges.
⚙️ Inputs and Variables
Input Description
Extend lines until next session start (extendLines) Extends each session’s high/low lines forward until the next session begins.
Show prices in scale column (showScaleValues) Controls whether the price labels for session highs/lows appear on the chart’s right-hand price scale.
Show All Session Highs & Lows (showAllHighsLows) Master switch — turn this off to hide all session lines instantly, keeping the chart clean.
Show Session Backgrounds (showBackgrounds) Turns all background shading on or off. When off, all session colors disappear.
Background Opacity (bgOpacityAll) Adjusts the transparency for all session backgrounds (0 = solid, 100 = fully transparent).
🎨 Visual Color Scheme
Session Background High/Low Line
Asian Yellow Green
London Red Red
New York Blue Blue
Each color has a consistent role — making it easy to distinguish sessions even in replay or live view.
Price Tracking:
For each session, the indicator resets High and Low when the new session starts, then updates them as bars print.
Display Control:
If lines or backgrounds are disabled via settings, they’re completely hidden (no clutter, no partial transparency).
💡 How Traders Use It
Identify daily ranges in each global session.
Compare volatility between markets.
Align entries or exits with session transitions.
Observe how price respects previous session highs/lows.
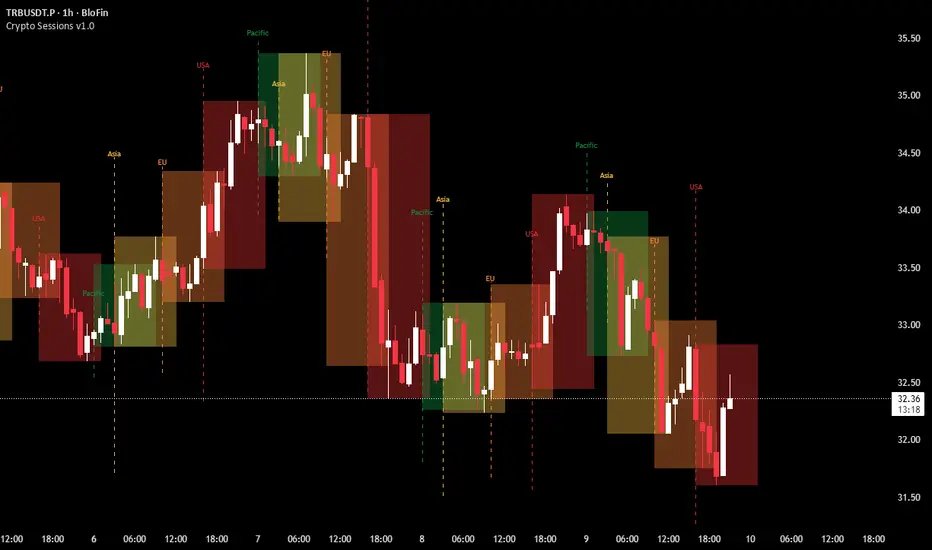
Crypto Sessions v1.0This indicator is designed to visualize and track the four major trading sessions. It highlights the Pacific (Sydney), Asia (Tokyo), EU (London) and USA (New York) sessions each with its own distinct color for easy idenitifition.
At the start of each session the script draws a vertical dashed line in the session's color to mark the beggining, with a simple label floating above. As the session progresses it dynamically creates a semi-transparent box that spans the session's duration. The boxes overlap where sessions coincide.
Forex Session High/Low TrackerThis indicator maps out each Forex session along with their relative highs and lows.

Sessions [Trade Tribe HQ]Color-coded session ranges with ADR% labels to help you trade smarter, not harder.
This tool marks New York, London, Tokyo, and Sydney sessions, showing their ranges, highs/lows, VWAPs, and ADR%.
🔹 Key Features
Colored session boxes (NY, London, Tokyo, Sydney)
Session highs & lows, VWAP, and trendlines
Dashboard showing active sessions, volume, and %ADR
ADR% labels at session close
🔹 How It Helps
Spot session traps, moves, and reversals faster
Manage expectations using ADR% (no chasing over-extended moves)
Identify overlap zones (London → NY) for volatility spikes
Simplify cycle tracking across global markets
Market Sessions Marker—making it easy to see where the energy has been spent and where opportunity is building next.
Created with ❤️ by TraderChick – part of the Trade Tribe HQ community.
If you found this tool useful, check out my profile for more strategies, classes, and resources.

Power Hour Breakout Signals [LuxAlgo]The Power Hour Breakout tool helps traders identify key price levels from the Power Hour and spot breakouts from those levels easily. This tool features Power Hour extensions, Fibonacci levels, and session break marks for the trader's convenience.
🔶 USAGE
The Power Hour is defined as the last hour of the trading session and is set by default from 3:00 p.m. to 4:00 p.m. New York time. During this period, volume and volatility enter the market. Traders using higher timeframes may use this period to enter or exit positions by placing MOC (Market on Close) orders.
This tool highlights the Power Hour and the top and bottom price levels. Each time prices break out from these levels, a signal is displayed on the chart.
We can use the Power Hour to gauge market sentiment:
Bullish sentiment: Price trades above the Power Hour.
Mixed sentiment: Price trades within the Power Hour.
Bearish sentiment: Price trades below the Power Hour.
🔹 Displaying Power Hours and Breakouts
By default, all detected Power Hours are displayed. Traders can manually adjust this number by disabling the "Display All" parameter in the Settings panel.
Breakouts are displayed by default, too, but this feature can be disabled as well.
The chart above shows different configurations of these parameters.
🔹 Power Hour Extensions
Traders can use Power Hour extensions as potential targets for breakout signals.
In the settings panel, traders can select the percentage of the Power Hour price range to use for each extension. For example, 100% uses the full range, 200% uses the range twice, and so on.
As seen on the chart, traders can configure different percentages for the top and bottom extensions.
🔹 Fibonacci Levels
Traders can display default or custom Fibonacci levels on the Power Hour range to identify retracement opportunities and evaluate market movement strength. Each level can be enabled or disabled, as well as customized by level, color, and line style.
For example, as we can see on the chart, prices attempt to break out at the Power Hour top level, then retrace to the 0.618 Fibonacci level, and then rise to the 200% Power Hour top extension.
🔶 SETTINGS
Display Last X Power Hours: Select how many Power Hours to display or enable the Display All feature.
Power Hour (NY Time): Choose a custom Power Hour in New York time.
🔹 Breakouts
Breakouts: Enable or disable breakouts.
Bullish Breakout: Select color for bullish breakouts.
Bearish Breakout: Select color for bearish breakouts.
🔹 Extensions
Top Extension: Enable or disable the top extension and choose the percentage of Power Hour to use.
Bottom extension: Enable or disable the bottom extension and choose the percentage of Power Hour to use.
🔹 Fibonacci Levels
Display Fibonacci: Enable or disable Fibonacci levels.
Reverse: Reverse Fibonacci levels.
Levels, Colors & Style
Display Labels: Enable or disable labels and choose text size.
🔹 Style
Power Hour Colors
Extension Transparency: Choose the extension's transparency. 0 is solid, and 100 is fully transparent.
Session Breaks: Enable or disable session breaks.

ICT Killzones x FVGs @dancizyeaaICT Killzones x FVGs Indicator
Last update: 19-SEP-2025
Creator: dancizyeaa
This indicator targets key session highs and lows combined with Fair Value Gaps (FVGs) visualization on TradingView charts. It integrates multiple market sessions (Asia, London, New York), drawing killzones, session separators, and key price levels with user-configurable alerts and filtering. It supports dynamic timeframe limits, coloring by FVG size, moving averages, and labels.
The ICT Killzones x FVGs indicator highlights major session high and low price zones with added fair value gaps, assisting traders in identifying potential reversal or breakout areas. It automatically draws session lines, pivot points, and dynamically colors FVG rectangles by size. It includes options for timezone offsets, alert setups for pivot breaks, and versatile visual configuration for clear session segmentation and market structure awareness.
Detailed Function Descriptions
Session Time and Date Handling:
Manages time offsets and date components to correctly align session boundaries and day separators considering timezone differences, including a weekday naming system for chart labeling.
FVG Detection and Coloring:
Detects bullish and bearish Fair Value Gaps based on recent candles, calculates gap size, and colors gaps differently if they are small or normal size to highlight relevant market inefficiencies.
Killzone (Session High/Low Zone) Management:
Creates and updates boxes, lines, and labels representing important market session zones from Asia to New York, including the ability to extend or limit these objects across timeframes and manage range averages.
Pivot Points and Midpoint Labels:
Draws session-specific pivot highs/lows and optional midpoint lines with alert conditions when these levels are broken, allowing traders to track and be notified of key market moves.
Session Separators and Open Lines:
Draws vertical and horizontal lines marking daily, weekly, and monthly open prices and session start/end boundaries with customizable styling, enhancing chart structure clarity.
Moving Average Overlay:
Optionally plots a user-defined simple moving average line for trend analysis, with customizable length and color.
Alert System:
Provides user-configurable alerts on pivot breaks and other key events, ensuring timely trading signals.
User Inputs and Settings:
Extensive input options to customize timezone offset, session visibility, line styles, transparency, label sizes and positions, and filter parameters for FVGs for a tailored trading experience.

Sessions Highs/LowsThis indicator plots the High and Low of the three main trading sessions:
Asia (20:00–03:00) – green lines
London (03:00–08:00) – blue lines
New York (08:00–13:00) – red lines
Features:
Levels update in real time during each session.
When a new session starts, the previous lines are deleted – only the latest active sessions remain visible.
Default session times are set to Asia (20:00–03:00), London (03:00–08:00), and New York (08:00–13:00), but you can adjust them to your own custom hours in the settings.
Colors can also be customized.
Use cases:
Quickly visualize session ranges.
Track session highs/lows for breakouts, fakeouts, and reactions around liquidity zones.

Weekly Session BreakThis indicator plots a vertical line at the end of the trading week (Friday) to mark the weekly session break. It is designed to be used on intraday charts (sub-1 hour timeframes).
The line's appearance is fully customizable via the Inputs tab, allowing you to change its color, style (solid, dotted, or dashed), and thickness.
Key Features:
End-of-Week Marker: Accurately draws a vertical line on the last bar of the trading week.
Timeframe Specific: Lines are only visible on intraday charts (1-minute to 59-minute timeframes) to prevent clutter on higher timeframes.
Customizable: Adjust the line's color, style, and thickness from the Inputs menu.

Custom Time Range HighlightThis indicator highlights specific time ranges on your TradingView chart with customizable background colors and labels, making it easier to identify key trading sessions and ICT (Inner Circle Trader) Killzones. It is designed for traders who want to mark important market hours, such as major sessions (Asia, New York, London) or high-volatility Killzones, with full control over activation, timing, colors, and transparency.
Features
Customizable Time Ranges: Define up to 9 different time ranges, including one custom range, three major market sessions (Asia, New York, London), and five ICT Killzones (Asia, NY Open, NY Close, London Open, London Close).
Individual Activation: Enable or disable each time range independently via checkboxes in the settings. By default, only the ICT Killzones are active.
Custom Colors and Transparency: Set unique background and label colors for each range, with adjustable transparency for both.
Labeled Time Ranges: Each active range is marked with a customizable label at the start of the period, displayed above the chart for easy identification.
Priority Handling: If multiple ranges overlap, the range with the higher number (e.g., Asia Killzone over Custom Range) determines the background color.
CET Time Zone: Time ranges are based on Central European Time (CET, Europe/Vienna). Adjust the hours and minutes to match your trading needs.
Settings
The indicator settings are organized into three groups for clarity:
Custom Range: A flexible range (default: 15:30–18:00 CET) for user-defined periods.
Session - Asia, NY, London: Major market sessions (Asia: 01:00–10:00, New York: 14:00–23:00, London: 09:00–18:00 CET).
ICT Killzones - Asia, NY, London: High-volatility periods (NY Open: 13:00–16:00, NY Close: 20:00–23:00, London Open: 08:00–11:00, London Close: 16:00–18:00, Asia: 02:00–05:00 CET).
For each range, you can:
Toggle activation (default: only ICT Killzones enabled).
Adjust start and end times (hours and minutes).
Customize the label text.
Choose background and label colors with transparency levels (0–100).
How to Use
Add the indicator to your chart.
Open the settings to enable/disable specific ranges, adjust their times, or customize colors and labels.
The chart will highlight active time ranges with the selected background colors and display labels at the start of each range.
Use it to focus on key trading periods, such as ICT Killzones for high-probability setups or major sessions for market analysis.
Notes
Ensure your time ranges align with your trading instrument’s session times.
Overlapping ranges prioritize higher-numbered ranges (e.g., Asia Killzone overrides London Session).
Ideal for day traders, scalpers, or ICT strategy followers who need clear visual cues for specific market hours.
Feedback
If you have suggestions for improvements or need help with customization, feel free to leave a comment or contact the author!

Keylevels [KAWS]Overview
The Keylevels Indicator is designed to provide traders with a clear and structured view of important market reference points. It automatically detects and plots session highs and lows, weekly and monthly levels, as well as the previous day’s range. These levels are presented directly on the chart as dynamic lines with optional text labels, offering a consistent framework for understanding price action across multiple time horizons.
Understanding the Concepts
What are Key Levels?
Key levels are significant price points that often serve as reference markers in market activity. They represent areas where the market has previously established boundaries (highs and lows) within sessions, days, weeks, or months. Such levels can highlight where price has repeatedly reacted, providing insight into areas of potential importance.
Why Sessions Matter
Financial markets operate globally, and trading sessions (Asia, London, New York) reflect the activity of different regions. Each session produces distinct highs and lows that can serve as key markers for subsequent price behavior. By capturing these levels automatically, the indicator helps visualize how markets transition from one trading phase to another.
Higher Timeframe Levels
Weekly and monthly highs and lows, as well as the previous day’s range, provide broader structural reference points. These levels are often used to assess whether the market is respecting or breaking significant boundaries over time.
How the Indicator Works
The indicator automatically tracks and plots:
Session Levels: Highs and lows of the Asia, London, and New York sessions.
Session Open Price: A clear reference line marking the opening price of a chosen session.
Daily Levels: Previous day’s high and low, updated at the start of each new day.
Weekly Levels: High and low of the current week, with automatic reset each new week.
Monthly Levels: High and low of the current month, updated dynamically.
Each level is displayed with customizable line styles, colors, and labels. Labels can include text only or also display the exact price, depending on user preference. The indicator further supports the option to extend lines into the future, allowing for ongoing visibility of these reference points.
Customization Options
Display Control: Enable or disable specific sessions, daily, weekly, or monthly levels.
Visual Styling: Adjust line colors, thickness, and style (solid, dashed, dotted).
Labels: Choose whether to display text, include price information, and set text size.
Session Settings: Define your preferred timezone and session open times for accuracy across global markets.
Line Extension: Decide whether levels should extend into the future or stop when broken.
Important Considerations
This indicator is a technical reference tool. It does not generate buy or sell signals but instead provides structural context by highlighting where the market has established significant levels. As with any technical tool, it is most effective when integrated into a broader trading framework that includes market structure, trend analysis, and risk management.

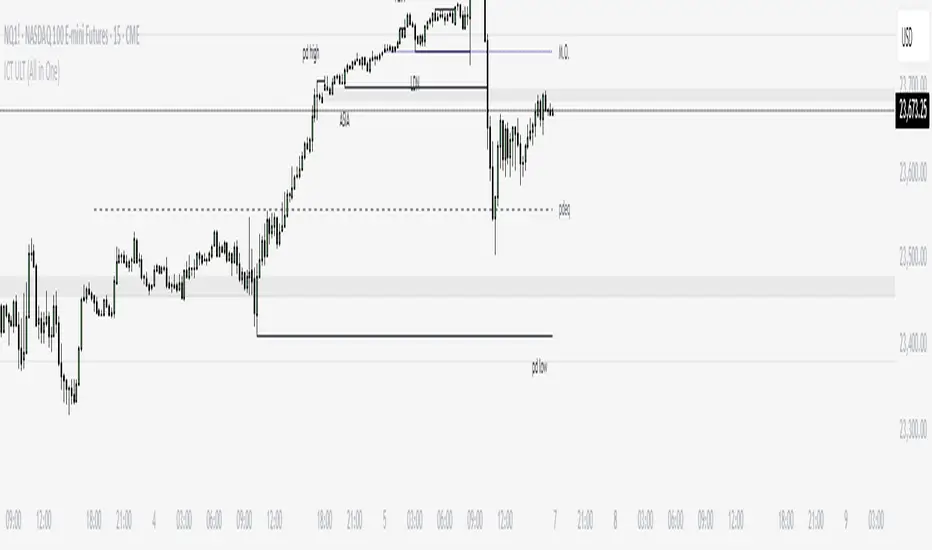
ICT ULT
This indicator is for lazy people like me who want to automate the process of marking certain ICT key levels using the indicator's features, such as:
Custom Killzone/Session Liquidity Levels in form of Highs and Lows
Killzone Drawings (Boxes)
Previous Day High/Low (PDH/PDL)
Previous Day Equlibrium (PDEQ)
Previous Week High/Low
New Day/Week Opening Gaps (NDOG/NWOG)
Custom Opening Prices (horizontal) (e.g. Midnight Open)
Custom Timestamps (vertical)
*Note: All features are completely customizable
inspired by: @tradeforopp
ICT Session High/Low LevelsThis indicator automatically plots the Highs and Lows of completed sessions and draws lines for the Asian session and London session. Levels are displayed only after each session has closed. A simple tool for liquidity work and intraday context (SMC/ICT).

Sessions [New_ProfitEfex]This script is use for displaying session in a very attractive an clarity way
You can give it a try for free

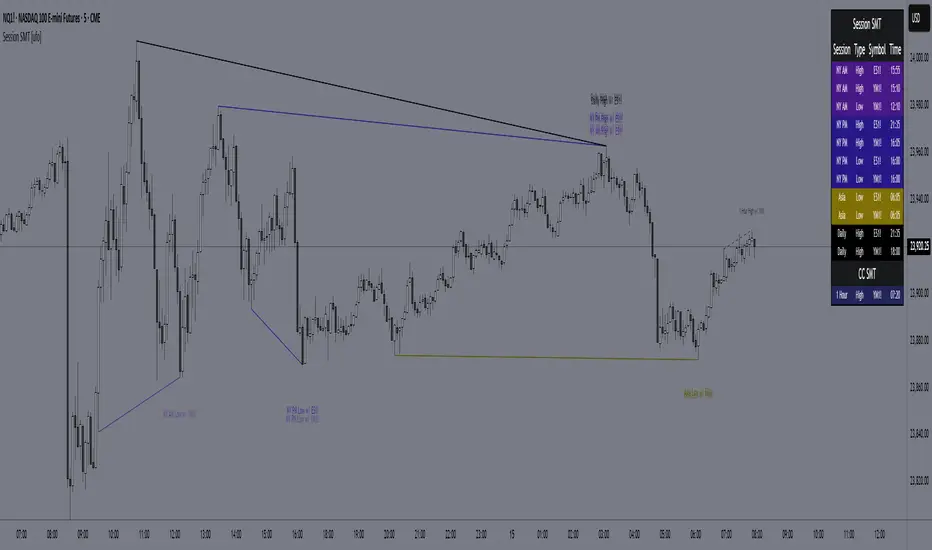
SMT for Time-Based Sessions [ufo]SMT for Time-Based Sessions identifies when one asset breaks a session’s high/low while another correlated asset fails to do so. This imbalance often signals engineered liquidity grabs, reversals, or continuation setups. By focusing on divergences within specific trading sessions (London, New York AM, Lunch, New York PM, Asia, Daily or your own custom windows), the tool filters out noise and pinpoints only the most meaningful SMT divergences across multiple symbols in real-time.
Core Concept:
SMT (Smart Money Technique/Tool/Time) is a concept popularized by Inner Circle Trader (ICT) that suggests that when correlated or inversely correlated instruments fail to confirm each other's price movements (e.g., one breaks a high/low while the other doesn’t), it often indicates:
Liquidity manipulation by institutional players
Potential reversal points in the market
Weakness or strength in the current trend
Stop hunt operations before significant moves
This indicator identifies these divergences by comparing your chart symbol against up to two comparison symbols across different sessions and timeframes.
How Time-Based SMT Works:
Unlike basic divergence tools, this indicator is built specifically for Session-Based and Timeframe-Based SMT tracking. It continuously monitors intraday sessions and higher timeframes, then plots divergences the moment they occur.
Time-Based Session SMT
Session Tracking: Monitors highs and lows during each session
Post-Session Analysis: After a session ends, tracks whether price breaks session levels
Divergence Detection: When the main symbol breaks a high/low but comparison symbols don’t (or vice versa), an SMT signal is triggered
(e.g. Nasdaq traded above London high while S&P500 does not)
Visual Confirmation: Lines connect the session reference to the current extreme, with labels showing the diverging session, high/low, and symbol, this information is also displayed in the Info Panel
This will update if a new high/low extreme is made while the SMT is still valid, if invalidated these will be removed from the chart
Example:
This NQ chart includes ES and YM as comparison symbols. At 03:20 AM New York time, both ES and YM broke the Asia session low (20:00 – 00:00), while NQ did not. This creates a bullish session divergence , which the indicator immediately detects and plots.
Although the chart shows three symbols for illustration, you don’t need to manually monitor comparison charts when using this indicator, the SMT divergence will be plotted automatically as soon as it occurs
Consecutive Candle SMT (CC SMT)
Previous Candle Reference: Uses the previous candle's high/low from the selected timeframe
Real-Time Comparison: Monitors if current price breaks these levels across all symbols
Instant Detection: Triggers SMT immediately when divergence occurs
Dynamic Updates: Lines and labels update in real-time as new extremes form and are automatically removed if invalidated
Example:
Here I configured CC SMT Timeframe 1 to monitor the previous 4-hour candle’s high/low. On this NQ chart with ES as a comparison symbol, ES broke above the prior 4-hour high at 14:00 New York time, while NQ did not, showing relative weakness creating a bearish CC SMT divergence
This chart is just an illustration. The indicator will automatically plot SMT divergences on your main chart, regardless of the timeframe you’re viewing
How To Use:
This indicator is not a buy/sell signal on its own. Instead, it is designed to highlight Time-Based SMT divergences so you can combine them with your existing trading strategy or model. It should be used as an extra layer of confluence, helping you confirm trade ideas.
Select your comparison symbols
For example:
Futures: NQ vs ES/YM
Forex: EURUSD vs GBPUSD/DXY(inversely)
Crypto: BTC vs ETH
Commodities: Gold vs Silver
Choose which sessions or candle timeframes you want the indicator to monitor
Watch for divergences the indicator plots when one symbol breaks a high/low while the other does not
Use these divergences as confluence, alongside your own strategy and risk management rules
Key Features:
Multiple Comparison Symbols
Symbol 1 & Symbol 2: Compare your main chart against up to 2 correlated instruments
Symbol Inversion: Perfect for inversely correlated pairs (e.g., EURUSD vs DXY)
Session-Based SMT Tracking
Monitors 7 fully customizable trading sessions with the default being:
London Session (2:00-5:00 NY time)
NY AM Session (9:30-12:00 NY time)
Lunch Session (12:00-13:00 NY time)
NY PM Session (13:00-16:00 NY time)
Asia Session (20:00-00:00 NY time)
Custom Session 6 (if you want to add an extra session)
Daily Session (18:00-18:00 NY time)
Fully customizable session times and names
Automatically detects when the main symbol breaks a session high/low while comparison symbols don't (and vice versa)
Consecutive Candle SMT (CC SMT)
Monitors 3 customizable timeframes
Tracking of divergences based on specific timeframe candles (15min, 60min, 4 hour, weekly, etc.)
Identifies when the current price breaks the previous candle's high/low differently than comparison symbols
Maintains history of past SMTs (configurable)
Timeframe 3 supports custom time shifts for non-standard candle boundaries
Example: 90min timeframe with a +60 shift changes the candle range from:
00:00-01:30, 01:30-03:00 etc
to:
01:00-02:30, 02:30-04:00 etc
Visual Customization
Line Styles: Customize the line styles for different symbols
Colors: Unique color schemes for instant session identification
Adjustable Offsets: Fine-tune label positions with multiplier settings
Show/Hide Controls: Complete control over visual elements
Custom Labels: Customize the SMT labels for highs and lows
Information Panel
Active SMT Conditions: Live tracking of all current divergences
Session Names: Clear identification of which session created the SMT
Symbol Information: Shows which comparison symbol is diverging
Timestamps: Optional time display showing when SMT was first detected
Flexible Positioning: 8 different panel positions
Smart Display Modes: Options to hide inactive sessions/timeframes
Alert System
Configurable alerts for specific sessions or timeframes
Get notified when new divergences appear instantly
Clear, informative alert descriptions
How To Setup Alerts:
Enable the "Enable Alerts" in the settings
Choose which sessions/timeframes to receive alerts for by choosing it in the setting below
(If you select "All Sessions" you will only be alerted for all the sessions you have enabled in the indicator settings)
Create an alert (ALT+A shortcut) or click the the 3 dots on the indicator "Add alert on Session SMT "
- Condition = Session SMT
- Function = Any alert() function call
- Alert name (Message) = Anything you prefer (e.g. SMT Alert)
If you want to create another alert for different settings, first input the new settings in the indicator, then create a new alert.
Note: Previous alerts will continue to notify you based on the settings they were originally set for, even if you change the indicator setting.
How This Helps Your Trading:
This tool automates the heavy lifting of tracking divergences across multiple markets and sessions, continuously monitoring highs and lows in real time and plotting only the most meaningful SMT signals so you can focus on execution, not chart-watching.
LevelsThis Indicator is meant to plot some of the most common levels that traders use.
The display of these levels is highly customizable, as you can choose the line type , color , thickness and whether it shows you no label, price only, reduced label or full label next to the line. All labels (except for "no Label") will show the price at this level.
Also You have the option to mark the start on each timeframe with either a individually colored background or a vertical line where you can choose the line style and color.
Full List of available Levels and Optional inputs to these levels:
Previous HTF Candle Levels:
• Previous HTF Candle Open
• Previous HTF Candle High
• Previous HTF Candle Low
• Previous HTF Candle Close
Optional:
• Choose any higher timeframe
• Mark start of new HTF candle
Session Levels:
• Session Open
• Session High
• Session Low
• Session Close
Optional:
• Choose any time as start and end of your session
• Mark start of session
• Mark full session
Daily Levels:
• Current Day Open
• Current Day High
• Current Day Low
• Previous Day Open
• Previous Day High
• Previous Day Low
• Previous Day Close
Optional:
• Choose start of day (standard, NY Midnight, custom start time)
• Mark start of day
Weekly Levels:
• Current Week Open
• Current Week High
• Current Week Low
• Previous Week Open
• Previous Week High
• Previous Week Low
• Previous Week Close
Optional:
• Mark start of Week
Monthly Levels:
• Current Month Open
• Current Month High
• Current MonthLow
• Previous Month Open
• Previous Month High
• Previous Month Low
• Previous Month Close
Optional:
• Mark start of Month
