DDDDD: SET50 (40 Stocks) - % New 52W LowsDDDDD: SET50 - % New 52W Lows (40 Stocks)
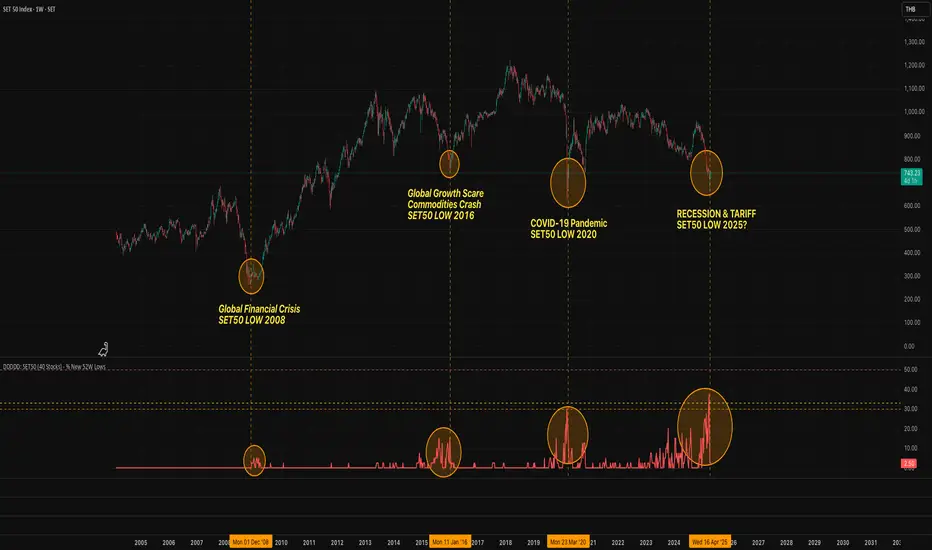
This indicator measures the percentage of selected SET50 stocks making a new 52-week low, helping identify periods of extreme market fear that often align with long-term buying opportunities.
How It Works:
Tracks the daily closing prices of 40 major SET50 constituents.
A stock is counted when it closes at its lowest price over the past 252 trading days (approximately 1 year).
Calculates the percentage of new 52-week lows relative to 40 stocks.
Displays threshold lines to highlight levels of market panic.
📈 Threshold Levels:
Threshold Line Color Level (%) Interpretation Action
30% Threshold Orange 30% Early signs of stress Start monitoring opportunities
33% Threshold Yellow 33% Confirmed panic Consider gradual accumulation
50% Panic Zone Red 50% Extreme market panic Aggressive accumulation zone
📌 Important Notes:
Why not use the full 50 stocks?
Due to TradingView Pine Script's current technical limits, a script cannot request data for more than 40 symbols efficiently.
Therefore, this indicator uses 40 representative SET50 stocks to ensure optimal performance without exceeding system limits.
The selected stocks are diversified across major sectors to maintain reliability.
🔥 Key Insights:
Historically, spikes above 30%-50% of stocks making new lows have coincided with major market bottoms (e.g., 2011, 2020).
Higher simultaneous new lows = stronger potential for long-term recovery.
SET50
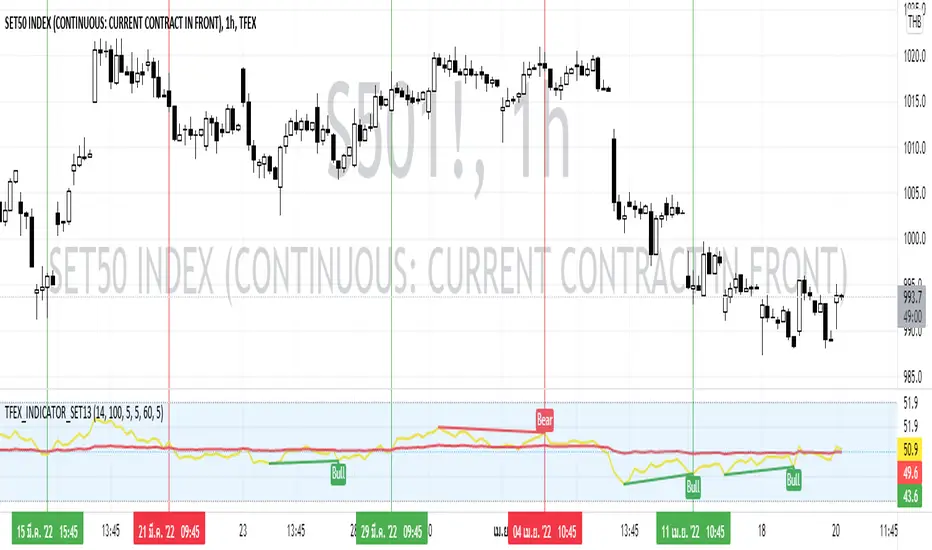
TFEX_INDICATOR_SET13This Indicator use the calculated RSI of the top 13 stocks that have the highest market capitalization in SET:SET50 where suitable for TFEX trading( TFEX:S501! ) .
Conducted with 2 RSI period as follow:
RSI Main (14)
RSI Average (100)
How to use:
1) Use this Indicator by Crossover
If the RSI Main Cross UP the RSI Average can assume as BUY SIGNAL
If the RSI Main Cross DOWN the RSI Average can assume as SELL SIGNAL
2) Use this Indicator by Divergence of RSI Main
If the RSI Main got any Regular Bullish or Hidden Bullish can assume as BUY SIGNAL
If the RSI Main got any Regular Bearish or Hidden Bearish can assume as SELL SIGNAL
3) The combination of Divergence and Crossover
If the RSI Main got any Regular Bullish or Hidden Bullish then pending for the RSI Main Cross UP the RSI Average which can assume as BUY SIGNAL
If the RSI Main got any Regular Bearish or Hidden Bearish then pending for the RSI Main Cross DOWN the RSI Average which can assume as SELL SIGNAL
Preferred Timeframe
4H
2H
1H