CC - Candle Momentum IndicatorA simple VWAP and SMA smoothing on the candles along with some momentum coloring. Basically, if the "slider" is slid all the way up and it turns red, moving down or losing volume t's probably going down. If it's all the way down and starts turning green, getting bigger and seeing volume, it's probably going up. this is a prototype indicator that I plan to extend using arrays and averages if it is seen as something useful.
Sma
GMS: The OscillatorThis is my version of an RSI. Basically treat it the same way, but needless to say there's a few more things going into it than just the closing price.
The color of the line is based on my HAMA JAMMA indicator so they could be used in conjunction to help pick potential trend reversals in either direction, overbought and oversold levels will turn the line yellow.
The "Make that a combo?" selection will change the curve and make it more sensitive to sharper price movements.
This works on any time frame as well as any bar type, although for certain bar types you'll probably have to tweak the settings to see what works.
I hope it helps,
Andre
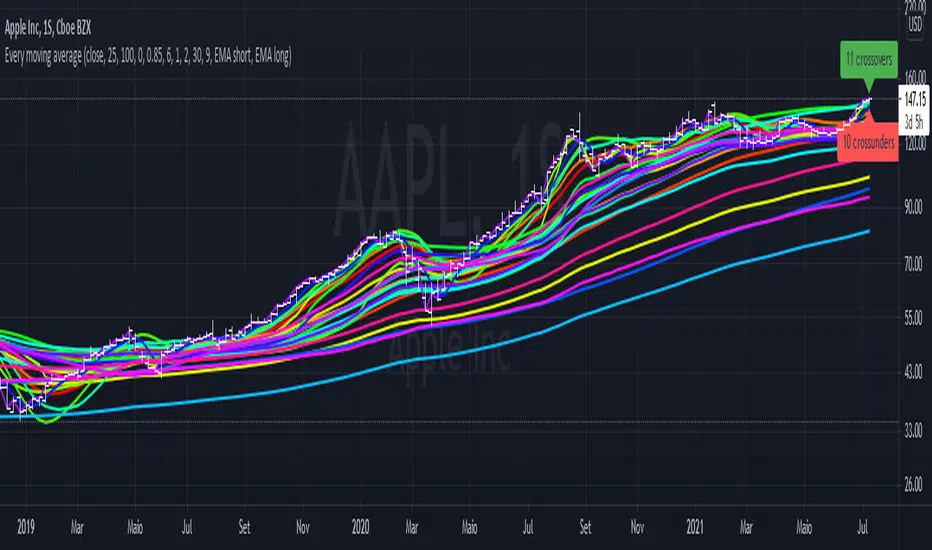
Every single moving average (ALMA, EMA, HMA, KAMA, RMA, SMA...)So you may be looking at the graph and thinking "this is a mess", and I agree.
The purpose of this script is to plot in the same graph every single type of moving average that I could think of, so you can find the ones that are better for your timeframe and for your asset. Once you add it, disable those types that doesn't seem to serve your purpose, until you can select one you like.
The average types are: ALMA, EMA, HMA, KAMA, RMA, SMA, SWMA, VIDYA, VWAP, VWMA, and WMA. Each one is ploted two times (except SWMA and VWAP), one with a short period, and another with a long, both of which you can configure.
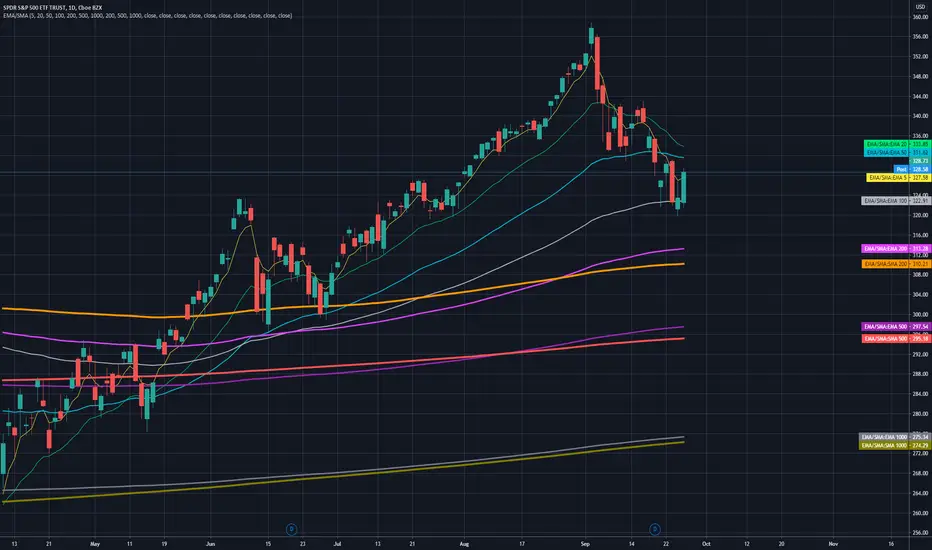
7 EMA 3 SMA with nameplatesScript provides 7 EMA (5 20 50 100 200 500 1000), 3 SMA (200 500 1000) with built-in nameplates for easier navigation. Different colors and widths from the start just to make your initial tuning a bit easier.
Based on Bubsan and Silkheat multicombo, heavily modified, but still huge kudos to guys for the base code.
Modifications: lengths adjusted, on-chart nameplates added, 2 EMA's added, SMA's reduced, static SMA's deleted.
GMS: HAMA JAMMAThis is my version of HAMA candles, I just wanted more out of the original indicator. So now with this one you'll be able to pick which MA you want as well as it's length.
MA's included are: SMA, EMA, WMA, HMA, VWMA, & Linear Regression.
The line at the bottom represents a slightly firmer grasp of the trend relative to the HAMA candle colors. Basically it will help to filter out potentially weak signals. *It is not price support*
Tip: Be sure to turn off the border color in the settings, it will help the colors to pop.
Hope this helps,
Andre

WR Robo Level 1FCPO trading robot alert is based on one of the popular WR Level 1 Technique strategy.
This alert is suitable to used by personal who are understand WR Level 1 Technique.
The script will identify candle that is touch SMA line and trend candle (in direction of Long or Short) to determine either to go with Long or Short entry.
Once entry is confirm, script will popup one label with detail of Long Entry Condition or Short Entry Condition.
This is an example of Long Entry Condition :
This is an example of Short Entry Condition :
Recommended Chart Settings:
Asset Class: FCPO Active Contract
Time Frame: 15 Minute
Long Entry Conditions:
a) Green Label with information of Buy Stop value, Take Profit Value and Stop Loss Value
b) Buy Stop value will be plot with Black Circle symbol on the chart
b) Take Profit value will be plot with Orange Cross symbol on the chart
b) Stop Loss value will be plot with Red Cross symbol on the chart
Short Entry Conditions:
a) Red Label with information of Sell Stop value, Take Profit Value and Stop Loss Value
b) Sell Stop value will be plot with Black Circle symbol on the chart
b) Take Profit value will be plot with Orange Cross symbol on the chart
b) Stop Loss value will be plot with Red Cross symbol on the chart
The entry label will appear once WR Level 1 Technique is valid.
Exit Conditions:
a) Stop loss level is hit
b) Take profit level is hit
c) Last candle at the end of the day (at 17:59:45 or earlier)
Default Robot Settings:
Simple Moving Average ( SMA ) : 50
Disclaimer:
This is a FCPO trading strategy that involves high risk of equity loss, You agree to use this script at your own risk.
If you have any suggestions, comments or interested to use this script, kindly PM us to obtain an access.

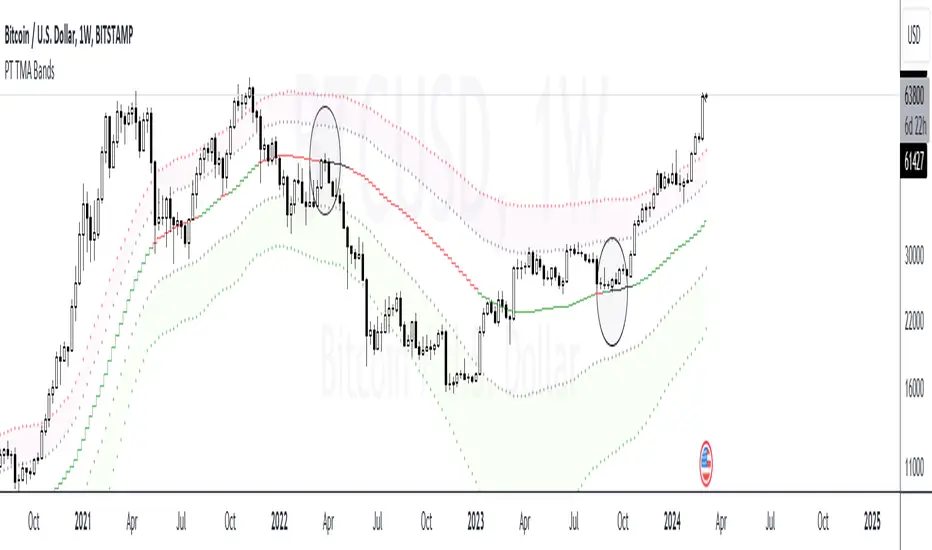
PT TMA BandsVersion 1.0 of our TMA Bands is a visual of areas of interest. The purpose of this indicator is to determine where the price will likely bounce or reject. When an asset is ranging, it very well respects the neutral (middle) zone. The highest RR trade setups are when the price goes from one end of the bands to another.
The bands included are of an ATR multiplier based on multiple moving averages. Each moving average has a unique feature that offers a high probability reaction when price gravitates towards it. We have color-coordinated the bands into three zones. The Main zone being the middle area where the asset tends to play ping pong & range, Top zone, which offers the best RR for shorts & the bottom zone, which provides the best RR for longs.
Strategy:
When scalping or swinging, always look for shorts close to the red zone as possible with a stop loss above the red band. When longing, always look for longs close to the green zone area with a stop loss below the green band. Anything in orange is a neutral zone, which will confirm the asset is more than likely ranging. I don’t advise taking trades in that zone unless you have solid risk management. When playing the macros, H12+ always look for price to find support at the orange (middle) band before deciding on a shift in trend. If the asset breaks down from the orange (middle) band, you usually get a retest of that band before further downside. Also, something to consider, if you punt longs at the green zone, you want to target the orange (middle) band. If you punt shorts at the red zone, you want to target the orange (middle) band. I usually take 70% off at the middle band & let the rest run if ultimately end up in the opposite zone.
This Oscillator is best with the buy/sell signals we provide. It offers extra confluence with stop loss & targets. I enjoy using it on all time frames for swinging & scalping. It is included as part of the library. Just message us for access!
TEMA, DEMA and SMA with crosses with alert functionality
Just a crude but functioning ma indicator with bullish and bearish crosses and alert functionality.

SMA Strategy - Indicator Version for AlertIn this indicator, I made use of two different sma intersections for buying and selling points. You can use the intersection of 2 sma values for buying and 2 separate sma intersection for selling.
There are 3 different alarms for those who want to set an alarm.
- Cross Alarm: The alarm that will work on buy-sell signals for those who have the right to set a single alarm.
- Buy Alarm: The alarm that will operate at the receiving point according to the values you specified.
- Sell Alarm: The alarm that will operate at the sales point according to the values you specify.
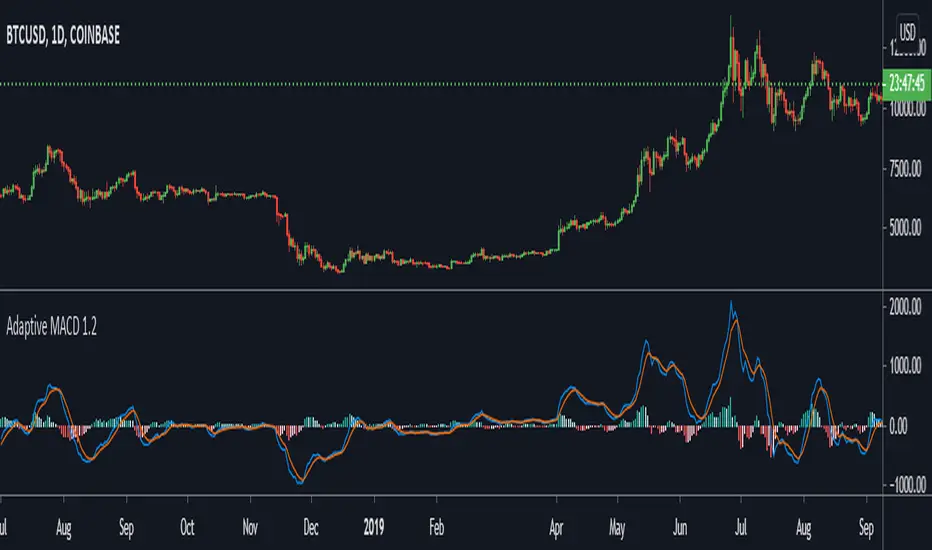
Adaptive MACDThis is part 6 of 11 in the system named Ninetales/Volt V2 you can find on Tradingview.
Add custom values to backtest, it will return the most accurate of them.
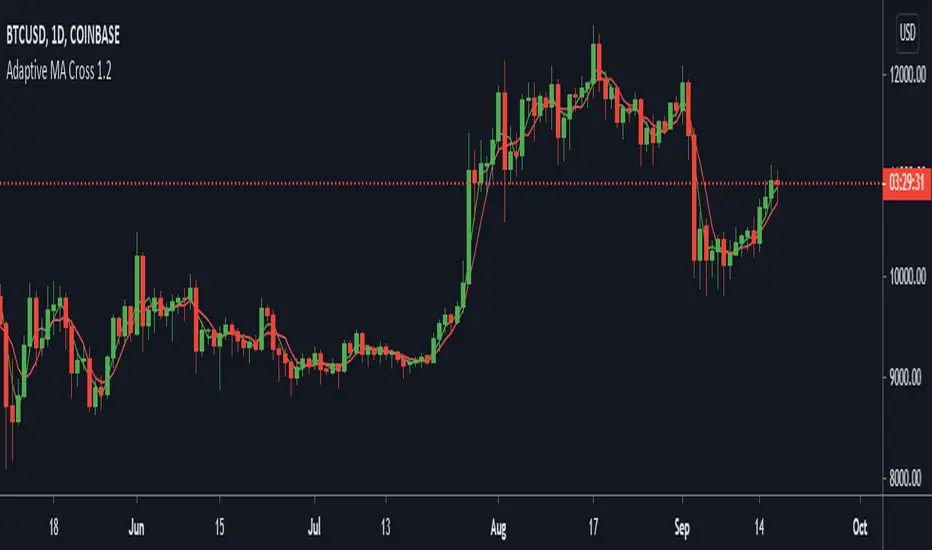
Adaptive MA CrossThis is part 5 of 11 in the system named Ninetales/Volt V2 you can find on Tradingview.
Add three values to test for Fast MA, and three for Slow MA and it will backtest a crossover strategy and show you the most accurate one.
Axe and ShieldAxe and Shield measures the distance between the selected Moving Average (T3, EMA, SMA) or Volume Weighted Average Price (VWAP) and high or low of the current bar. It remembers the highest distance over the selected period of time.
It will use a candle's high if the price is above the level.
It will use a candle's low if the price is below it.
Distance is always positive. If it is measured above, the axe will be green. If it is below, it will be red.
The lookback period is how far in the past you want to look for the extreme distance. By default, it is set 24h to the past on always-open markets.
I recommend using with low-period moving averages or VWAP. Sometimes, you might even see double tops on the indicator and reversal price action, which can lead to opening a position. You might as well look for divergences. When the price moves higher but remains closer to MA/VWAP, momentum might be disappearing.
Do a proper backtest to see how useful Axe and Shield's information would be to you.

Multi EMA+SMAMulti EMA+SMA with default value of 20/50/200 ... User can change value and color as required... As ema and sma both has same value thats why only three lines are visible, changing value will reflect other Moving averages. Hope it will help my trader friends.
Love
Indyan...

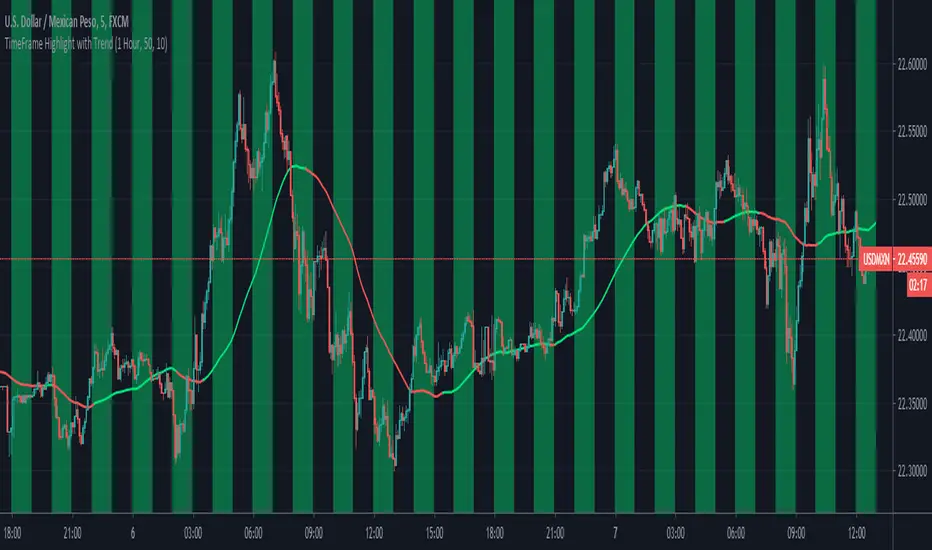
TimeFrame Highlight with TrendThis is a simple study that highlights these input intervals: "5 Min", "20 Min", "1 Hour", "2 Hour", "4 Hour", "8 Hour", "12 Hour", "16 Hour", "20 Hour", "24 Hour"
It also gives you trend by highlighting green for up and red for down and grey for no trend.
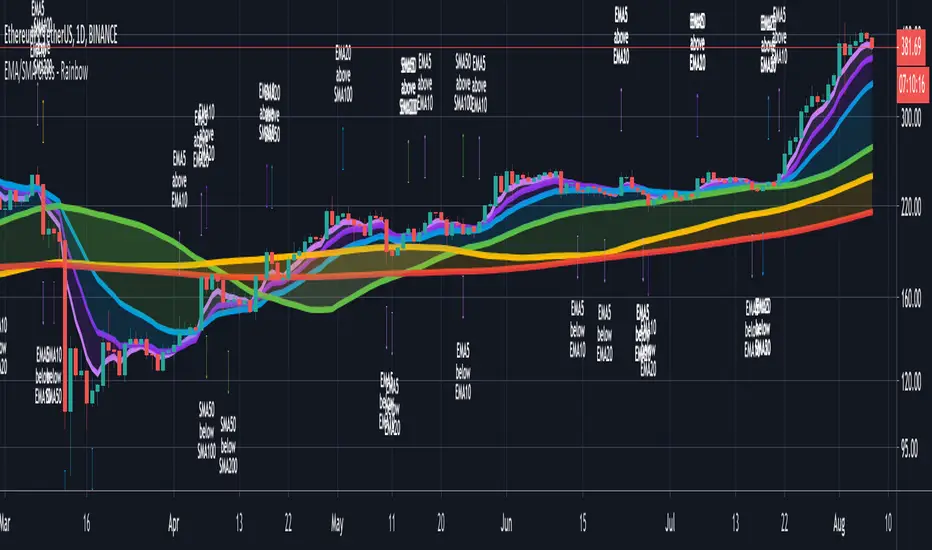
CryptoSignalScanner - Advanced Moving Averages - Cross & RainbowDESCRIPTION:
With this script you can plot 6 moving averages.
You can decide which Moving Average you want to show or hide.
For every plot you can decide to display the Simple Moving Average ( SMA ) or Exponential Moving Average ( EMA ).
It provides CrossOver and CrossUnder labels when loading the script. Those labels you can show or hide.
You have the possibility to show or hide the rainbow colors. This rainbow function gives you a clear view of the current trend.
HOW TO USE:
• When one Moving Average crosses above another Moving Average it signals an uptrend.
• When one Moving Average crosses below another Moving Average it signals a downtrend.
• The higher to length of the Moving Average the stronger the trend.
FEATURES:
• You can show/hide the preferred Moving Averages.
• You can set the length, type and source for every Moving Average.
• You can show/hide the rainbow colors.
• You can show/hide the CrossUp labels.
• You can show/hide the CrossDown labels.
• You can set alerts for every Moving Average.
• Etc...
DEFAULT SETTINGS:
• MA1 => EMA5
• MA2 => EMA10
• MA3 => EMA20
• MA4 => SMA50
• MA5 => SMA100
• MA6 => SMA200
Simple Moving Average vs. Exponential Moving Average:
SMA and EMA are calculated differently. The exponential moving average ( EMA ) focuses more on recent prices than on a long series of data points, as the simple moving average required.
The calculation makes the EMA quicker to react to price changes and the SMA react slower. That is the main difference between the two.
One is not necessarily better than another. It comes down to personal preference. Plot an EMA and SMA of the same length on a chart and see which one helps you make better trading decisions.
Moving Average Trading Strategies:
The first strategy is a price crossover, when the price crosses above or below a moving average, it signals a potential change in trend.
The second strategy applies when one moving averages crosses another moving average.
• When the short-term MA crosses above the long-term MA, it signals a buy signal.
• When the short-term MA crosses below the long-term MA, it signals a sell signal.
REMARKS:
• This advice is NOT financial advice.
• We do not provide personal investment advice and we are not a qualified licensed investment advisor.
• All information found here, including any ideas, opinions, views, predictions, forecasts, commentaries, suggestions, or stock picks, expressed or implied herein, are for informational, entertainment or educational purposes only and should not be construed as personal investment advice.
• We will not and cannot be held liable for any actions you take as a result of anything you read here.
• We only provide this information to help you make a better decision.
• While the information provided is believed to be accurate, it may include errors or inaccuracies.
If you like this script please donate some coins to share your appreciation.
Good Luck,
SEOCO
EMA_VTX
Abbreviations:
EMA - Exponential Moving Average
SMA - Simple Moving Average
WMA - Weighted Moving Average
VWMA - Volume-Weighted Moving Average
TP - TimePeriod (1m,2m,5m,1h....)
TP Steps - 1m,3m,12m,1h,5h,D (This steps i use)
Use-case:
Moving Average Exponential is a good indicator of Support and Resistance Level. Giving us average price level in particular moment.
This script calculates and plots Moving Average with minute precision, even if you want to see 21 EMA level from 1H chart.
So you can accommodate all important information on one chart with best precision.
Made for Intraday Perioads.
Best used for DayTrading, when you need to make quick and efficient decisions.
EMA_VTX = Preferred resolution * Length / Present resolution.
In addition to plotting EMA , you can quickly switch between SMA, WMA, VWMA .
Settings:
Resolution - Most used TP included, plus some exclusive paid plans (1m, 2m, 3m, 5m, 12m, 15m, 1h, 4h, 5h, Daily). Default set to 1h
Use - Bonus function for EMA indicator. You can quickly switch type from EMA to SMA, WMA,VWMA
Length - standard function. Default set to 144
Offset - standard function. Default set to 0
Source - standard function. Default set to hlc3
Why to use it ?
Yes, i know that variable TP is standard now in TradingView. But there are some limitations, especially for DayTraders.
Problem:
Imagine you are trading/scalping on 1m.. 5m.. 15.. charts and you want to see where are your Higher TP MAs.
-- You can change to 1h and check it, but you will loose the picture from smaller TP.
-- You can use Standard EMA TP function, but your MAs data will update every 15m, 1h (depends on TP)
Solution:
This script help to solve this problem, by breaking information down to 1m and building from there.
So whatever Intraday TP you choose to trade, your MAs will be updated with minute precision.
Limitations:
Sadly nothing without limitations.
1. You can experience "Reference too many candles in history" around 5K - This means that too many candles are used to plot MAs.
-- Quick fix: Reduce "Length" or Step down TP (best experience when projecting MAs 1-2 TP Steps up)
2. For Best performance use only Higher TP dividable By Yours (ex. You use 3m chart, then you can plot 12m, 15m, 1h / You use 5m chart, then you can plot 15m, 1h. 12m will already have 3m of information lost using 5m Chart )

Weekly & Daily SMA 50/100/200The daily and weekly simple moving averages (SMA) are displayed in all timeframes.
The SMAs can be used for support and resistance. The lines of the past 50, 100 and 200 days and weeks are considered strong supports and resistances.
The daily lines are yellow and the weekly lines are green. The thicker and more visible a line is, the more important it is in the chart.

Moving Average DoublesThis script plots multiple moving averages each source based on its previous MA, all having the same length.
Input options:
Simple Moving Average ( SMA ) or Exponential Moving Average ( EMA )
One adjustable look back period
Choose how many MA's to display, max. 50
One adjustable line width
It probably works best for long term views to find trends or zones of confluence, and it looks awesome :)
Don't be afraid to share your thoughts or settings in the comments. Enjoy!

MESA Adaptive Moving Average - Improved MTFThis indicator is a huge upgrade to my original MTF MESA
Plots are now extremely smooth and accurate on all timeframes **
Missing data points are automatically filled with the "best fit"
This is a Trend indicator and should be used to trade "top-down" aka:
Start with the Daily chart to confirm a trend
Move to 4H
2H
Etc...
Use your favorite entry method or simply watch for wicks forming when the price gets near the MESA adaptive moving average.
This is one of the few indicators that I've been using for years with success. Being able to plot both the current & higher timeframe MESA
can sometimes feel like cheating.
Due to the nature of the recursive calculation, you may notice slight differences between this version of MESA and others that either
approximate higher timeframes with fewer samples or make use of the latest "Resolution" argument in Pinescript V4. Both of which are
fine, until you start looking at M5 charts while plotting the Daily MESA.
As always, happy trading!
** Currently supports
M 1,3,5,15,30,45
H 1,2,3,4
Day 1
Week 1
Month 1
Percentage Price Over SMAReturn the percentage of closing prices greater than SMA's with periods within a user-selected range. An exponential moving average applied to these results is also displayed (in orange).
Settings
Min : Minimum period of the SMA in the range
Max : Maximum period of the SMA in the range
Smooth : Period of the EMA
Src : Input series of the indicator
Usage
The indicator is a normalized oscillator. A value of 100 indicates that 100% of the current closing price is over SMA's with periods ranging from min to max , this indicates a bullish market, while a value of 0 would indicate a bearish market.
In this image the indicator use min = 50 and max = 200, here AMD has been strongly bullish at the start, and ended being strongly bearish at the end, during this bullish period the indicator is over its overbought level, while it is under its oversold level during the bearish period.
In case the market is ranging we can expect the indicator to be around 50%, using the smoothed result might be more useful to detect ranging markets with this indicator.
If the smoothed result is within the overbought/oversold levels, then we can say that the market is either ranging or transitioning from a bullish/bearish market to an opposite one.

Scalpy MFI*Modified version of my Scalpy indicator replacing RSI with MFI*
It is made up of a 2 main parts.
- The cloud comprising of a 10 period SMA and a 30 period SMA .
- When the cloud is green you should be looking for long entries.
- When the cloud is red you should be looking for short entries.
- Price is most bullish above a green cloud and most bearish below a red cloud.
- Being within the cloud indicates indecision.
The red line represents the MFI

Rockstar - Pullback FlagSimple script to identify pullbacks in an uptrend.
Indicator will add yellow flags if ideal conditions are met.
Additionally plots SMA20, SMA50 and SMA200.
Use this indicator in combination with observed price action and your own strategy.
Do no trade blindly on this indicator.
Conditions:
Price above 200MA
50MA above 200MA
20MA near 50MA
RSI reset below 55
Price delta is close to delta between 20MA and 50MA (trying to filter out volatile moves)
Closed price is near 20MA (setting up again for a move)

Minimum Variance SMAReturn the value of a simple moving average with a period within the range min to max such that the variance of the same period is the smallest available.
Since the smallest variance is often the one with the smallest period, a penalty setting is introduced, and allows the indicator to return moving averages values with higher periods more often, with higher penalty values returning moving averages values with higher periods.
Because variances with smaller periods are more reactive than ones with higher periods, it is common for the indicator to return the value of an SMA of a higher period during more volatile market, this can be seen on the image below:
here variances from period 10 to 15 are plotted, a blueish color represents a higher period, note how they are the smallest ones when fluctuations are more volatile.
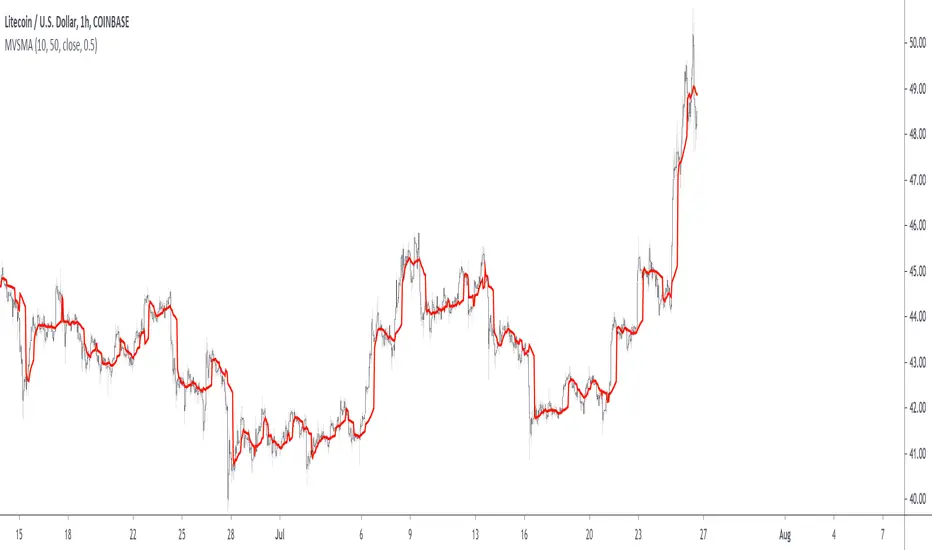
Indicator with min = 50, max = 200 and penalty = 0.5
In blue the indicator with penalty = 0, in red with penalty = 1, with both min = 50 and max = 200.
On The Script
The script minimize Var(i)/p with i ∈ (min,max) and p = i^penalty , this is done by computing the variance for each period i and keeping the smallest one currently in the loop, if we get a variance value smaller than the previously one found we calculate the value of an SMA with period i , as such the script deal with brute force optimization.
For our use case it is not possible to use the built-in sma and variance functions within a loop, as such we use cumulative forms for both functions.