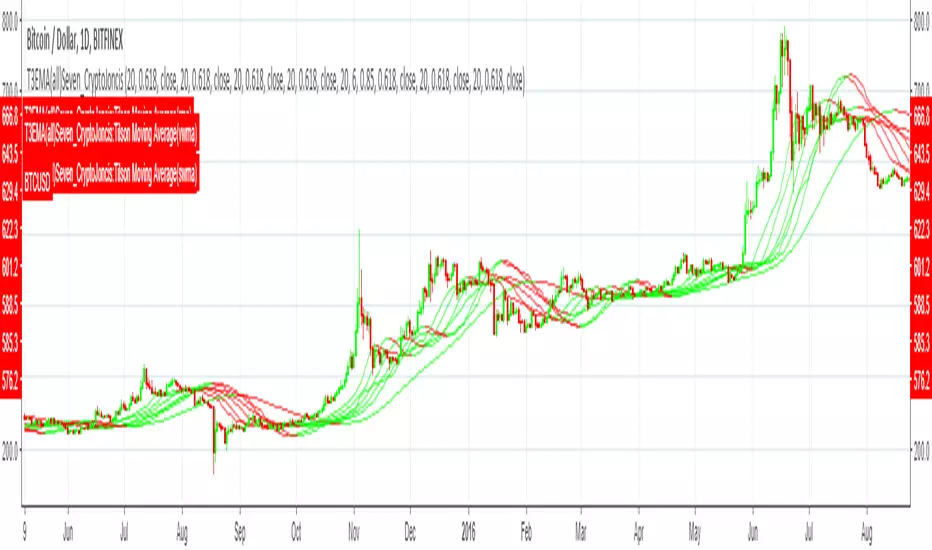
Tillson Moving Average(all_basic) SevenT3 Moving Average indicator was originally developed by Tim Tillson in 1998/99.
T3 Moving Average is considered as improved and better to traditional moving averages as it is smoother and performs better in trending market conditions.
It offers multiple opportunities when the price is in the state of retracement and therefore allows to minimize your exposed risk and allowing your profits run.
This version provides T3 MA
Source options - all standard + HA
T3 based on 6x ema, sma, rma, wma, alma, swma, vwma
Adds up to 7 different T3 on chart
Consider a tip in ETH to
0xac290B4A721f5ef75b0971F1102e01E1942A4578
Thank you and have a nice day
CryptoJoncis
Sma
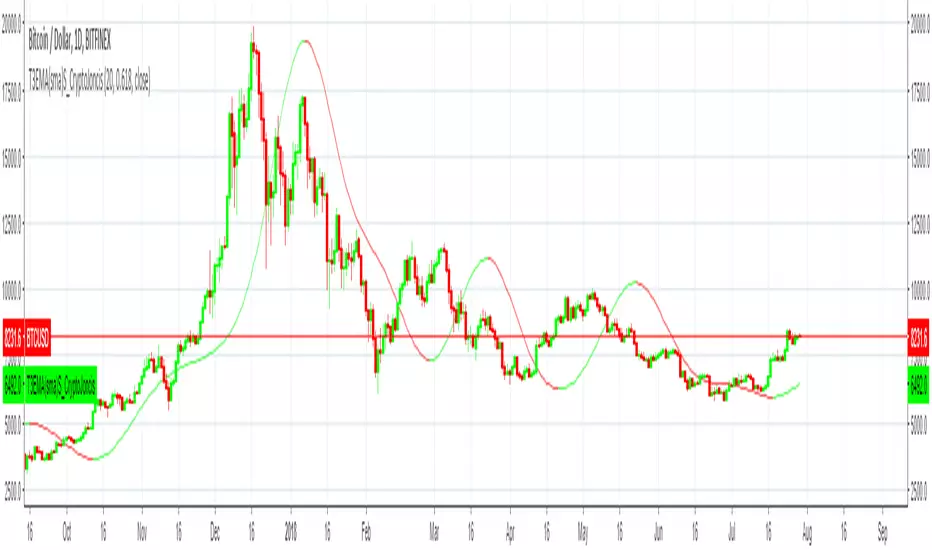
Tillson Moving Average(sma) singleT3 Moving Average indicator was originally developed by Tim Tillson in 1998/99.
T3 Moving Average is considered as improved and better to traditional moving averages as it is smoother and performs better in trending market conditions.
It offers multiple opportunities when the price is in the state of retracement and therefore allows to minimize your exposed risk and allowing your profits run.
This version provides simple T3 MA
Source options - all standard + HA
T3 based on 6x sma
Only adds 1 T3 MA on chart
Consider a tip in ETH to
0xac290B4A721f5ef75b0971F1102e01E1942A4578
Thank you and have a nice day
CryptoJoncis
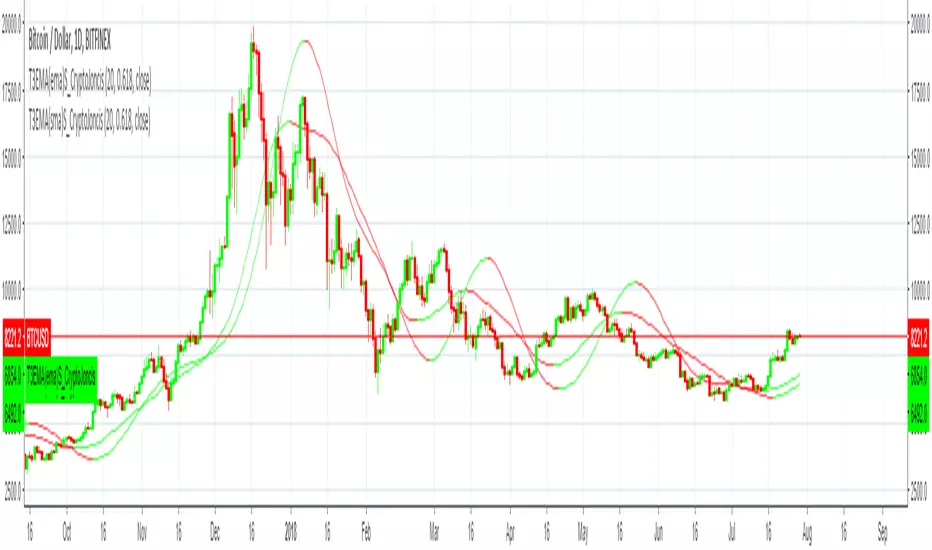
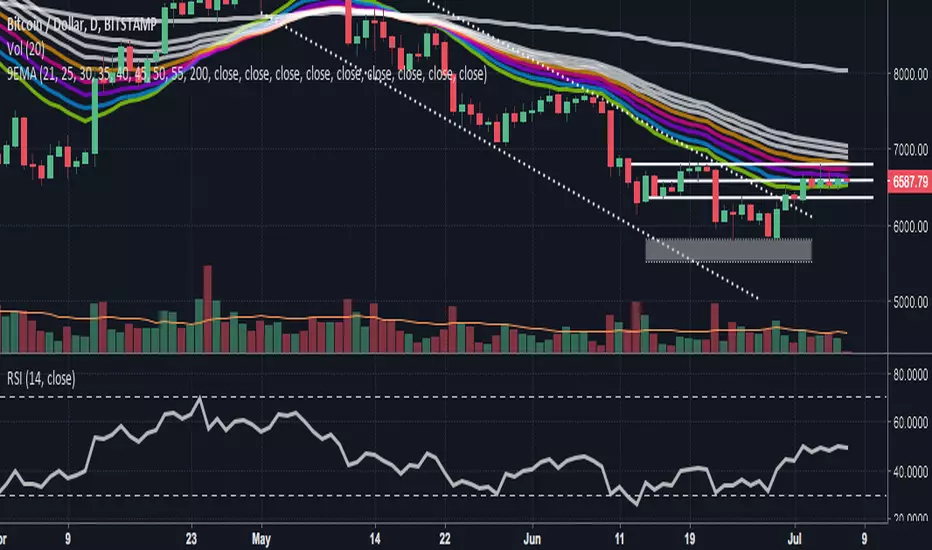
Major Moving AveragesThis script includes the 100 & 200 SMA, EMA, WMA, VWMA, RMA, HMA, LSMA. You can turn off the one's you don't want under Style.

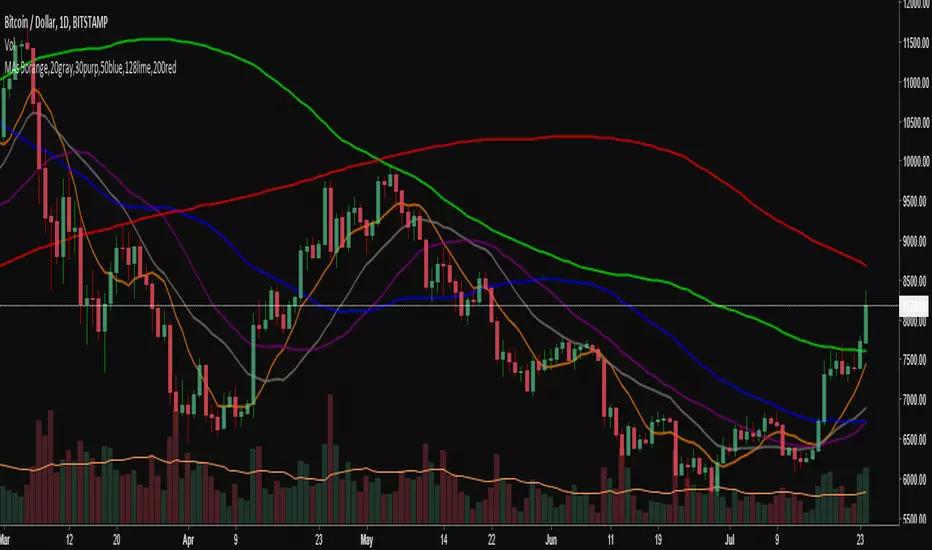
6 SMA's (fit to BTC) 9,20,30,50,128,200 (exponential optional)I've been using these for a while trading Bitcoin and I've found them to be the most useful to me. I replaced the 7 you may have seen in the first set with the 9 as I'm seeing it tested across many time frames quite frequently. The least used of the six is the 30 period, but it does have some influence I've found on the large time frames, mainly the weekly.

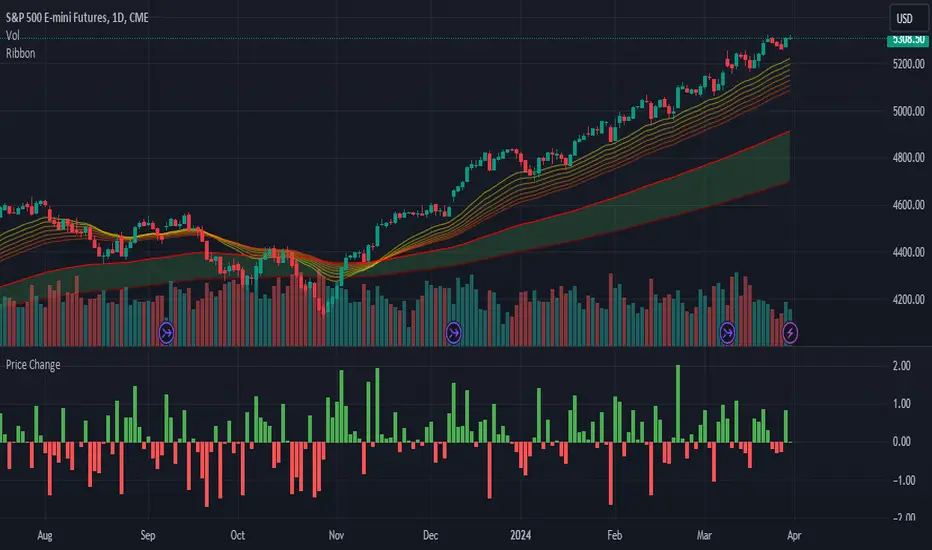
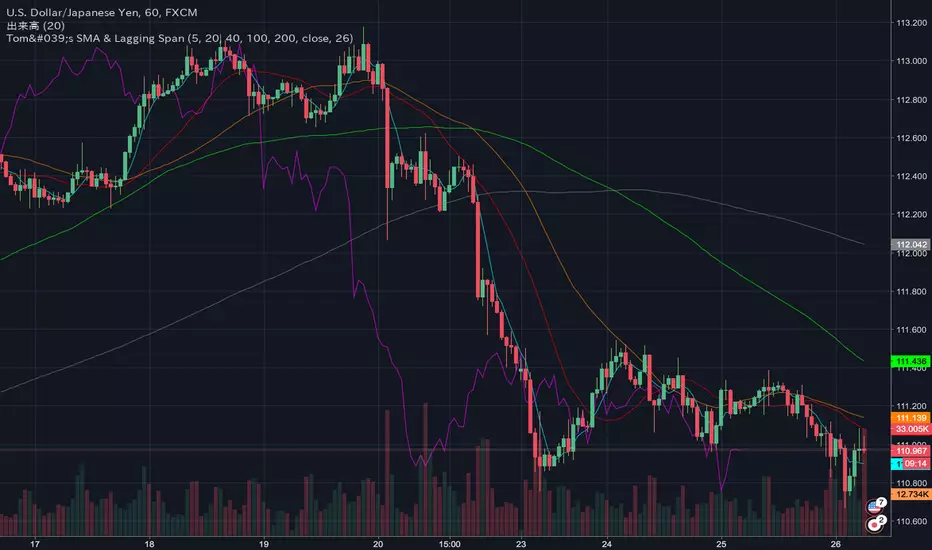
Tom's Moving Average & Lagging SpanSinple Moving Average 5 / 20 / 40 / 100 / 200
Ichimoku Lagging Span
tom_btcfx_fx setting
6 Simple Moving Averages 9,20,30,50,128,200 (bitcoin tested)I've condensed my SMAs down to these 6 and have found them to be most useful for Bitcoin, which is what I trade the most. They all have played their roll in acting as support and resistance and making decisions with the 30 period probably the least relevant, but relevant nonetheless. There is the option to change to exponential if desired.

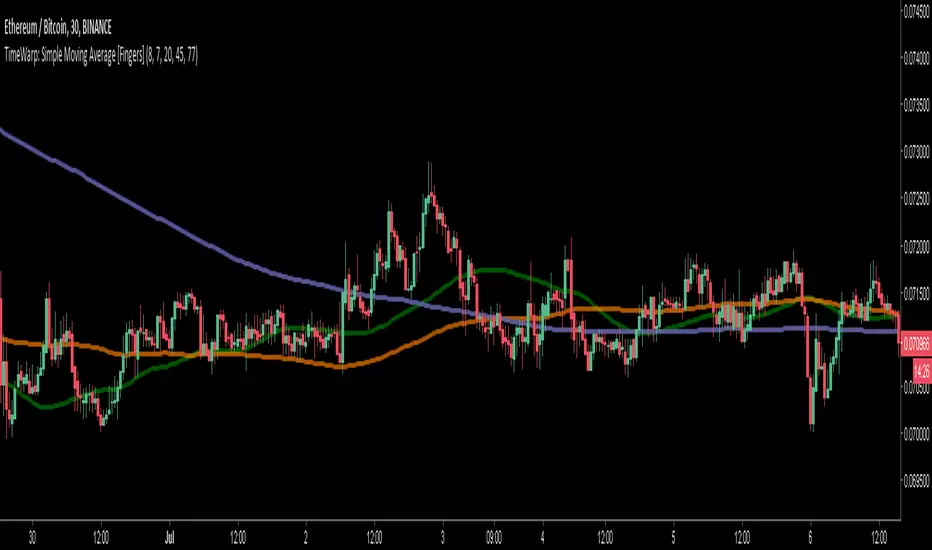
TimeWarp: Simple Moving Average [Fingers]Normally, looking at higher timeframe indicators on a chart leaves you with missing data. For example, here I use the security call function ( www.tradingview.com ) to display 4 hour SMAs on a 30 minute ETH/BTC chart. Notice how the SMA values are only correct once every four hours? That is a lot of missing data.
The TimeWarp Solution
TimeWarp enables you to display higher timeframe simple moving averages on your chart while overcoming the data loss inherent with using the inbuilt security call function. To achieve this, the TimeWarp code calculates the higher timeframe SMA values for every period displayed in your chart. It then applies a smoothing function to even out variation in period-to-period values that commonly occur when calculating higher timeframe indicators at every period. I selected a smoothing function that seems to me to offer low lag and that produces smoothed values very similar to those produced by the security call function. Note that the smoother is not applied when a multiplier value of "1" is used.
How to Use:
It's simple. Apply to any chart, then adjust the "Multplier" value as desired. For example, if you want to see 4 hour indicator values on a 30 minute chart you use a multiplier of "8" (240 minutes / 30 minutes = 8).
Limitations:
The current version of TimeWarp does not account for "missing candles". If there are no buys or sells for a given candle, TradingView omits the candle from your chart. When there are missing candles TimeWarp values will be slightly different.
TradingView is unable to display high multiplier values combined with large period SMAs. For example, you won't be able to see 200 period SMAs with a multiplier of 20. This is a cap set by TradingView that errors out when it has been exceeded.
EMA Cross - Indicator OnlySimple Indicator for Automated Trading Based on EMA Cross.
Displays the BUY/SELL.
Best used with the ALERTS Script.
PM for use.

EMA Cross Alerts /w Take Profit and StoplossSimple Alert for Automated Trading Based on EMA Cross.
Also includes the ability to add Take Profit, Stoploss, and Trailing.
PM for use.

5 Definable Multiple Moving AveragesLets you select up to 5 SMA, EMA, HMA, of whatever length, source, and optional marks on their turning points. Saves on multiple indicators.
10/20 SMA HA STRATEGY for LONGS & SHORTSTrade Long when Arrows go up (B signal for Buy (Long))
Trade Short when Arrows go down. (S signal for Sell (Short))
C for close positions. first priority is always protect your capital and your profits even at the expense of more profits

2EMA + 2SMAUsing EMAs allows to see whether the market is forming a trend, the 13-EMA & 48-EMA have the ability to determine a trend direction. SMAs help to identify if a trend is forming a continuation pattern, using the 100-SMA & 200-SMA, this can be seen.

2EMA + 2SMAUsing EMAs allows the ability to work out trends in the short-term, the 13-EMA & 48-EMA determine whether the market is forming specific trend. SMAs are used to identify whether a trend is in a continuation pattern, and with the help of the 100-SMA & 200-SMA, this can be seen.
Multiple moving averages EMA and SMA (up to 4 each)Simple script lets you add multiple moving averages under one indicator. Up o 4 EMAs and 4 simple MAs. Specify the time frames for each one individual, and turn off the ones you don't need under "Style" tab in settings. Have fun.

Reap Hull SMA CrossoverHi this is my first script, it is a HMA 144 crossover with SMA 5 changes background (still needs work), provides alerts for crossover

3riple Moving AverageBITFINEX:ETHUSD
Description:
Mixing three Simple Moving Averages (7 - 20 - 65) to determine "uptrends" and "downtrends".
Uptrend: When the 7 Line is upper than 20, And 20 Line is upper than 65 that usually means the price is trending up.
Downtrend: When the 7 Line is lower than 20, And 20 Line is lower than 65 that usually means the price is trending down.

[TPA]Nice MA (alert condition)
It is a moving average line that helps in the trading of altocons. In addition, close to the corresponding moving average line (+ -5% gap support function), each moving average line by alarm function. Both alarms and alarms on all moving average lines are possible.
알트코인 매매시에 도움이 되는 이동평균선이다. 또한 해당 이동평균선에 근접시(+-5%갭 지원기능 있음) 각각 이동평균선별로 알람기능을 넣었다. 각각알람과 모든이동평균선 접촉시 알람 모두 가능하다.