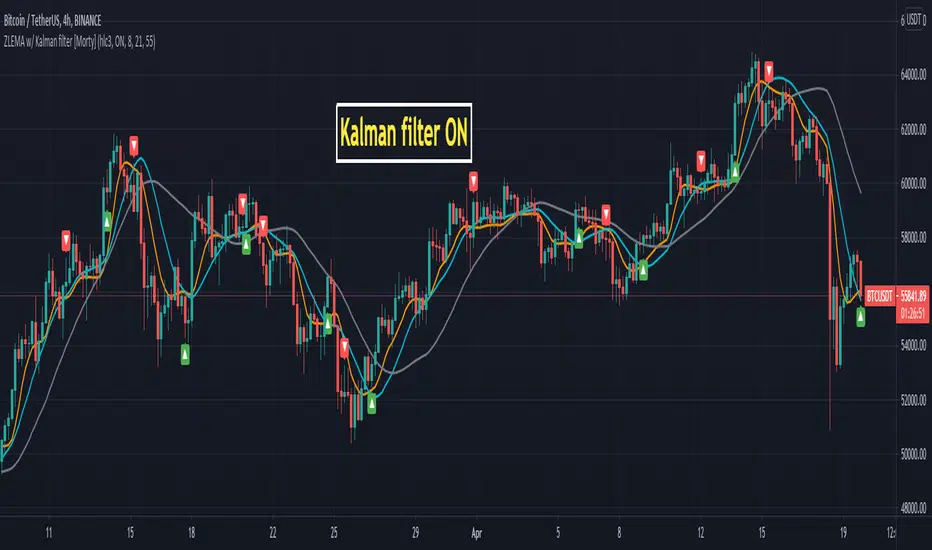
ZLEMA Zero lag EMA with Kalman filter [Morty]This indicator plot 3 Kalman filter zero lag EMA lines. It has less lag and is also smoother than the original EMA.
It also has an option to show the crossover of two EMAs.
ממוצע נע מוחלק (SMMA)
SPY Ninja
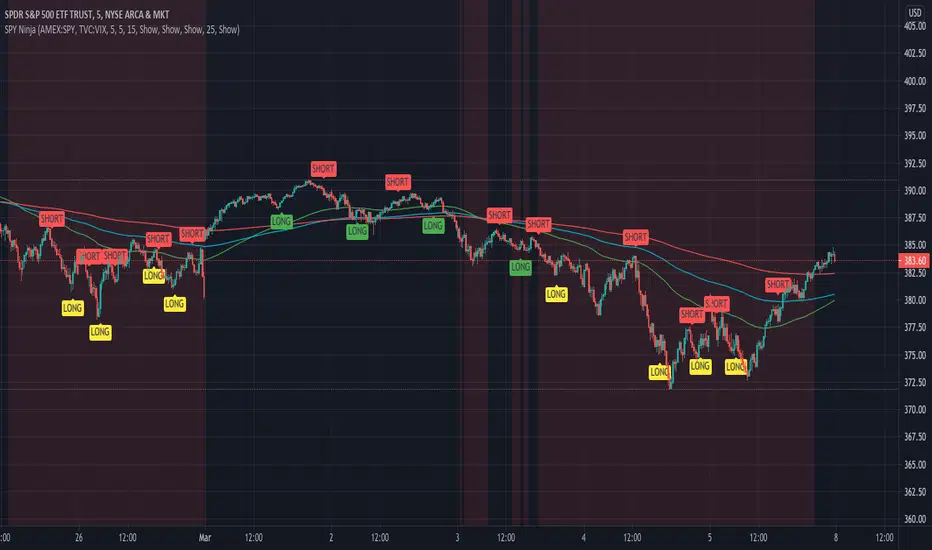
SPY Ninja correlates the true strength index exponential moving averages of SPY and VIX together. In doing so we can determine the start of trend shifts via SPY / VIX convergence in addition to crossover, with potential market entries and exits represented by the LONG and SELL signals.
SMMA 50,100, and 200 have been added to chart due to the historic SPY market reactivity to these moving averages. They often act as natural support and resistance levels with SPY, and when coinciding LONG and SHORT signals appear touching any of these levels, it adds an extra layer of confidence for traders' decisions. Also, by highlighting the areas on our SPY chart (red background areas) that represent a VIX threshold higher than 25, we can bring attention to areas with potentially higher volatility immediately so that traders know to proceed with caution.
SPY Ninja works harmoniously with the SPY Ninja Oscillator; Ninja provides the signals highlighting risky VIX areas of concern, while the Ninja Oscillator adds an additional 3 levels of potential confirmation for your trade decisions.
Bjorgum Triple EMA Strat-This script uses a triple EMA strategy to establish trend direction and reversal points
-Inputs are smoothed with Heiken Ashi values to reduce whipsaws, while providing timely execution
-Buy and sell indications are dictated by bar color
-Bar color is dictated by the candle close value in relation to the EMAs, specifically the faster of the 3
(If candle closes above or below the fast and intermediate averages, a buy or sell signal is indicated by bar color change)
-If the close falls between the two a cautionary signal is given. The viewer can hold, or take profit, or evaluate other indicators for clues
-Best results are obtained when coupled with Bjorgum TSI and Bjorgum RSI for confirmation of signals (see TradingView profile)
@Bjorgum on Stocktwits

SMMA ConfluenceVisualizes SMMA on multiple timeframes (5min, 15min, 30min, 1hr, 2hr, 3hr, 4hr, 6hr, 8hr, 12hr, and 1d) and allows selection of lookback.

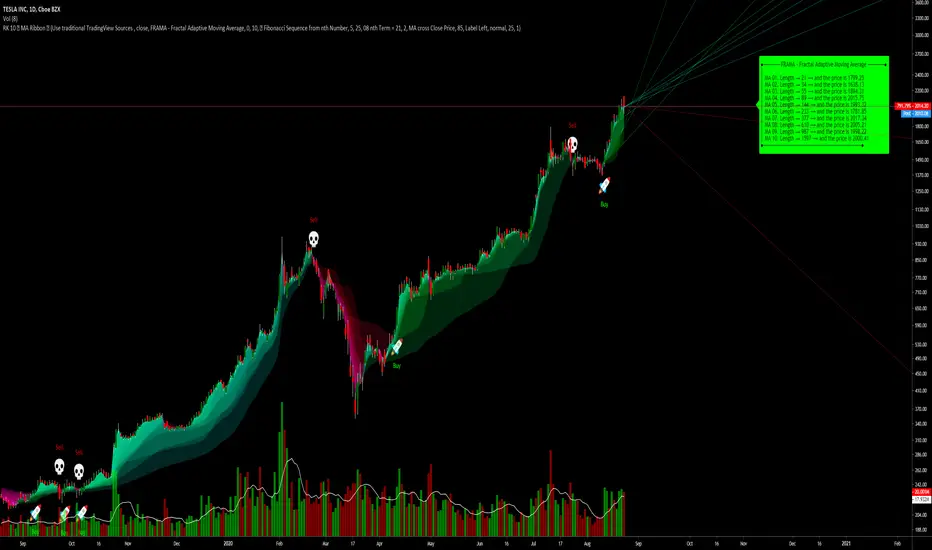
RK's 10 ∴ MA Types Ribbons (Fibonacci, Guppy and others)After some tips in my indicator
RK's 04 - Lots of MA Types Ribbon I Put some time and effort to make it better.
So, I'm sharing with you the results.
This is an up to 10 lines Moving Average Ribbon with an Auto Evaluate Length and a lots of options!!!
Type of Moving Average you can use:
SMA - Simple Moving Average
SMMA - Smoothed Moving Average
EMA - Exponential Moving Average
DEMA - Double Exponential Moving Average
TEMA - Triple Exponential Moving Average
WMA - Weighted Moving Average
HMA - Hull Moving Average
EHMA - Exponential Hull Moving Average
RMA - RSI Moving average
2PSS - Ehlers 2 Pole Super Smoother
3PSS - Ehlers 3 Pole Super Smoother
VWMA - Volume-Weighted Moving Average
ALMA - Arnaud Legoux Moving Average
STMA - Simple Triangular Moving Average
ETMA - Exponential Triangular Moving Average
LSMA - Least Squares Moving Average
ZSMA - Zero-Lag Simple Moving Average
ZEMA - Zero-Lag Exponential Moving Average
COVWMA - Coefficient of Variation Weighted Moving Average
COVWEMA - Coefficient of Variation Weighted Exponential Moving Average
FRAMA - Fractal Adaptive Moving Average
KAMA - Kaufman's Adaptive Moving Average
VIDYA - Variable Index Dynamic Average
If you want to change faster the MA type, in "Moving Average Setup:", Select "🤖 Use numbers to change MA Type", click inside the box in "🤖 Moving Average Type per Number:" and just scroll your mouse wheel. You can check what MA type you are using looking in the info panel label.
There is 4 automatic evaluate length:
Fibonacci Sequence
Arithmetic Progression
Geometric Progression
Guppy Multiple Moving Average (GMMA) without Lengths 03 and 05
And I already put a Manual Length, but I keep it inside the code, so if you want to use different lengths, just change the code, or ask me and I will put as an input.
And attending a request, this indicator can creates alerts when all the colors of the ribbons changes.
Hope you like it!
Any other good idea, just send me.
Pre-Market Volume ProfileThis indicator displays the pre-market volume (note: without the post-market of the previous day).
Unusual pre-market volume often indicates that institutional market makers are moving the market, which is a good sign for unusual high price movement.
The indicator helps me to spot stocks, if a pre-market gap is confirmed with enough (unusual) volume.
You can define, what "unusual" means by you, by adjusting the SMA length and the SMA multiplier.
The default is a length of 21 bars and a 2.5 multiplier, meaning I'm interested in a stock, if the pre-market volume exceeds the average pre-market volume by 2.5 times.

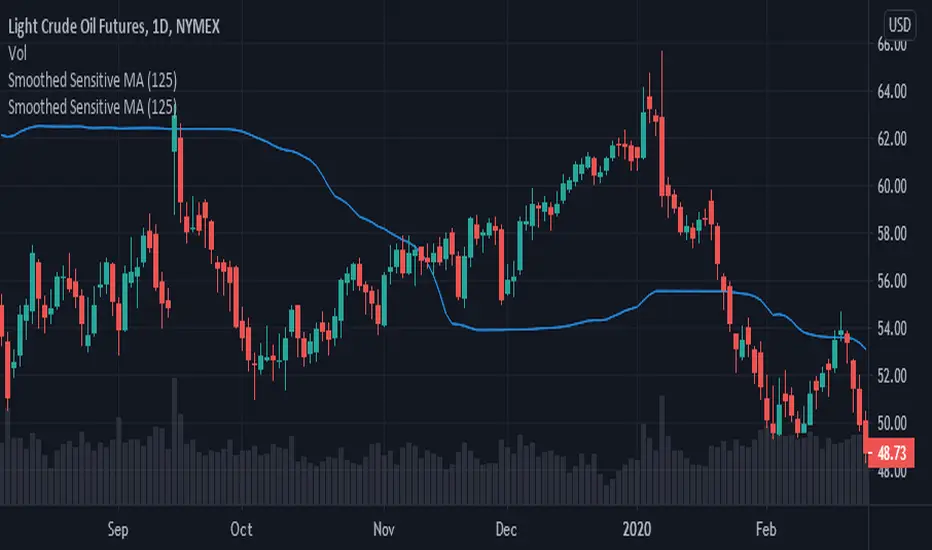
Smoothed Sensitive MAThis moving average is sensitive and reacts quickly to significant price movements, while remaining indifferent to small price moves.
Smoothed Sensitive MA is triple weighted for price changes.
It takes in one parameter "Length", which is used as both
1. the lookback period for price change,
zCC=abs(close-close [ len ])
and also as
2. the number of periods to be averaged
zSSMA=sum(zCC*zCC*zCC*close, len )/sum(zCC*zCC*zCC, len )
Alternatively, you could modify the script to use two separate parameters for values for 1 and 2.
Triple MA + EMA + SMMA + BBCombined multiple scripts under one script.
Great for Free account users. ;-)
This script contains:
Moving Average
Exponential Moving Average
Smoothed Moving Moving Average
Bollinger Bands

SMMA 5-13 crossCrossing the Smoothed Moving Averages with settings 5 & 13 give you confident signal for selling or buying.
IMPORTANT: Signal is always late.
SELL : Short SMMA (5) cross the Long SMMA (13) from top
BUY : Short SMMA (5) cross the Long SMMA (13) from down

[LunaOwl] Center of Gravity作品: 艾勒斯重心點 (Center of Gravity, CG)
Center of Gravity was developed by John Ehlers in 2002. The main purpose of the Center of Gravity indicator is to find possible reversal points as early as possible. Indicator has two series, the first is the CoG series, and the second is the signal line calculated by the five-period smoothed moving average. Cross representative indication of the direction. I coded this indicator according to the description of MT4, a little work.
重心點(Center of Gravity)是由約翰.艾勒斯在2002年開發的,這個指標的主要用途是儘早發現可能的反轉點。它有兩個部份,一個是重心點指標線,另一個是經過五期平滑移動平均線平滑過的信號線,它們的交叉結果代表方向。我按照MT4的說明編寫了這個小作品。

Fixed TimeFrame SMMAA script for SMMA calculated on fixed timeframe, different from the main chart's timeframe.
As it's known, we can't use mutable variables with security. At the same time, SMMA references to the previous values. So it's impossible to create SMMA on different timeframe, just passing a variable with SMMA to security.
To overcome this restriction, we should use a function, which calculates SMMA and we are passing the function to the security, so the function will be calculated on required timeframe.

Balance of Power StrategyA simple variation on the balance of power idea, using a weighted moving average and a basic lookback to attempt to predict the motion in the next tick.
As far as a trading pattern goes, it's performance is rather conservative, and it is rather noisy as it doesn't do a good job of preventing quick, meaningless trades.
Modiied Elder Ray Index(Bull or Bear)Here's a modified version of the Elder Ray Index created by the famed Dr.Alexander Elder. This indicator has proven to be especially helpful lately given the crazy state of crypto.
Slow Moving Average :
The top chart shows the moving average used to filter trends. I recommend using a higher window length(can be adjusted with the 'lenSlowMA' input option). I wanted this to be a very smooth moving average, so I used the following formula:
slow MA = ema(vwma(close, 64), 64)
This resulted in a pretty smooth line that still detects major price movements very well.
-The background and bar colors both change in response to the Slow MA's value. The background and bars change to green when a bullish trend is detected and red when bearish.
Bear and Bull Power :
To balance things out a little, I included two histogram's based on Elder's Ray. Here, a more responsive EMA with a shorter window length is used to calculate the bull and bear power values and track short-term price fluctuations.
NOTE: The length of the EMA used here can be adjusted in the input menu.
Bull Power = current high - EMA(close, 13)
Bear Power = current low - EMA(close, 13)

Savitzky-Golay Smoothing FilterThe Savitzky-Golay Filter is a polynomial smoothing filter.
This version implements 3rd degree polynomials using coefficients from Savitzky and Golay's table, specifically the coefficients for a 5-, 7-, 9-, 15- and 25-point window moving averages.
The filters are offset to the left by the number of coefficients (n-1)/2 so it smooths on top of the actual curve.
You can turn off some of the smoothing curves, as it can get cluttered displaying all at once.
Any feedback is very welcome.

Alto Basso Swing Pivots + Barry Support Resistance Levels2 indicators, 1 script: swing pivots and Barry support resistance levels
Alto
high swing pivot
Basso
low swing pivot
Dal Segno
lookback period length for swing pivots
Barry Length
length for support resistance calculation
--------------------------------------------------------------------------------------------------------------------------------------------------------------------------------------------
Use swing pivots for confirmation of new structure levels on short term
Barry support resistance levels in proximity to standard pivots or Fibonacci levels may indicate greater strength
credit to BacktestRookies and likebike
stay ♯
Example: Dal Segno 13, Barry Length 21

Reap Hull SMA CrossoverHi this is my first script, it is a HMA 144 crossover with SMA 5 changes background (still needs work), provides alerts for crossover

Single_Timeframe_3EMA + Current_Timeframe_3SMMAPlots 3 EMA from a larger timeframe (day, week) and 3 SMMA from the current one.
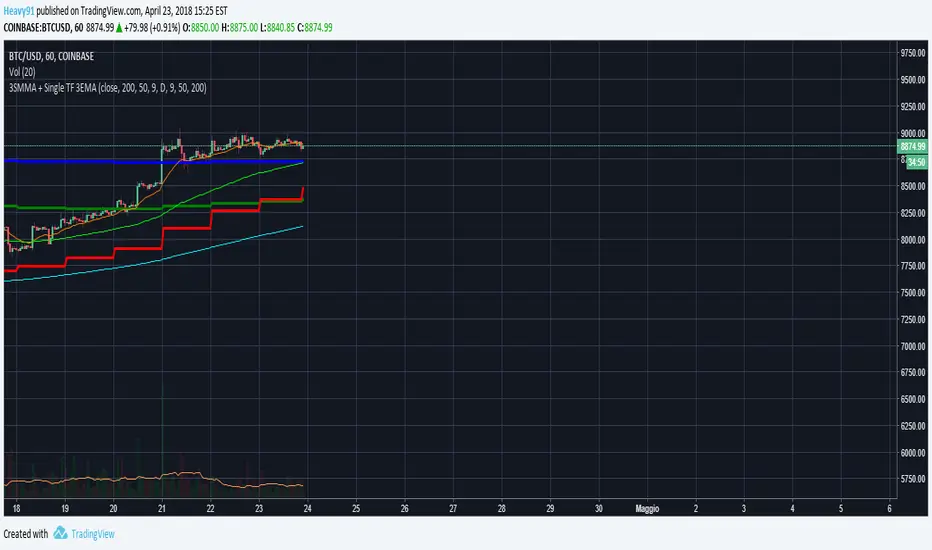
Single Timeframe 3EMA + Current Timeframe 3SMMA
Plots 3 exponential moving averages from a bigger timeframe (Day, Week) and 3 smoothed moving averages from the current timeframe.

XBTUSD for BitMEX [ BB Long term strategy ]XBTUSD for BitMEX
『おすすめストラテジーSS1』(BitMEXビットコイン用Pineスクリプト)自動売買のアイデアに!

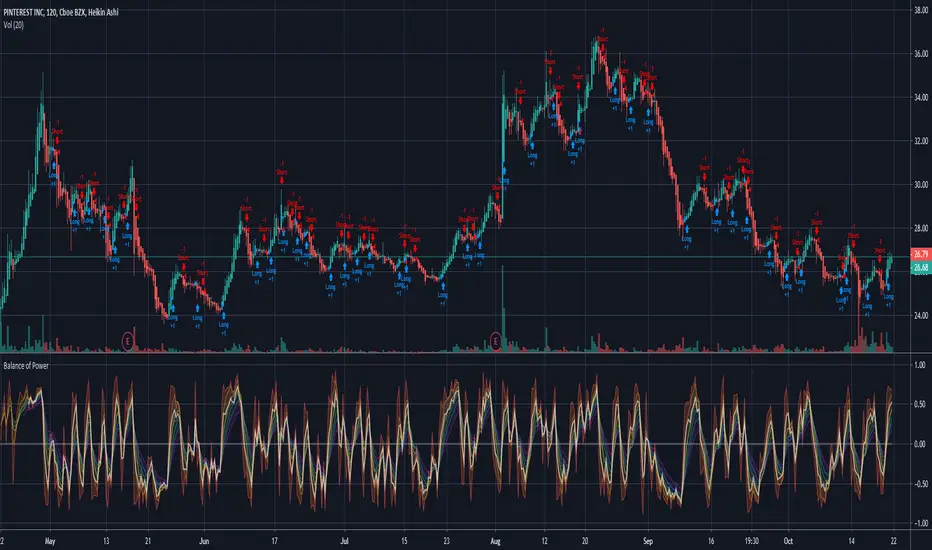
SMMA Analyses - Buy / Sell signals and close position signals This script combines the usage of the SMMA indicator in order to provide signals for opening and closing trades, either buy or sell signals.
It uses two SMMA , a fast and a slow one, both configurable by the users.
The trigger of Buy and Sell Signals are calculated through the SMMA crosses:
Buy Signals : The fast SMMA crosses over the slow SMMA . They are highlighting by a green area and a "B" label.
Sell Signals : The fast SMMA crosses under the slow SMMA . They are highlighting by a red area and a "S" label
The trigger of Close Buy and Close Sell Signals are calculated through the close price crosses with the fast SMMA:
Close Buy Signals : The fast SMMA crosses under the close price and at the same time the trend is bullish , so the fast SMMA is greater than the slow SMMA . They are highlighted by a lighter green area
Close Sell Signals : The fast SMMA crosses over the close price and at the same time the trend is bearish , so the fast SMMA is lower than the slow SMMA . They are highlighted by a lighter red area
Few important points about the indicator and the produced signals :
This is not intended to be a strategy, but an indicator for analyzing the SMMA conditions. It gives you the triggers depending on the real time analysis of the SMMA and prices, but not being a proper strategy, pay attention about "fake signals" and add always a visual analysis to the provided signals
Following this indicator, the trade positions should be opened only when a cross happens. Either in this case, analyse the chart in order to see if the signals are a "weak" ones, due to "waves" around the SMMA . In these cases, you might wait for the next confirmation signals after the waves, when the trend will be better defined
The close trade signals are provided in order to help to understand when you should close the buy or sell trades. Even in this case, always add a visual analysis to the signals, and pay attention to the support/resistance areas. Sometimes, you can have the close signals in correspondence to support/resistance areas: in these cases wait for the definition of the trend and eventually for the next close trade signals if they will be better defined

Ehler's Super Smoother strategyThis strategy is a mean-reversal strategy based on John F. Ehlers's Super Smoother filter. I tried it on 15m timeframe with 'Recalculate After Order Filled' option checked.

Kozlod - Yet Another Moving Average Cross Strategy (9 MA types)You can choose one of these MA types in params:
Simple Moving Average (SMA)
Exponential Moving Average (EMA)
Weighted Moving Average (WMA)
Arnaud Legoux Moving Average (ALMA)
Hull Moving Average (HMA)
Volume-weighted Moving Average (VWMA)
Least Square Moving Average (LSMA)
Smoothed Moving Average (SMMA)
Double Exponential Moving Average (DEMA)
Also you can select SL/PT % levels.

Log Smoothed Moving AverageThis indicator has two features that make it better than standard SMMA for cryptocurrencies:
- starts from the very first candle
- calculations are performed in log-space which means less sensitivity to extreme volatility common in crypto world
