Candlesticks ANN for Stock Markets TF : 1WHello, this script consists of training candlesticks with Artificial Neural Networks (ANN).
In addition to the first series, candlesticks' bodies and wicks were also introduced as training inputs.
The inputs are individually trained to find the relationship between the subsequent historical value of all candlestick values 1.(High,Low,Close,Open)
The outputs are adapted to the current values with a simple forecast code.
Once the OHLC value is found, the exponential moving averages of 5 and 20 periods are used.
Reminder : OHLC = (Open + High + Close + Low ) / 4
First version :
Script is designed for S&P 500 Indices,Funds,ETFs, especially S&P 500 Stocks,and for all liquid Stocks all around the World.
NOTE: This script is only suitable for 1W time-frame for Stocks.
The average training error rates are less than 5 per thousand for each candlestick variable. (Average Error < 0.005 )
I've just finished it and haven't tested it in detail.
So let's use it carefully as a supporter.
Best regards !
מניות

BEST Algorithm Builder STOCKSHello traders 👋
I. 💎 SCRIPTS ACCESS AND TRIALS 💎
1. Every trial request access has to be done through my website.
2. My website URL is in this script signature at the very bottom (you'll have to scroll down a bit and going past the long description) and in my profile status available here: Daveatt profile status
3. Many video tutorials explaining clearly how all our indicators work are available on our website > guides section and also on website forum + Youtube
4. You may also contact me directly for more information regarding the trading method included in the indicator or how to access it
II. Forewords
(Screenshot based on $FCEL - FUELCELL ENERGY Inc.)
This indicator is for the SWING traders looking for fixed entries based on our proprietary trading method. It's a nice complement to any intraday method
We've been working on it for months and releasing now for our subscribers.
We mostly trade the US stocks with it due to personal preference but it's working also with other international stocks.
All stocks sectors (tech, aerospace, food, energy, financial, healthcare, ...) are eligible.
We've seen quite great signals with penny stocks/biotech/tech stocks.
III. Optimized system for lowering risk/capturing most of the opportunities
We worked hard on reducing the risk as much as we could.
The built-in hard-exit (also called invalidation) system does a huge job in exiting a position way before a Stop Loss will get hit
$TSLA (TESLA)
$SAVA (CASSAVA SCIENCES)
IV. Trade Manager and compatible with dynamic alerts
It includes :
- our proprietary method with fixed entries
- a hard exit system (built-in stop-loss)
- multiple options for user-defined stop-loss/take-profit settings (price value, distance in pips, percentage, trailing, ...)
- 🔔 Compatible with dynamic alerts 🔔
Dynamic alerts are bringing automated trading to a whole new level. The third-party solutions capturing TradingView alerts are able to use them.
- Algorithmic Supports and Resistances used as safeguards and take profit zones
Final words
We made it as simple as we could (to be honest it's a very simple system for the end-user) - even with several hundreds of calculations in the indicator.
Please hit me up for any questions/feedback/comments
Become the BEST trader you deserve to be
Dave

Trendy Bar Trend ColorTrendy Bar Trend Color
Inspired by trend candlestick charts on other trading platforms. Changes bar colors to stay in trend much like Heikin Ashi candles without the ATR price distortion. This is done by comparing the HL2 and/or Open-Close values of current candlestick to the prior candlestick.

Live Mini Terminal 6 : Major U.S Indices Change DataThis script displays relative data changes occurring in the adjustable period and/or adaptive automatic period in US Major Indices.
It was inspired by the data terminals used by commercial traders.
Period selection can be adjusted in the menu.
This script uses the adaptive period algorithm used by Autonomous LSTM and Relativity scripts.
Or you can set the period manually from the menu.
For more information about adaptive period this script uses:
This script works only for 1 day (1D) and 1 week (1W) time frames.
The most efficient time frame is 1 week (1W) because of different time-zones .
Features
Value changes on a percentage basis (%)
Recently, due to increasing interest, the NQNACE index has been added.
Index descriptions are printed on the information panel.
Sentiment NYSE ARCA and AMEX indices added.
INSTRUMENTS
SP1! : S&P 500 Futures Index
DJI : Dow Jones Industrial Average Index
NDX : Nasdaq 100 Index
RUT : Russell 2000 Index
NYA : NYSE Composite Index
OSX : PHLX Oil Service Sector Index
HGX : PHLX Housing Sector Index
UTY : PHLX Utility Sector Index
SOX : PHLX Semiconductor Sector Index
SPSIBI : S&P Biotechnology Select Industry Index
XNG : NYSE ARCA Natural Gas Index
SPGSCI : S&P Goldman Sachs Commodity Index
XAU : PHLX Gold and Silver Sector Index
SPSIOP : S&P Oil and Gas Exploration and Production Select Industry Index
GDM : NYSE ARCA Gold Miners Index
DRG : NYSE ARCA Pharmaceutical Index
TOB : NYSE ARCA Tobacco Index
DFI : NYSE ARCA Defense Index
NWX : NYSE ARCA Networking Index
XCI : NYSE ARCA Computer Technology
XOI : AMEX Oil Index
XAL : AMEX Airline Index
NQNACE : Nasdaq Yewno North America Cannabis Economy Index
USAGE
The script can be used as an indicator by putting it under the chart as shown above.
It is necessary to enlarge to see clearly.
Since it is not often looked at,such use is the best method for healthy interpretation.
Regards.

Live Mini Terminal 2 : Relative USD Based Stock Markets Change This script displays relative data changes occurring in the adjustable period and/or adaptive automatic period in various stock markets.
It was inspired by the data terminals used by commercial traders.
Period selection can be set in the menu.
This script uses the adaptive period algorithm used by Autonomous LSTM and Relativity scripts.
Or you can set the period manually from the menu.
For more information about adaptive period this script uses:
This script works only for 1 day (1D) and 1 week (1W) time frames.
The most efficient time frame is 1 week because of different time-zones (1W) .
Features
Value changes on a percentage basis (%)
Stock exchange values are calculated in dollar terms.
Due to the advantage of movement, future data were chosen instead of spot values on the required instruments.
INSTRUMENTS
Usa : S&P 500 Futures
Japan: Nikkei 225 Futures
England: United Kingdom (FTSE) 100
Australia: Australia 200
Canada: S&P / TSX Composite
Switzerland: Swiss Market Index
New Zealand: NZX 50 Index
China: SSE Composite (000001)
Denmark: OMX Copenhagen 25 Index
Hong-Kong: Hang Seng Index Futures
India: Nifty 50
Norway: Oslo Bors All Share Index
Russia: MOEX Russia Index
Sweden: OMX Stockholm Index
Singapore: Singapore 30
Turkey: BIST 100
South Africa: South Africa Top 40 Index
Spain: IBEX 35
France: CAC 40
Italy: FTSE MIB Index
Netherlands: Netherlands 25
Germany : DAX
USAGE
The script can be used as an indicator by putting it under the chart as shown above.
It is necessary to enlarge to see clearly.
Since it is not often looked at,such use is the best method for healthy interpretation.

Volume per Price rate on chart
This indicator measures the change in price with volume.
"X" is displayed when the price movement is too large for the volume.
If the price movement is small, display a label.
You may be deceived if price movements are large relative to volume.
If price movements are small relative to volume, you may be collecting.
このインジケータは出来高に対する価格の変化を測定しています。
出来高に対して価格の動きが大きすぎる場合は”X"を表示します。
価格の動きが小さい場合はラベルを表示します。
出来高に対して価格の動きが大きい場合は騙されているかもしれません。
出来高に対して価格の動きが小さい場合は、集めているかもしれません。
主に株の日足に対して利用します。X印やラベルが表示された場合、相場の転換点かもしれません。

ATR CHANNEL .2Channel based on 100MA & daily ATR / volatility - whole point is to warn and show you where not to participate. Signals can be considered as higher probability trades, short term reversal type scalps - especially effective at FX and stock trading

TRENDSPOTTERHi Guys,
So TrendSpotter uses multiple indicators to catch trend moves as they happen. All you have to do it follow the entries when 2 green or red arrows appear, you enter the move.
Basically it has a few rules.
1.I trade the 1 min time-frame
2.The background turns Red ( Short ) or Green ( Long ) when the stock is going that direction.
3. Wait until the Psar is under for Long and over for Short.
4. Wait until the second Green for Long or Red for Short Arrow to appear. You are getting in on the end of the first one.
Here's my profile on Tradingview.com with all the explanations of how to use it. It can be used for FOREX and CRYPTO also.
www.tradingview.com
Check out my videos to see it's not that complicated.
If you have any questions please contact me.
Thanks,
Enda

ZoneBand (@Mido_yuiya)Bollinger band is converted to EMA , and support and resistance bands are made into regions

PpSignal RSI Bands Version 2This the mtf Rsi on the chart version
look at the picture and you can understand everything.
You have on the chart the middle line 50 overbought 70 and oversold lever 30 , like the oscillator in bellow out the chart.
we added Bollinger band 20, 1 and qqe move average, rsi on the chart (green and red line with circles), Heiken Ashi rsi style and rsi offset move average (yellow color).
Enjoy it

PpSignal RSI MTF 3.19This Rsi oscillator have a donichian channel en middle move average included.
have got a QQE or atr move average.
Show new high and new low according to the pivot point.
Show Rsi divergence.
MTF option.

Total Trend Follow Study with Alerts, Pyramid and DCA
Introduction
This is the study version of my trend following strategy. It is designed to be a “drop in” replacement for its twin strategy. I have replicated the analysis logic and entry and exit procedures to produce a nearly identical result set to the strategy. Other than the properties tab, the inputs dialog is exactly the same. Backtest the strategy to determine the best inputs to trade. Then apply the same inputs to this study to forward test. Alerts are available for trade entry, take profit close, stop-loss exit and pyramid level. Please see the strategy version for a complete description of the trading behavior of this script.
In brief, this script is intended to benefit from long duration trending markets. The trading behavior is to buy on strength and sell on weakness. As such the trade orders maintain its directional bias according to price pressure. What you will see on the chart is long positions on the left side of the mountain and short on the right. Long and short positions are not intermingled as long as there exists a detectable trend. My trend following script uses the same pivot point calculations used by my range trader but this time rising pivots are long and falling pivots are short. I refer to pivots as a vertex in the inputs dialog box. The cone based measurement adds a peak, sides and a base to the calculation elements. This allows the inputs to focus on adjusting the location of trades and not just trend lines. The pivot points can be plotted on the backtest. You can use the vertex input values to move the pivots where you want trades to be. This script can be traded in four different modes: Long, Short, BiDir, and Flip Flop.
This script replicates the TradingView pyramid feature by adding a field to the inputs tab. Pyramiding works the same way in this script as its twin strategy. Each pyramid level increases the order size as a multiple of its level. This makes it easy to comply with NFA FIFO Rule 2-43(b) if the trades are executed here in America. The current pyramid level is reported in the summary label when reports are enabled. You can use this value to manually adjust the position size in your forward testing. I also expose an alert when the pyramid threshold is breached. Use the TradingView alert window to send yourself a message when the level increases.
In addition to pyramiding this script employs a DCA feature which can increase the order size in response to stopped out or winning streak trades. The number of losing trades is tracked through the “Debt Sequence” value displayed in the summary report. When the debt is recovered the sequence number resets to zero. You can use the “Debt Sequence” number to manually manage DCA on your forward test. The main difference between DCA and pyramids is that this implementation of DCA applies to new trades while pyramids affect open positions. If DCA is enabled be sure to set the limiter to prevent your account from depleting capital during runaway markets.
I also have a range trading version of this script for those not interested in trend following.
Design
This script is approximately 1800 lines of Pine 4 code and implements nine indicators on two time frames. The chart (primary) interval and one higher time frame which is based on the primary. The higher time frame identifies the trend for which the primary will trade. The original trading algorithms are a port from a much larger program on another trading platform. I've converted some of the statistical functions to use standard indicators available on TradingView. The setups make heavy use of the Hull Moving Average in conjunction with EMAs that form the Bill Williams Alligator as described in his book “New Trading Dimensions” Chapter 3. Lag between the Hull and the EMAs form the basis of the entry and exit points. The alligator itself is used to identify the trend main body.
Indicator Repainting
Indicator repainting is an industry wide problem which mainly occurs when you mix backtest data with real-time data. It doesn't matter which platform you use some form of this condition will manifest itself on your chart over time. The TradingView wiki has an in depth article on this subject in regard to the elements of the Pine language which contribute or are susceptible to this effect. In dealing with this problem from a prevention aspect in Pine, you have to accept some repaint to occur.
The goal of my repaint prevention in the study script is simply to ensure that my signal trading bias remains consistent between the strategy, study and broker. This actually turned out to be kind of a job since it interfered with another project goal to synchronize the entry and exits between the strategy and study scripts. The script execution engines are different between the Pine strategy and study. While the primary chart interval is quite manageable the higher time frame requires the security() function. TradingViewʼs higher time frame implementation, which interleaves the chart interval, combined with the critical “lookahead” parameter makes the solution necessarily complex. According the wiki regarding this issue, best practice comes down to the following two methods:
1. a = security(syminfo.tickerid, 'D', close , lookahead=barmerge.lookahead_on)
2. indexHighTF = barstate.isrealtime ? 1 : 0
indexCurrTF = barstate.isrealtime ? 0 : 1
a0 = security(syminfo.tickerid, 'D', close ,lookahead=barmerge.lookahead_off)
a = a0
This script employs method 2 with the only problem being the Pine sar() function which does not expose its internal bar series. The best work around would require hand coding the parabolic but the script is at the maximum local scopes and run-time duration so that option is not viable. So far, this hasn't proven to be much of a problem. I'm currently running several symbols, forex and crypto, the strategy and study remain highly correlated with no instances of completely opposite real-time signals. However, I have received some alerts with no corresponding plot on the chart but so far it only occurred on one symbol. I will continue to monitor this problem.
The Bottom Line. Does this script repaint. Yes, it will repaint about as much as every other multi-interval script which employs the best practice solutions available in the Pine Language.
Usage
Please be aware that the purpose of the study script is to perform forward testing of the configuration established in the backtest process. Therefore, the usage here in the study begins with the backtest configuration parameters. The following steps provide instructions to get this study script connected to the TradingView alert notification system. For a detailed description of how to create a trend following system using this script please see the strategy version.
Step 1. Create a chart with the trading instrument and interval used in the backtest.
Step 2. Find this script in the “Invite Only” section of the Indicators Dialog and apply it to the current chart.
Step 3. Copy the values from the backtest input dialog to the study.
Step 4. Open the TradingView Alert window.
Step 5. In the “Condition” drop down field find and select the name of the script.
Step 6. A new drop down field will appear with the alerts available in the script. This script exposes the following eight signals:
-- Long Entry Signal
-- Long Profit Signal
-- Long Stop-loss Signal
-- Long Pyramid
-- Short Entry Signal
-- Short Profit Signal
-- Short Stop-loss Signal
-- Short Pyramid
Select the signal for which you want notification.
Step 7. In the “Options” field select the frequency of the alert. Typically, "Once Per Bar" or "Once Per Bar Close" will be sufficient.
Step 8. Set the expiration date and time.
Step 9. Select the action of the alert. Currently TradingView offers six different actions:
-- Notify on App
-- Show Popup
-- Send Email
-- Webhook URL
-- Play Sound
-- Send Email to SMS
Step 10. Create a message to to transmitted with the alert. The script provides a default message which can be overridden with any custom description. The price, time and other reserved chart elements can be included in the message
Step 11. Click the “Create” button to generate this single alert.
Step 12. Repeat steps 1 through 11 for every signal you wish to receive.
This script is open for beta testing. After successful beta test it will become a commercial application available by subscription only. I’ve invested quite a lot of time and effort into making this the best possible signal generator for all of the instruments I intend to trade. I certainly welcome any suggestions for improvements. Thank you all in advance.

JARVISJARVIS is a technical indicator primarily designed for Nifty Bank. But, it also works on other instruments like stocks for example. You may apply it on other instruments if you find it useful.
Once the indicator is plotted, it will have bars with 3 colours
1) Blue - It's watching
2) Green - It's bullish
3) Red - It's bearish
So, it's that easy to interpret.
Following are few examples on NSE:BANKNIFTY
September 20, 2019 - Indicator turned green and remained so till end of the day. If you would have followed this, you would have made more than 2000 points.
September 25, 2019 - Indicator turned red and remained so till end of the day. If you would have followed this, you would have made more than 100 points.
September 26, 2019 and September 27, 2019 - Indicator remained blue and you see that the market was just consolidating.
Above are just a few examples of what this is capable of. Apart from Nifty Bank, it also works well on popular stocks like Reliance, TCS, SBIN etc
Recommended time frame for this is 15 mins, but, you may experiment with other time frames as well. It's all about finding the right time frame for that particular instrument, for example it works best on 2H when applied on Nifty.
Should you have any doubts, feel free to DM me.

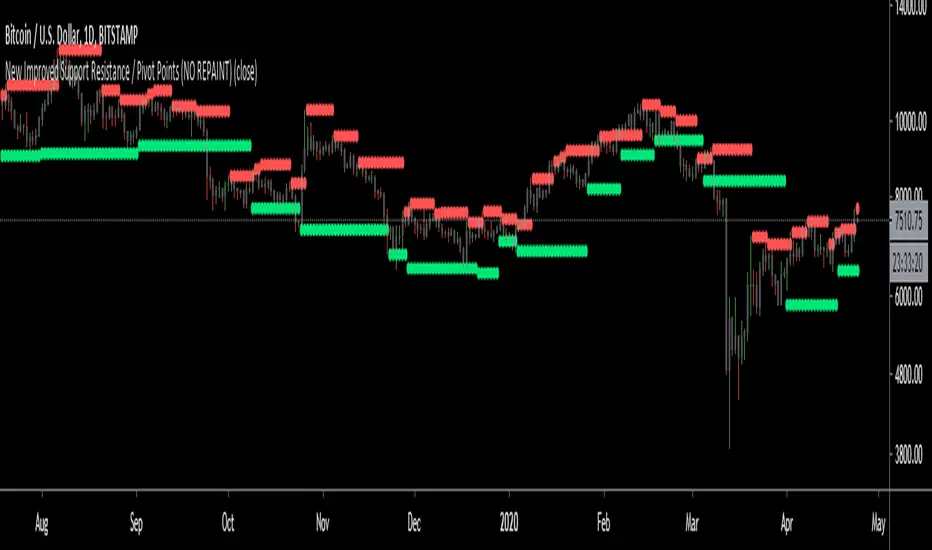
New Improved Support Resistance / Pivot Points (NO REPAINT)This indicator plots local pivot points / support resistance levels in real time (No Repaint). I created this indicator based on my own research and testing (i.e. it is not just a a Pinescript adaptation of some other indicator available online).
The Problem with Similar Indicators Which Are Currently Available On TradingView:
Inaccurate placement of swing/pivot/SR points (making your screen cluttered with meaningless levels).
Repainting (meaning the historical values change as new data becomes available; this is misleading and not very useful when trading in real time).
Have a long delay before confirming/plotting the new pivot points (20/20 hindsight...).
Require you to specify a lookback period and simply looks for the highest or lowest value over that time frame (which isn't very useful since it disregards all of the swings in between).
Do not show all of the historical swing levels, only the most recent ones.
My Solution:
Accurately places swing/pivot/SR points on local highs and lows once a short term trend is over (allowing you to easily identify reversal points).
Does not repaint (the historic values shown are exactly what would have been seen upon the close of the given candles in live trading; this means you can use this indicator for live trading).
Has minimal lag. New swing lows/highs are typically identified by this indicator on the candle which immediately following the swing point (this allows for better entries/exits rather than waiting for the price to run too far in the wrong direction before confirmation).
No lookback period required. The indicator will automatically identify new swings regardless how long the run lasts.
Allows you to adjust for more/less sensitivity.
P.S.: Future developments will be using these levels to create an automatic plot of fibonacci retracement levels.
Full Range Trading Study with Alerts and DCA
Introduction
This is the study version of my range trading strategy. It is designed to be a “drop in” replacement for its twin strategy. I have replicated the analysis logic and entry and exit procedures to produce a nearly identical result set to the strategy. Other than the properties tab, the inputs dialog is exactly the same. Backtest the strategy to determine the best inputs to trade. Then apply the same inputs to this study to forward test. Alerts are available for trade entry, take profit close and stop-loss exit. Please see the strategy version for a complete description of the trading behavior of this script.
In brief, this script is intended to benefit from a range bound market. The trading behavior is to buy on weakness and sell on strength. As such trade orders are placed in a counter direction to price pressure. What you will see on the chart is a short position on peaks and a long position on valleys. This is accomplished by calculating pivot points from the price stream. Rising pivots are shorts and falling pivots are longs. I refer to pivots as a vertex in the inputs dialog box. The cone based measurement adds a peak, sides and a base to the calculation elements. This allows the inputs to focus on adjusting the location of trades and not just trend lines. The pivot points can be plotted on the backtest. You can use the vertex input values to move the pivots where you want trades to be. This script can be traded in four different modes: Long, Short, BiDir, and Ping Pong. When trading in “Ping Pong” mode long and short positions are intermingled continuously as long as there exists a detectable vertex. I also have a trend following version of this script for those not interested in trading the range.
This script employs a DCA feature which enables users to experiment with loss recovery techniques in the backtest. Here in the study the summary report displays the “Debt Sequence” number which can be used to manually increase the order size on subsequent trades at the broker. The script keeps track of debt incurred from losing trades. When the debt is recovered the “Debt Sequence” resets to zero so orders can return to the base size. Be sure to set the limiter to prevent your account from depleting capital during runaway markets.
Consecutive loss limit can be set to report a breach of the threshold value. Every stop hit beyond this limit will be reported on a version 4 label above the bar where the stop is hit. Use the consecutive loss limit to manually halt live trading on the broker side.
Design
This script uses twelve indicators on a single time frame and is approximately 1800 lines of Pine 4 code. The original trading algorithms are a port from a much larger program on another trading platform. I’ve converted some of the statistical functions to use standard indicators available on TradingView. The setups make heavy use of the Hull Moving Average in conjunction with EMAs that form the Bill Williams Alligator as described in his book “New Trading Dimensions” Chapter 3. Lag between the Hull and the EMAs form the basis of the entry and exit points. The vertices are calculated using one of five featured indicators: Volume, Histogram, Fractal, Candle and Macro. The backtest is used to determine the best fit for your desired trading instrument. The incorporation of five distinct pivot point calculations broadens the scope of the markets where this tool can be beneficial.
Example configurations for various instruments along with a detailed PDF user manual is available.
Indicator Repainting
Please see the strategy script for a more detailed description of the repaint problem. The goal of my repaint prevention in the study script is simply to ensure that my signal trading bias remains consistent between the strategy, study and broker. This script employs the following conventions in effort to avoid indicator repainting:
1. This script uses only 1 time frame. The chart interval.
2. Every entry and exit condition is evaluated on closed bars only.
3. Entry and exit plots are not triggered off trend line crossovers.
4. No security functions are called to avoid a look-ahead possibility.
5. Every contributing factor specified in the TradingView wiki regarding this issue has been addressed. Except the use of the exponential moving average which is essential to my strategy.
6. I’ve run a 10 minute chart live for a week and compared it to the same chart periodically reloaded. The two charts were highly correlated with no instances of completely opposite real-time signals
This script does indeed bring up the TradingView warning dialog. The only reason for this is due to “peculiarities of the algorithm” regarding the EMA as stated in the wiki article.
The Bottom Line. Does this script repaint. Yes, it will repaint about as much as every other trading platform which combines backtest data with real time prices in a live trading scenario.
Usage
Please be aware that the purpose of the study script is to perform forward testing of the configuration established in the backtest process. Therefore, the usage here in the study begins with the backtest configuration parameters. The following steps provide instructions to get this study script connected to the TradingView alert notification system. For a detailed description of how to create a range trading system using this script please see the strategy version.
Step 1. Create a chart with the trading instrument and interval used in the backtest.
Step 2. Find this script in the “Invite Only” section of the Indicators Dialog and apply it to the current chart.
Step 3. Copy the values from the backtest input dialog to the study.
Step 4. Open the TradingView Alert window.
Step 5. In the “Condition” drop down field find and select the name of the script.
Step 6. A new drop down field will appear with the alerts available in the script. This script exposes the following six signals:
Long Entry Signal
Long Profit Signal
Long Stop-loss Signal
Short Entry Signal
Short Profit Signal
Short Stop-loss Signal
Select the signal for which you want notification.
Step 7. In the “Options” field select the frequency of the alert. Typically, "Once Per Bar" or "Once Per Bar Close" will be sufficient.
Step 8. Set the expiration date and time.
Step 9. Select the action of the alert. Currently TradingView offers six different actions:
Notify on App
Show Popup
Send Email
Webhook URL
Play Sound
Send Email to SMS
Step 10. Create a message to to transmitted with the alert. The script provides a default message which can be overridden with any custom description. The price, time and other reserved chart elements can be included in the message
Step 11. Click the “Create” button to generate this single alert.
Step 12. Repeat steps 1 through 11 for every signal you wish to receive.
This script is open for beta testing. After successful beta test it will become a commercial application available by subscription only. I’ve invested quite a lot of time and effort into making this the best possible signal generator for all of the instruments I intend to trade. I certainly welcome any suggestions for improvements. Thank you all in advance.

Algorithm Builder UNIVERSAL (m30)Hello traders 👋
I. 💎 SCRIPTS ACCESS AND TRIALS 💎
1. Every 3 weeks trial request access has to be done through my website .
2. My website URL is in this script signature at the very bottom (you'll have to scroll down a bit and going past the long description) and in my profile status available here : Daveatt
3. Many video tutorials explaining clearly how all our indicators work are available on your website > guides section.
4. You may also contact me directly for more information regarding the trading method included in the indicator or how to access it
2.1 Forewords
This indicator/trading framework is available only to our PREMIUM users.
We decided to call it "UNIVERSAL" because the tool gives very decent signals for STOCKS/PENNY STOCKS/FOREX/CRYPTO (USD & BTC pairing)/INDICES/COMMODITIES trading
(the asset classes that I'm not listing are not tested yet; though we should cover a wide range of tradable assets here)
This is a by-product of defining an algorithmic trading method... we were surprised ourselves those past few weeks while trading with it.
The entries displayed are most of the time amazing, and the invalidations allow to reduce the losses considerably (more wins and less losses => delighted trader)
A few examples below showing why it's "universal"
FOREX
INDICES
COMMODITIES
CRYPTO (BTC pairing)
The tool works in m30 timeframe but won't work with any other timeframe . Even if applied on a 30-minutes chart; we included higher timeframe indicators to enter more securely.
It includes :
- our proprietary method with fixed entries
- a hard exit system (built-in stop-loss)
- 🔔 Compatible with dynamic alerts 🔔
Dynamic alerts are bringing automated trading to a whole new level. The third-party solutions capturing TradingView alerts are able to use them.
- (optional) we let the users decide to use or not our built-in Trade Manager.
Regardless of the Trade Manager is used or not, one must mandatory exit, once a vertical hard exit bar appears.
- the Algorithmic Supports and Resistances used as safeguards and take profit zones.
Final words
We made it as simple as we could (to be honest it's a very simple system for the end-user) - even with several hundreds of calculations in the indicator.
Please hit me up for any question/feedback/comment
Become the BEST trader that you can be
Dave

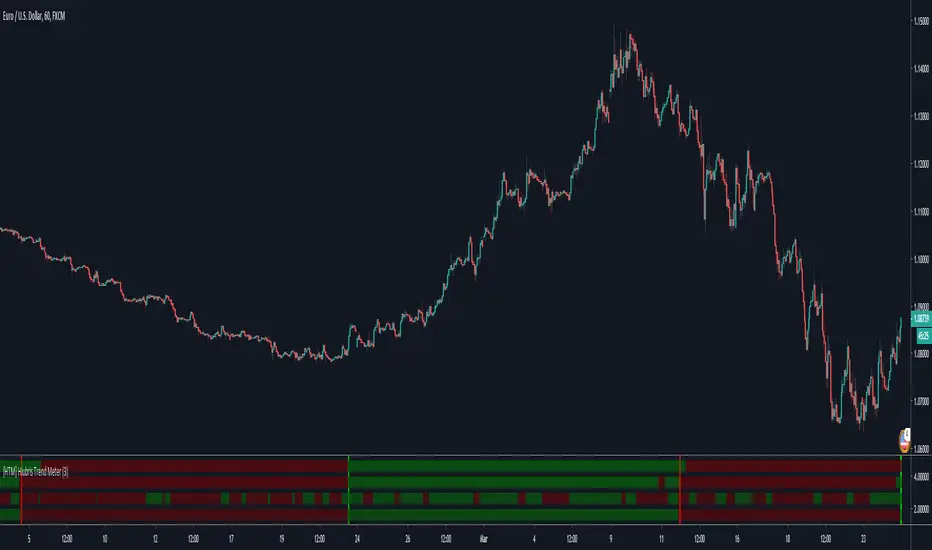
[HTM] Hiubris Trend MeterHOW IT WORKS
This indicator consists of 4 Different Trend Indicators: Gann HILO Activator , Trend Wave Oscillator and 2 Parabolic SAR’s
HOW TO USE
1. When the majority of the meters turn green, it is a sign the market is heading up.
2. When the majority of the meters turn red, it is a sign the market is going down.
- The user has the option to select how many meters must allign for a signal to show
- The indicator also has the ability to setup Alerts when the selected number of meters turn green or red. This feature is also signaled by the red or green vertical lines.
NOTES
This is script is meant to be used as an auxiliary Indicator to confirm your entries, but it is as good on it's own, as you can see in the Backtesting Results
We used the best combination of indicators so you can be sure that, no matter what ticker you're trading (Forex, Stocks or Crypto) - when you get a full green, or full red meter, the price is 100% trending in that direction!
* This indicator does NOT Repaint! None of our published indicators repaint!
Rolling Moving Average, SMA/EMA, for IPO stocksThe script replicates the standard EMA/SMA used by tradingview, but also adds an estimate for the first X periods, where X is the length of the moving average. This allows for an estimate of support resistance in IPO stocks, when fewer date is available

Multi-EMA | 5 EMAs in 1 ScriptAdd up to 5 EMAs to your charts with this script.
Fully Customizable.
----------------------------------------
Wanna try my other scripts?
Histogram with Divergence Finder:
Willams %R with 13 EMA and Divergence Finder:
More scripts here:
www.tradingview.com
Dynamic Weekly Price Envelope
This is a indicator that I have been developing and personally using for over a year. The basic concept is a dynamic range that is derived from the previous weeks range. The main philosophy followed when designing this indicator was that it should be applicable to all asset classes, and it should provide objective price levels of support and resistance that do not change when price approaches them. This indicator is most useful in range bound price action, but gives a lot of useful information on any market condition at a glance. The indicator also generates a custom vwap that reflects the volume weighted price since the price broke significant levels.
Indicator Description
The indicators most important price levels are the top 3 lines and the bottom 3 lines. These lines are distinguished by their wider line thickness with default settings. These levels act as support and resistance, and the price entering these regions indicates that the asset is overbought or oversold. A setting is available to highlight in red or green when price is overbought or oversold. Here is an example:
This example also demonstrates one of my personal favorite signals, which is when the price reenters the central channel, then retests the overbought/oversold region, as it does in the example, shown by the second set of red arrows.
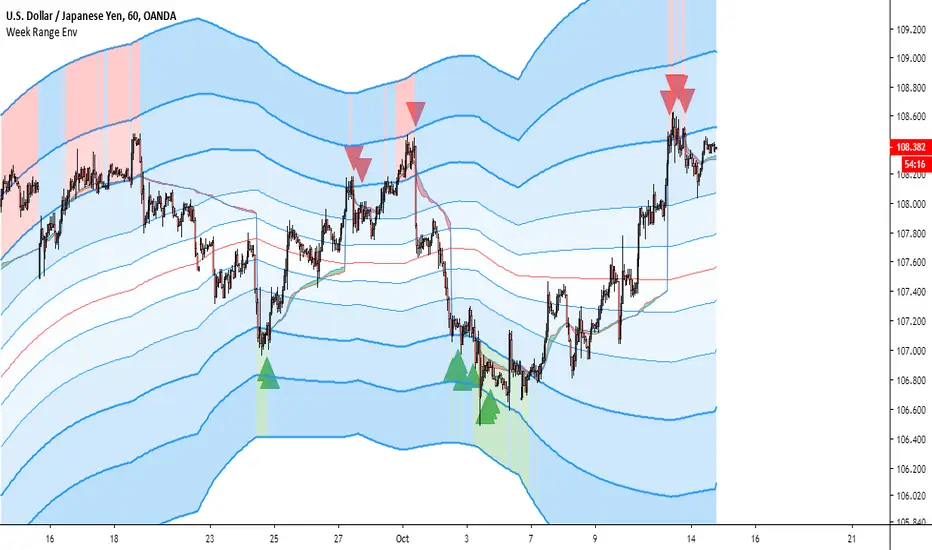
Timeframes
This indicator reacts dynamically, so the levels will look different on different timeframes. The hourly chart works best from my experience in forex and crypto with default settings, but in general lower timeframes will give a more accurate picture during extreme price action. Note: assets that have shorter sessions generally should use a smaller timeframe. I like to use 15min on stocks, this is similar to the hour chart in crypto or forex. Take this GBPUSD chart for example:
As you can see the price has a very extreme impulse, and all resistances are passed. You can see that the lines still act as support when price falls back into the range, but the indicator is not very useful when price exits the range. The solution for this is to drop down to a lower timeframe that will adjust faster to the extreme price movement.
Here you can see that the range shifts with the price movement, indicating support levels throughout the entire price impulse.
I will also drop down to lower timeframes if I want to utilize the price levels within the channel as support and resistance levels for intraday trading. Here is an example with price level interactions indicated by red and green arrows.
THe most significant levels are still the centerline and the top and bottom three levels, but the inner lines also are nice for intraday support and resistance.
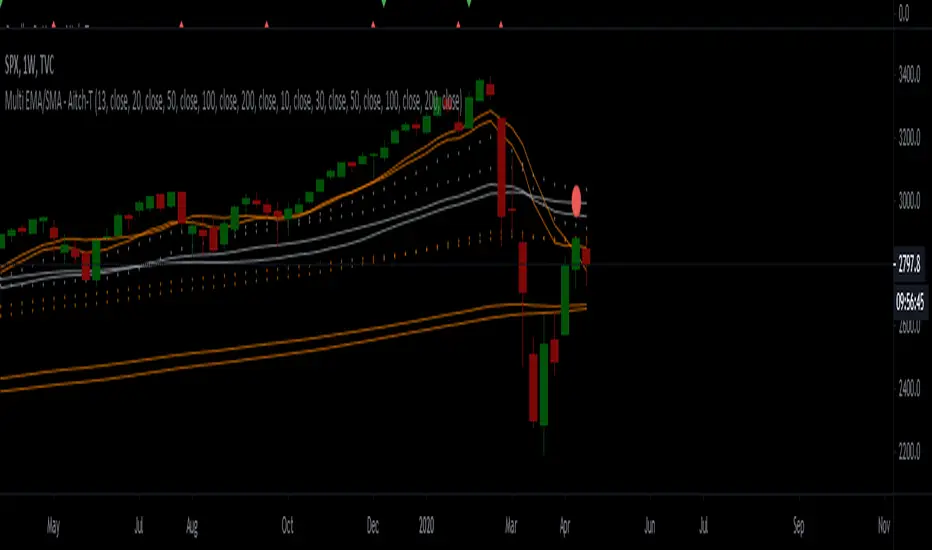
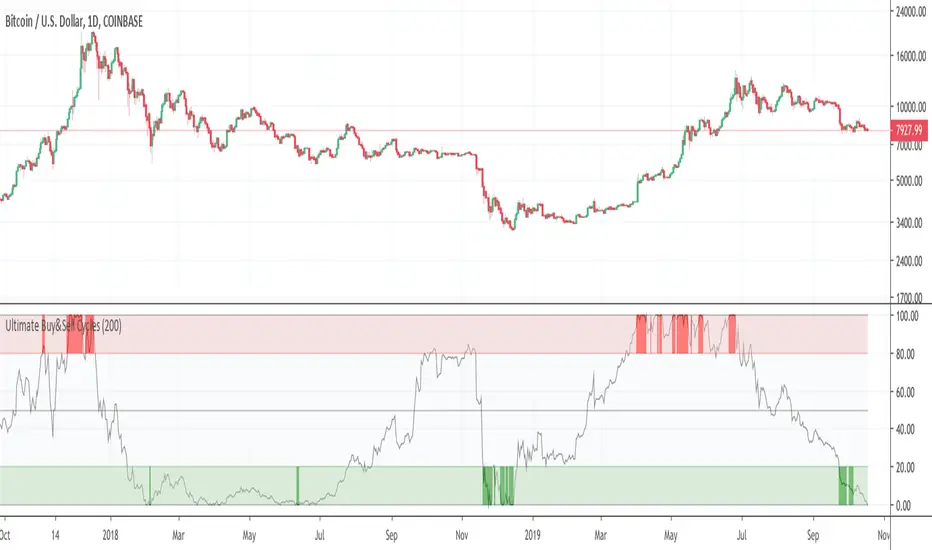
Larger time frames like the daily chart also are useful. Let's take the daily Bitcoin chart as an example:
On larger timeframes,
If price is below the central red line price is trending down, and if price is above central red line, the trend is up
The asset trading outside of the entire range indicates that the trend is very strong, reentry into the channel indicates that price is likely to consolidate.
The outer lines still serve as significant support and resistance.
Settings
I have configured the default settings to perform well for most assets, but I allow the user to change settings as they desire.
Line Color - this setting changes the color of the lines.
Fill Color - this setting changes the fill color used for the indicator
Line Transparency - The transparency of the lines, set to 100 to completely hide all lines
Base Fill Transparency - This setting changes the base transparency for the channel, this transparency will be used for the outermost bands
Transparency Gradient Step - each band will become this amount more transparent as they come closer to the centerline
Adjustment Lag - this adjusts how quickly the channel adjusts when the top and bottom levels are breached. I have always used 100, but using much higher or lower values gives interesting results.
Show Signals - This enables basic swing signals to be shown by red and green triangles. Note that this is only one signal, and the system actually has many signals outside of these triangles. They only indicate optimal entries for a swing trading technique based on the indicator.
Show Oversold/Overbought Price - ticking this box results in the fill color changing to green when price is oversold, and red when the price is overbought.
That about covers all the basics for using this indicator, please reach out with comments or messages if you would like to know anything more. Thanks for reading, and I hope you can use this tool to help your analysis. A monthly version and a refined strategy are in the works and will be published soon.
InfoPanel - SeasonalityThis panel will show which is the best month to buy a stock, index or ETF or even a cryptocurrency in the past 5 years.
Script to use only with MONTHLY timeframe.
Thanks to: RicardoSantos for his hard work.
Please use comment section for any feedback.

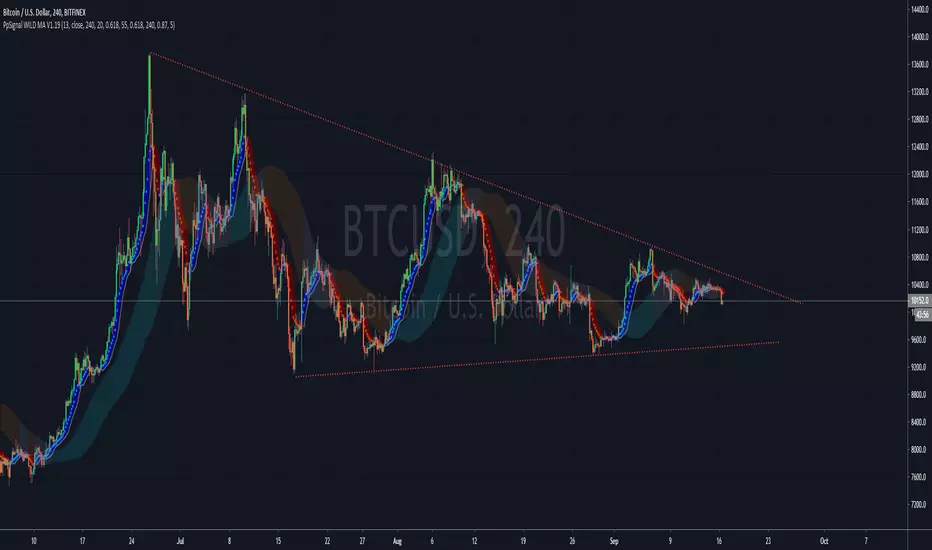
PpSignal WILD MA V1.19Wilder's Moving Average. Also called Wilder's Smoothed Moving Average, this indicator is similar to the Exponential Moving Average. Compared to other moving averages, Wilders MA responds more slowly to price changes, where an n-period Wilder MA gives similar values to a 2n- period EMA.
We added a standard deviation average.
buy when wilder is in blue color and standard average in aqua color.
Se ll when all is red