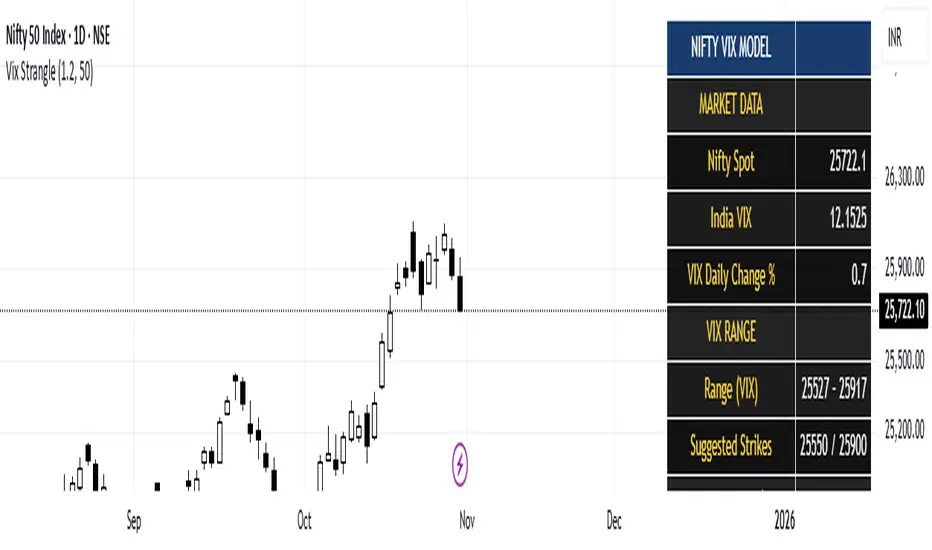
Multi Straddle-Strangle ChartThis powerful indicator is designed for options traders who want to visualize and track the combined premium of multiple straddle and strangle strategies in a single, dedicated pane.
Quickly analyze and compare up to five different options strategies at a glance, directly on your chart. This tool is perfect for monitoring volatility, tracking potential profits/losses on a position, and spotting key support and resistance levels based on option premiums.
Key Features:
Plot Up to 5 Strategies: Simultaneously plot any combination of up to 5 straddles or strangles.
Real-Time Data: Fetches live data for both Call and Put options to give you an up-to-the-second view of the combined price.
Dynamic Symbol Generation: Automatically detects the underlying symbol (e.g., NIFTY, BANKNIFTY, stocks) and builds the correct option symbols based on your input.
Customizable Inputs: Easily configure the expiry date, strike prices and line colors for each of the 5 lines.
In-Chart Summary Table: A clean and clear table in the corner of your chart provides a quick summary of each enabled strategy and its current price.
Important Note on Usage:
This tool requires you to input a strike price in all fields, even if you do not plan to use all five lines. This is necessary because of a fundamental rule in the Pine Script language: every input must have a constant, non-empty default value. The indicator is optimized to only fetch data for the lines you have explicitly enabled with the "Enable Line X" checkbox.
Strangle
0_dteUSAGE
This script guages the probability of an underlying moving a certain amount on expiration day, to aid the popular "0 dte" strategy. The script counts how many next-day moves exceeded a given magnitude in the past, under similar conditions. The inputs are:
mark_mode:
- "open": measures the magnitude as "open to close"--a true 0 dte.
- "previous close": for lazy people who don't want to wake up early. measures magnitude from the previous day's close.
move_mode:
- "percent": measures moves that exceed a given percentage.
- "absolute": measures moves that exceed a point value.
move-dir: measure only up moves, down moves, or both.
vol_model: the model for realized volatility. (may add more later).
min_vol: only measure moves when realized vol is above this value.
max_vol: only measure moves when realized vol is below this value.
precision: number of digits printed in the output table.
EXAMPLE:
- mark_mode: "previous close"
- move_mode: "percent"
- move_dir: "up"
- move_mag: 0.07
- vol_model: hv30
- min_vol: 0.2
- max_vol: 0.5
These settings will count the number of trading days that closed 7% higher than the previous day's close, when the previous day's realized volatility (annualized) was between 20% and 50%. The outputs are:
- current vol: green plot. Today's realized vol. Shown for convenience.
- max and min vol: red plots. Also shown for convenience.
- count: the number of days that exceeded the chosen magnitude, when the previous day's realized volatility was within the chosen bounds.
- total: the total number of days where realized volatility was within the chosen bounds
- probability: count / total. the percentage of days that exceeded the move when volatility was within the bounds.
- move: plotted as a purple line. purple "X" labels are plotted above
- bars where the move exceeded the magnitude threshold and volatility was in-bounds. a "hit".
CONCLUSION
This script is based on the idea that realized volatility has some bearing on future volatility. By seeing what happened in the past when volatility was close to its current value, we may be able to assess the probability that our short put will be in the money, tomorrow, and our account devastated.
NOTE: Unlike many of my other scripts, all percentages--both inputs and outputs--are given in fractional form. E.g., 0.01 means 1%.
portfolio_strikesA simple script for keeping track of your options portfolio. Basically, you can write one line of code per strategy (single, vertical, or strangle) to keep a line drawn on the underlying's chart, at the strike price, from the current bar until expiration. See the comments at the top of the code for more explanation.
strangle_pricerUsage:
1. Set the put and call strike inputs to values of your choosing.
2. Select "days to expiration".
3. Set the put and call standard deviations using the output table.
The indicator is meant help price a strangle using historical data and a volatility model. By default, the model is an ewma-method historical volatility. After selecting strikes and standard their corresponding standard deviation, theoretical values and probabilities will be shown in the table. The script is initialized with -1 for several inputs, and won't show any data until these are adjusted.
The theoretical values shown assume a strangle was bought or sold on every historical bar, and averaging their value at expiration.
For example, if you choose the $50 call and $40 put when the underlying is at $45 and there are 30 days until expiration, suppose the volatility is N and
these strikes correspond to M standard deviations. Input those and the resulting theoretial values shown will be based on opening a 30 dte call and put at M standard deviations with respect to the volatility at each bar.
- Past volatility forecasts are plotted in blue, and hidden by default.
- The current volatility forecast is drawn as a blue line.
- The put and call strikes are drawn as red lines.
This indicator is only meant for the daily chart!
Since I won't be able to edit this description later, also check the release notes and script comments for important changes.
Intrangle - Straddle / StrangleIntrangle is an indicator to assist Nifty / Bank Nifty Option Writers / Sellers to identify the PE / CE legs to Sell for Straddle and Strangle positions for Intraday.
Basic Idea : (My Conclusion for making this Indicator)
1) Last 10 Years data says Nifty / Bank Nifty More than 66% of times Index are sideways or rangebound (within 1% day) .
2) Mostly, First one hour high and low working as good support and resistance.
Once First one hour complete, this indicator will show Strangle High (CE), Strangle Low (PE) and Straddle (CE/PE).
Straddle:
If you want to do straddle strategy, sell at the money strike (CE/PE) when price comes near to the straddle line (black line),
Strangle:
If you want to do Strangle strategy, sell Strangle High (CE) and Strangle Low (PE) when price comes near to the straddle line (black line). Both Strangle High and Low will be out of the money when price near to the straddle line (black line).
Adjustment: option adjustment to be done based on the price movement. Adjustment purely up to the user / trader.
Note1: If price not comes to near straddle line after first hour, better to stay light…
Note2: If first hour not giving wide High / Low, don’t use strangle strike based on this indicator. Straddle can be done any day with require adjustment / hedge. This Indicator is purely for education purpose, user / trader has to be back-tested before their start using it.
This indicator will work in Nifty / Bank Nifty only. Best Time frames are 3/5/15 Mins. This is purely made for Intraday
Happy Trading 😊