Ichimoku Kumo Twist Strategy with Presets [Krypt]A simple strategy for testing Ichimoku settings used in the following indicator: אסטרטגיית Pine Script®מאת fskryptמעודכן 55 1 K
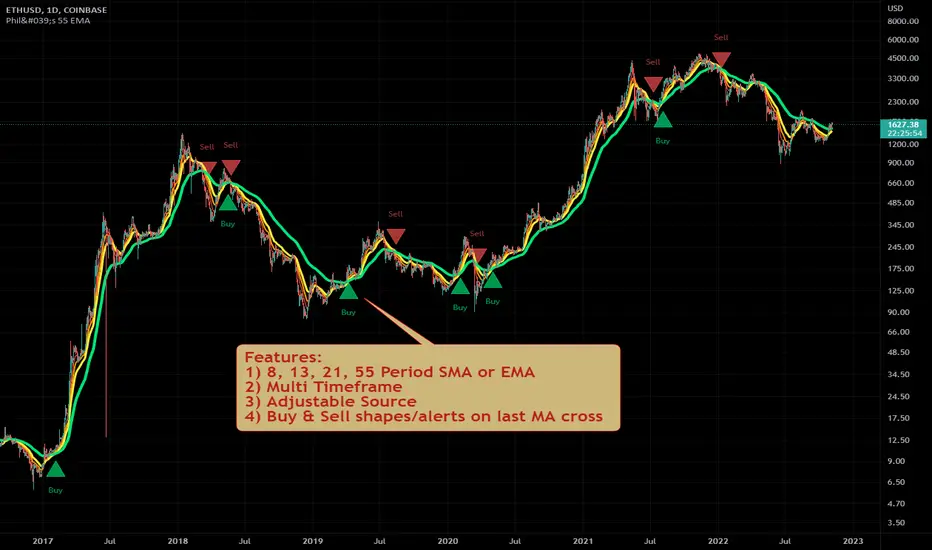
Philakone 55 EMA Swing Trading StrategyThis strategy was inspired by Philkone Crypto's "Lesson 12: Let's Learn Advanced 55 EMA Strategy" video. steemit.com Supports Buy and Sell Condition alerts and displays arrows on the chart.אינדיקטור Pine Script®מאת prosum_solutionsמעודכן 1313 4 K
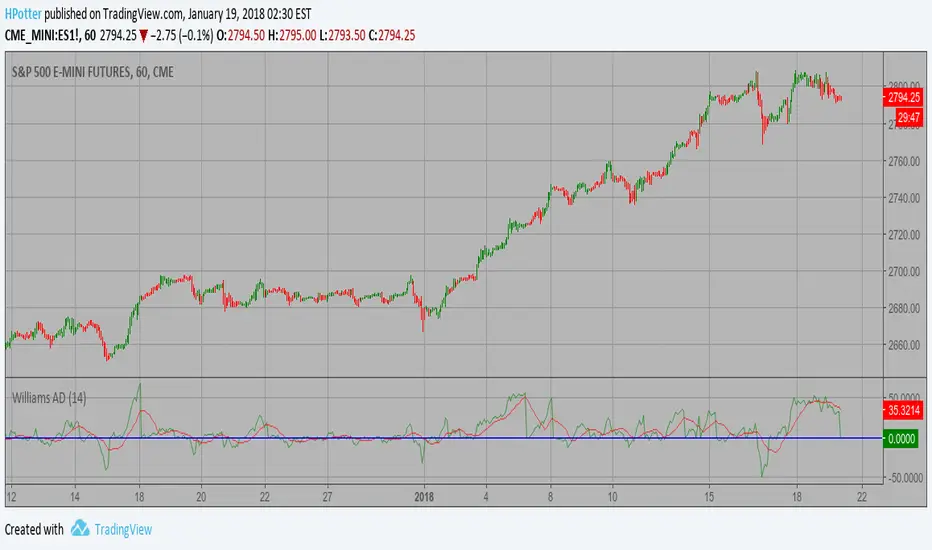
Smoothened Williams Accumulation/Distribution (Williams AD) Accumulation is a term used to describe a market controlled by buyers; whereas distribution is defined by a market controlled by sellers. Williams recommends trading this indicator based on divergences: Distribution of the security is indicated when the security is making a new high and the A/D indicator is failing to make a new high. Sell. Accumulation of the security is indicated when the security is making a new low and the A/D indicator is failing to make a new low. Buy. You can change long to short in the Input Settings WARNING: - For purpose educate only - This script to change bars colors.אסטרטגיית Pine Script®מאת HPotter66188
Smoothened Williams A/D Strategy Accumulation is a term used to describe a market controlled by buyers; whereas distribution is defined by a market controlled by sellers. Williams recommends trading this indicator based on divergences: Distribution of the security is indicated when the security is making a new high and the A/D indicator is failing to make a new high. Sell. Accumulation of the security is indicated when the security is making a new low and the A/D indicator is failing to make a new low. Buy. WARNING: - This script to change bars colors.אינדיקטור Pine Script®מאת HPotter119
Williams Accumulation/Distribution (Williams AD) Backtest Accumulation is a term used to describe a market controlled by buyers; whereas distribution is defined by a market controlled by sellers. Williams recommends trading this indicator based on divergences: Distribution of the security is indicated when the security is making a new high and the A/D indicator is failing to make a new high. Sell. Accumulation of the security is indicated when the security is making a new low and the A/D indicator is failing to make a new low. Buy. You can change long to short in the Input Settings WARNING: - For purpose educate only - This script to change bars colors.אסטרטגיית Pine Script®מאת HPotter108
Williams Accumulation/Distribution (Williams AD) Strategy Accumulation is a term used to describe a market controlled by buyers; whereas distribution is defined by a market controlled by sellers. Williams recommends trading this indicator based on divergences: Distribution of the security is indicated when the security is making a new high and the A/D indicator is failing to make a new high. Sell. Accumulation of the security is indicated when the security is making a new low and the A/D indicator is failing to make a new low. Buy. WARNING: - This script to change bars colors.אינדיקטור Pine Script®מאת HPotter22286
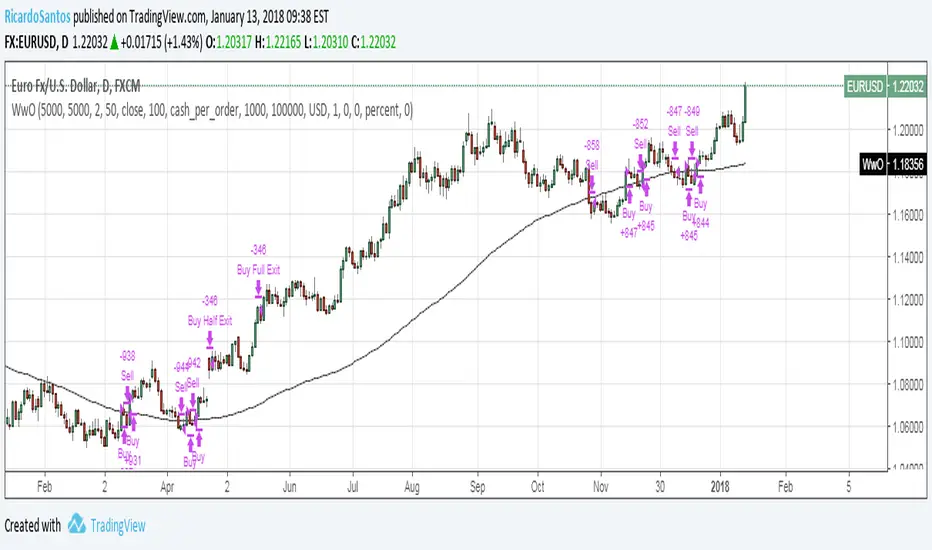
[Tutorial][RS]Working with ordersa small tutorial to explain how to work with orders, comments in the script.אסטרטגיית Pine Script®מאת RicardoSantos33330
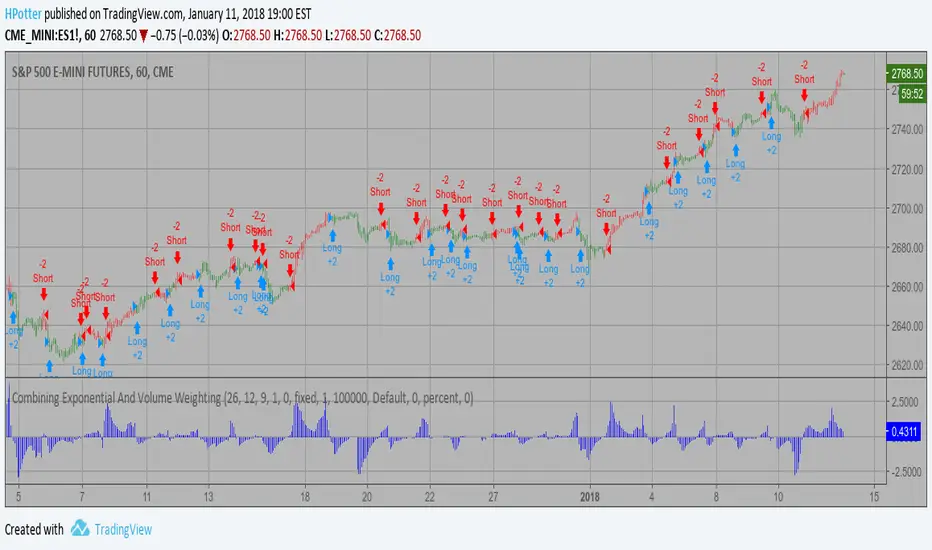
Combining Exponential And Volume Weighting Backtest The related article is copyrighted material from Stocks & Commodities 2009 Oct You can change long to short in the Input Settings WARNING: - For purpose educate only - This script to change bars colors.אסטרטגיית Pine Script®מאת HPotter39
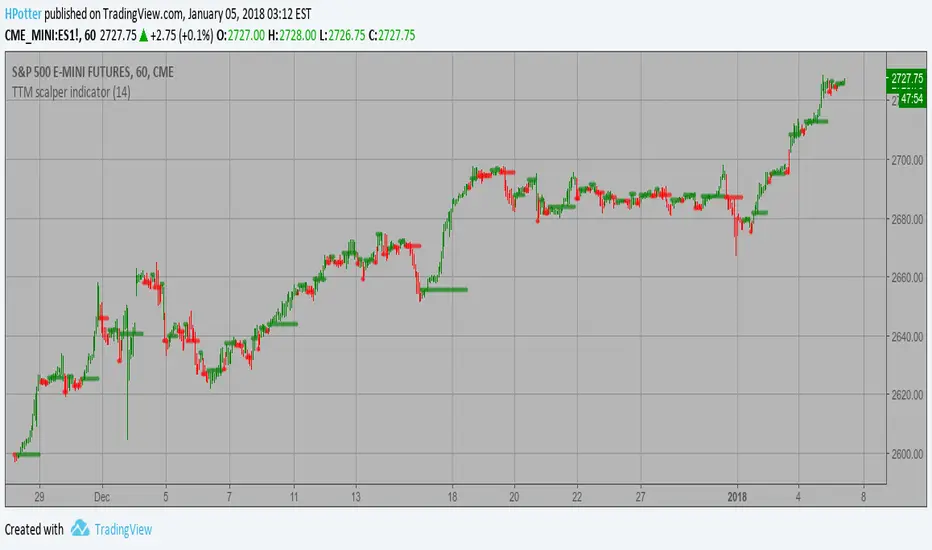
TTM scalper indicator Backtest TTM scalper indicator of John Carter’s Scalper Buys and Sells. The methodology is a close approximation of the one described in his book Mastering the Trade. The book is highly recommended. Note the squares are not real-time but will show up once the third bar has confirmed a reversal. You can change long to short in the Input Settings WARNING: - For purpose educate only - This script to change bars colors.אסטרטגיית Pine Script®מאת HPotter11655
TTM scalper indicator Strategy TTM scalper indicator of John Carter’s Scalper Buys and Sells. The methodology is a close approximation of the one described in his book Mastering the Trade. The book is highly recommended. Note the squares are not real-time but will show up once the third bar has confirmed a reversal. WARNING: - This script to change bars colors.אינדיקטור Pine Script®מאת HPotter66 1.4 K
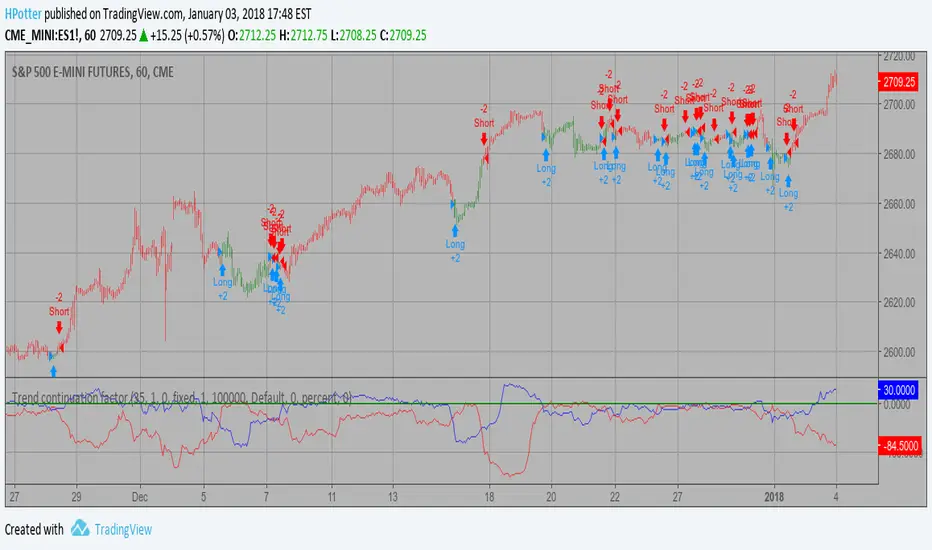
Trend continuation factor Backtest Trend continuation factor, by M.H. Pee The related article is copyrighted material from Stocks & Commodities. You can change long to short in the Input Settings WARNING: - For purpose educate only - This script to change bars colors.אסטרטגיית Pine Script®מאת HPotter96
Trend continuation factor Strategy Trend continuation factor, by M.H. Pee The related article is copyrighted material from Stocks & Commodities. WARNING: - This script to change bars colors. אינדיקטור Pine Script®מאת HPotter147
CMARSI Strategy (on ETHUSD) Seems working goodthere it is, it's using the Connor RSI with little variations. C onnor M oving A verage RSIאסטרטגיית Pine Script®מאת Bazinos33174
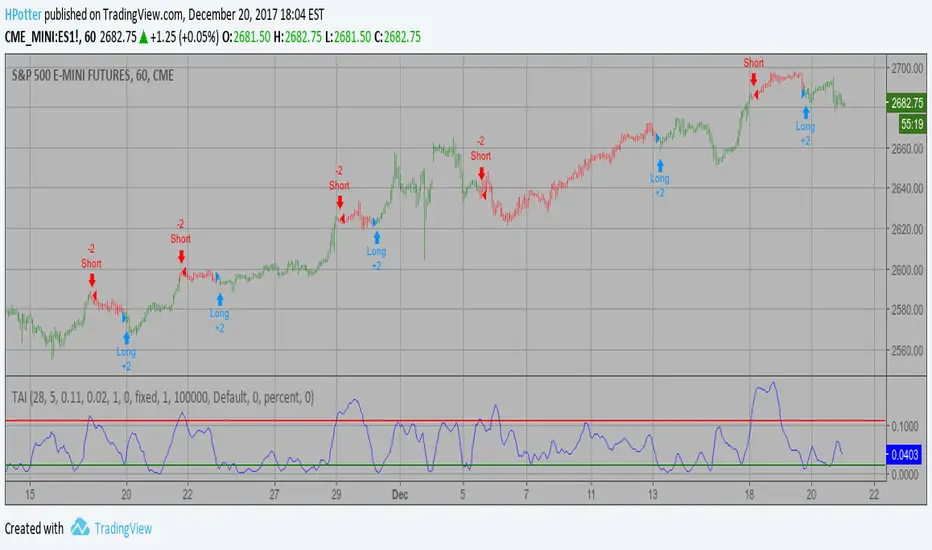
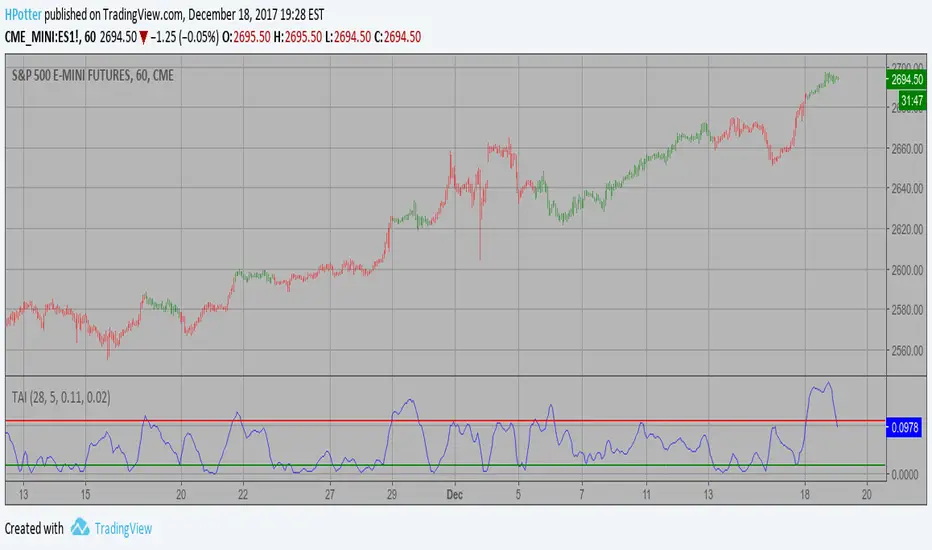
Trend Analysis Index Backtest In essence, it is simply the standard deviation of the last x bars of a y-bar moving average. Thus, the TAI is a simple trend indicator when prices trend with authority, the slope of the moving average increases, and when prices meander in a trendless range, the slope of the moving average decreases. You can change long to short in the Input Settings WARNING: - For purpose educate only - This script to change bars colors.אסטרטגיית Pine Script®מאת HPotter91
Trend Analysis Index Strategy In essence, it is simply the standard deviation of the last x bars of a y-bar moving average. Thus, the TAI is a simple trend indicator when prices trend with authority, the slope of the moving average increases, and when prices meander in a trendless range, the slope of the moving average decreases. WARNING: - This script to change bars colors.אינדיקטור Pine Script®מאת HPotter37
TFS: Volume Oscillator Backtest This is the second part of TFS trading strategy. The concept of this indicator is similar to that of On-Balance Volume indicator (OBV). It is calculated according to these rules: If Close > Open, Volume is positive If Close < Open, Volume is negative If Close = Open, Volume is neutral Then you take the 7-day MA of the results. You can change long to short in the Input Settings WARNING: - For purpose educate only - This script to change bars colors.אסטרטגיית Pine Script®מאת HPotter91
TFS: Volume Oscillator Strategy This is the second part of TFS trading strategy. The concept of this indicator is similar to that of On-Balance Volume indicator (OBV). It is calculated according to these rules: If Close > Open, Volume is positive If Close < Open, Volume is negative If Close = Open, Volume is neutral Then you take the 7-day MA of the results. WARNING: - This script to change bars colors.אינדיקטור Pine Script®מאת HPotter53
Senkou Span Cross Strategy [Krypt]A simple trading strategy oriented towards cryptocurrencies that uses log-space Ichimoku clouds Long position: when Senkou Span A crosses over Senkou Span B Short position: when Senkou Span A crosses under Senkou Span B The indicator used in this strategy is available as a standalone script: אסטרטגיית Pine Script®מאת fskryptמעודכן 11727
TFS: Tether Line Backtest Tether line indicator is the first component of TFS trading strategy. It was named this way because stock prices have a tendency to cluster around it. It means that stock prices tend to move away from the midpoint between their 50-day highs and lows, then return to that midpoint at some time in the future. On a chart, it appears as though the stock price is tethered to this line, and hence the name. You can change long to short in the Input Settings WARNING: - For purpose educate only - This script to change bars colors.אסטרטגיית Pine Script®מאת HPotter75
TFS: Tether Line Strategy Tether line indicator is the first component of TFS trading strategy. It was named this way because stock prices have a tendency to cluster around it. It means that stock prices tend to move away from the midpoint between their 50-day highs and lows, then return to that midpoint at some time in the future. On a chart, it appears as though the stock price is tethered to this line, and hence the name. WARNING: - This script to change bars colors.אינדיקטור Pine Script®מאת HPotter93
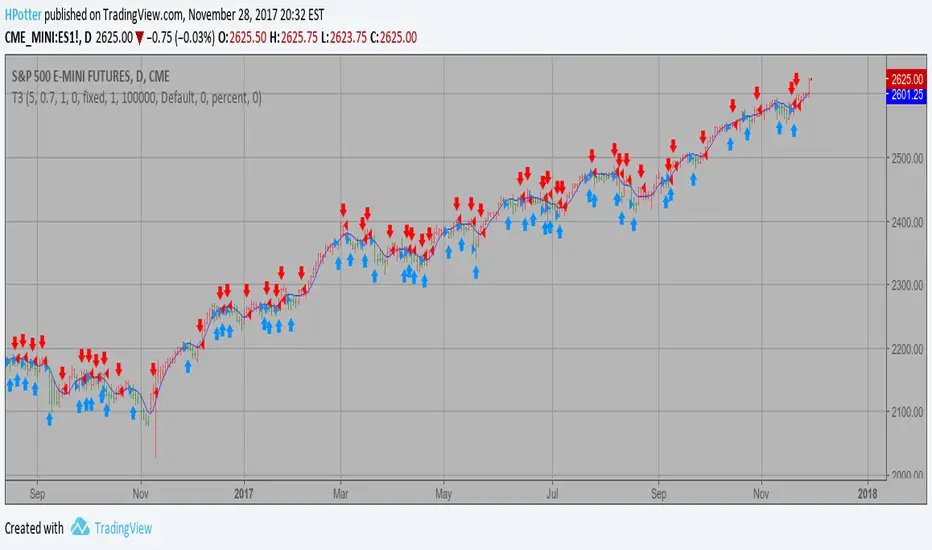
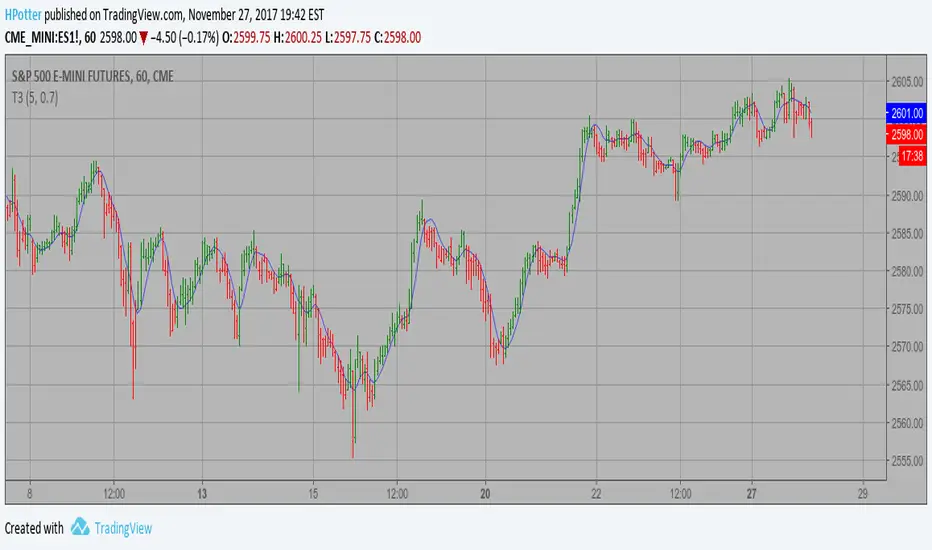
T3 Averages Backtest This indicator plots the moving average described in the January, 1998 issue of S&C, p.57, "Smoothing Techniques for More Accurate Signals", by Tim Tillson. This indicator plots T3 moving average presented in Figure 4 in the article. T3 indicator is a moving average which is calculated according to formula: T3(n) = GD(GD(GD(n))), where GD - generalized DEMA (Double EMA) and calculating according to this: GD(n,v) = EMA(n) * (1+v)-EMA(EMA(n)) * v, where "v" is volume factor, which determines how hot the moving average’s response to linear trends will be. The author advises to use v=0.7. When v = 0, GD = EMA, and when v = 1, GD = DEMA. In between, GD is a less aggressive version of DEMA. By using a value for v less than1, trader cure the multiple DEMA overshoot problem but at the cost of accepting some additional phase delay. In filter theory terminology, T3 is a six-pole nonlinear Kalman filter. Kalman filters are ones that use the error — in this case, (time series - EMA(n)) — to correct themselves. In the realm of technical analysis, these are called adaptive moving averages; they track the time series more aggres-sively when it is making large moves. Tim Tillson is a software project manager at Hewlett-Packard, with degrees in mathematics and computer science. He has privately traded options and equities for 15 years. You can change long to short in the Input Settings WARNING: - For purpose educate only - This script to change bars colors.אסטרטגיית Pine Script®מאת HPotter11124
T3 Averages Strategy This indicator plots the moving average described in the January, 1998 issue of S&C, p.57, "Smoothing Techniques for More Accurate Signals", by Tim Tillson. This indicator plots T3 moving average presented in Figure 4 in the article. T3 indicator is a moving average which is calculated according to formula: T3(n) = GD(GD(GD(n))), where GD - generalized DEMA (Double EMA) and calculating according to this: GD(n,v) = EMA(n) * (1+v)-EMA(EMA(n)) * v, where "v" is volume factor, which determines how hot the moving average’s response to linear trends will be. The author advises to use v=0.7. When v = 0, GD = EMA, and when v = 1, GD = DEMA. In between, GD is a less aggressive version of DEMA. By using a value for v less than1, trader cure the multiple DEMA overshoot problem but at the cost of accepting some additional phase delay. In filter theory terminology, T3 is a six-pole nonlinear Kalman filter. Kalman filters are ones that use the error — in this case, (time series - EMA(n)) — to correct themselves. In the realm of technical analysis, these are called adaptive moving averages; they track the time series more aggres-sively when it is making large moves. Tim Tillson is a software project manager at Hewlett-Packard, with degrees in mathematics and computer science. He has privately traded options and equities for 15 years. WARNING: - This script to change bars colors.אינדיקטור Pine Script®מאת HPotter113
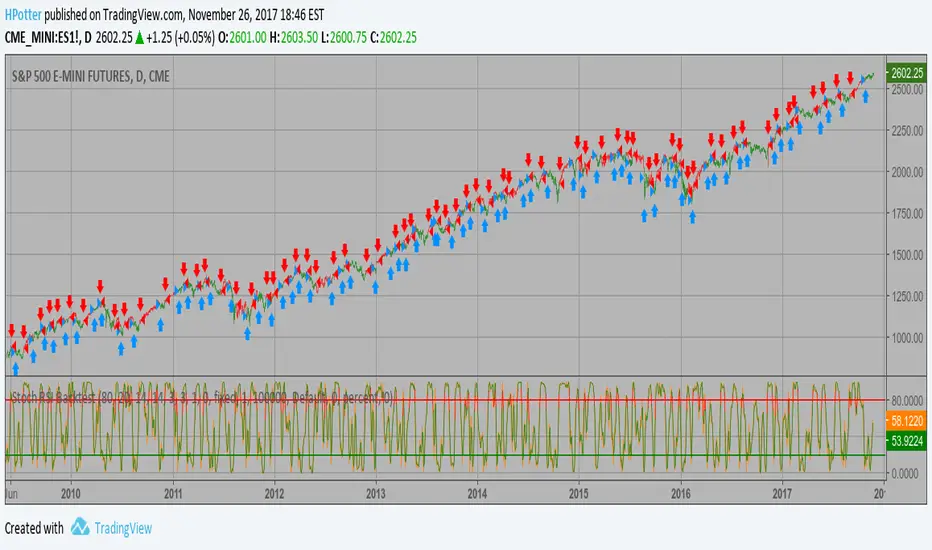
Stochastic RSI Backtest This strategy used to calculate the Stochastic RSI You can change long to short in the Input Settings WARNING: - For purpose educate only - This script to change bars colors.אסטרטגיית Pine Script®מאת HPotter33210