Trend Slope Meter - KaspricciTrend Slope Meter
This indicator measures the slope of the trend defined by a moving average or an external source. The slope is calculated by the change of price in ticks for a defined number of bars divided by the number of bars.
Settings
Source - Default: close price. Used to calculate the moving average as basis for slope measurement. Can be an external source of a different indicator as well. In case you select an external source, you can disable the moving average calculation.
Moving Average Settings
Type - Default: EMA. Type of moving average calculation. All provided out of the box by TradingView.
Length - Default: 50. Length used to calculate moving average.
Slope Settings
Length - Default: 50. Length used to calculate slope.
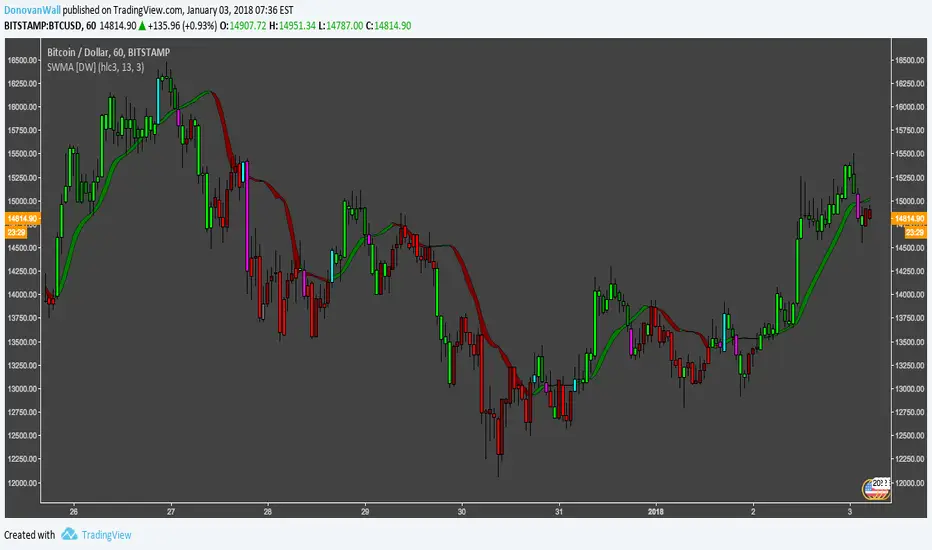
SWMA

Tunable SWMADissected the standard SWMA function and added options for user to change just about every part of it. Weights ,Lookback ,Source can all be changed in the settings.
Green is the standard SWMA, Using the Input value selected.(MAs/LRC/VWAP)
Red is the tuned SWMA, with the option of applying a final Output filter (MAs/LRC/VWAP). Uses 8 datapoints instead of 4 for the default.
Customization can really help expand upon the standard SWMA I find. Enjoy tuning to your hearts content

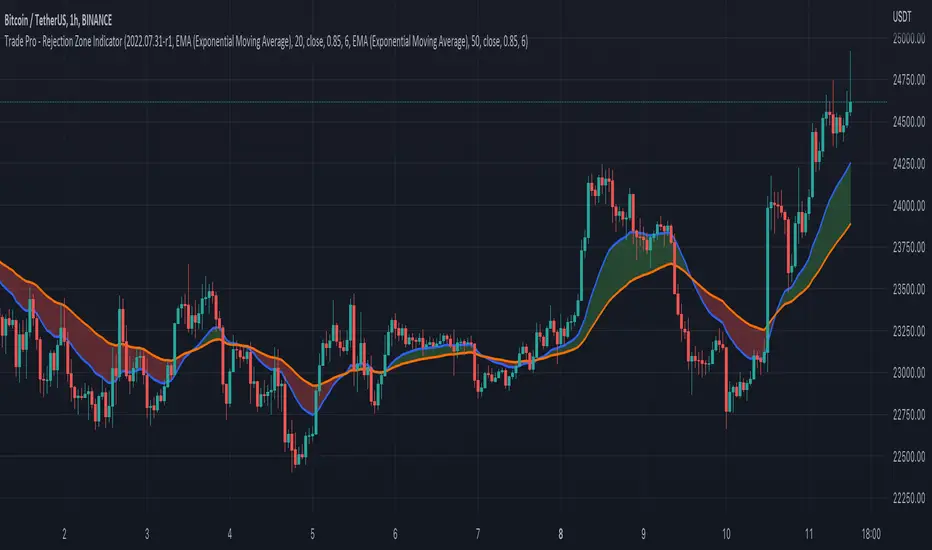
Trade Pro - Rejection Zone IndicatorThe Rejection Zone Indicator can be used to help trend following traders know when to buy dips in up trends, and when to sell pull backs in down trends.
The Rejection Zone Indicator is made up of the 20 and 50 period Exponential Moving Averages. This indicator has colored shading in between these two EMAs, which acts as a nice visual. When the 20 period Exponential Moving Average is below the 50 period Exponential Moving Average, the shaded cloud will be red, and when the 20 EMA is over the 50 EMA the cloud will be green. It is called the Rejection Zone indicator, because often in trends when price pulls back to the colored cloud, it will act as an area of support or resistance.
The suggested use of the Rejection Zone Indicator is to look for long trades when the cloud is green, and once price has pulled back into the green cloud. If the cloud is red one can look for short trading opportunity when price pulls back into the red cloud.
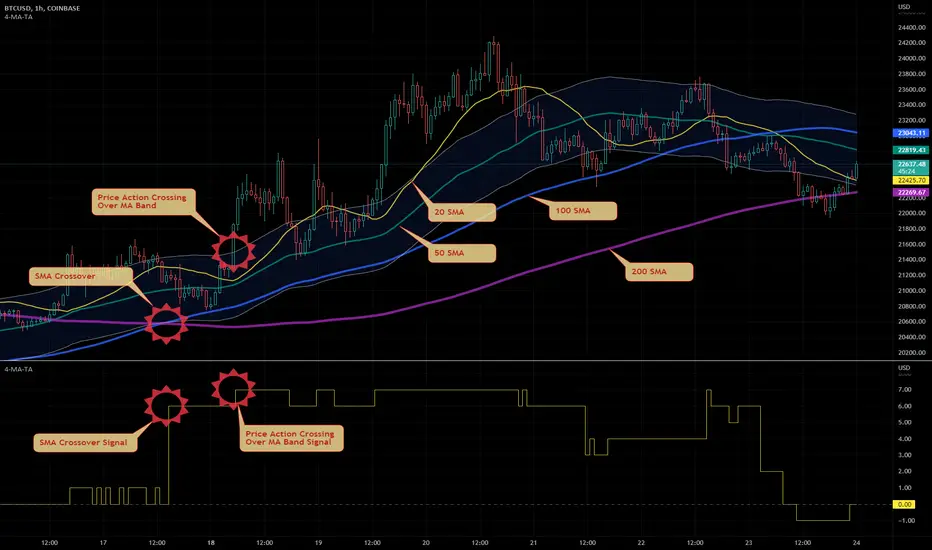
HTF 4 MA Trend Analysis by Prosum SolutionsIntroduction
This indicator will render up to four (4) moving averages on the chart in any higher timeframe and provide a "MA Bullish/Bearish Strength Signal" as a plot output that can be used to link with other indicators on the chart that use the `input.source()` function.
How is it original and useful?
The indicator allows you to use up to four (4) different moving average types of various types, each at different lengths. The moving average types that are supported are:
SMA - Simple Moving Average
EMA - Exponential Moving Average
RMA - RSI Moving Average
WMA - Weighted Moving Average
VWMA - Volume-Weighted Moving Average
SWMA - Symmetrically-Weighted Moving Average
This indicator makes use of the security() function and applies the best-practices as provided by the PineCoders' script called " `security()` revisited PineCoders " so that the indicator will not repaint when you refresh the chart or re-open it at a later date.
What does it do and how does it do it?
Using the four moving averages, each with increasing lengths, allows you to confirm bullish and bearish trends using a weighted rating system to compute a trend strength signal value. Specifically, the indicator provides a plot data series called "MA Bullish/Bullish Strength Signal" the is simply the summation of the bullish/bearish trend weight values between the four moving averages. The bullish/bearish trend weight values are determined by the position of the moving average lines relative to each other. For example, when Moving Average 1 is above Moving Average 2, this is considered a bullish trend and the weight value will be 1. The weight values can be changed to in the settings to define your own specific weights/values to rate the trend strength. The following list defines the meaning of the "MA Bullish/Bullish Strength Signal" value.
-6 = Strong bearish
-2 = Moderate bearish
2 = Moderate bullish
6 = Strong bullish
An additional option allows you to add a band around a specific moving average using a deviation percentage to further evaluate the candles being above or below the upper/lower bands. When the candle's close value is above or below the bands, you can add another weighted value to the signal result. As a result, an additional plot series called "MA Bull/Bear+Band Signal" is provided to include the moving average band weight.
Lastly, the chart example above demonstrates how you can use the indicator as an overlay to the price chart or as a separate panel above or below the price chart. The indicator can change what to plot based on an input setting called "Display Mode". When set to `Overlay`, the indicator will draw only the MA and MA Band plots. When set to `Pane`, the indicator will draw only the signal plots over a zero line to visualize the signal changes with the chart events.
Enjoy! 😊👍
Supply Weighted Moving AverageUse on a Weekly timeframe:
This moving average channel is weighted based on the new BTC offer:
I believe that the slope of the Bitcoin trend line correlates with the new supply and availability problem.
Thanks MJShahsavar
Original script "Weighted average moving average of the offer: Onchin"

Stop Loss With Average True Range (ATR)Stop Loss With Average True Range (ATR)
It simplifies the calculation of stop loss price for stop loss method using the average true range (ATR).
For example;
You want to stop loss below 3 ATR. Let's assume the price is 100, the average true range is 5. You will multiply the average true range by 3 and subtract from the price and enter a stop loss order at the 85 price you have reached. Instead of doing this calculation every time, you just need to use this script and set the multiplier to 3. A stop loss line will be drawn below the price candles.
You can set the method to be used when averaging the true range. Methods you can use to average: EMA (exponentially moving average), HMA (hull moving average), RMA (moving average used in RSI), SMA (simple moving average), SWMA (symmetrically weighted moving average), VWMA (volume-weighted moving average), WMA (weighted moving average).
You can set the length to be used when averaging the true range.
You can set the multiplier to be used when determining the stop loss price.
Turkish
Ortalama Gerçek Aralıkla (ATR) Zarar Durdurma
Gerçek aralığın ortalamasını kullanarak zarar durdurma yöntemi için zarar durdurma fiyatının hesaplanmasını kolaylaştırır.
Örneğin;
3 ATR kadar aşağıda zarar durdurmak istiyorsunuz. Fiyatın 100, ortalama gerçek aralığın 5 olduğunu varsayalım. Ortalama gerçek aralığı 3 ile çarparak fiyattan çıkaracaksınız ve ulaştığınız 85 fiyatına zarar durdurma emri gireceksiniz. Bu hesabı her seferinde yapmak yerine bu betiği kullanmanız ve çarpanı 3 olarak ayarlamanız yeterli. Bu sayede fiyat mumlarının altına zarar durdurma çizgisi çizilecektir.
Gerçek aralığın ortalaması alınırken kullanılacak yöntemi ayarlayabilirsiniz. Ortalama almak için seçebileceğiniz yöntemler: EMA (üstel hareketli ortalama), HMA (gövde hareketli ortalama), RMA (göreceli hareketli ortalama), SMA (basit hareketli ortalama), SWMA (simetrik ağırlıklı hareketli ortalama), VWMA (hacim ağırıklı hareketli ortalama), WMA (ağırlıklı hareketli ortalama).
Gerçek aralığın ortalaması alınırken kullanılacak periyot uzunluğunu ayarlayabilirsiniz.
Zarar durdurma fiyatını belirlerken kullanılacak çarpanı ayarlayabilirsiniz.

AMACD - All Moving Average Convergence DivergenceThis indicator displays the Moving Average Convergane and Divergence ( MACD ) of individually configured Fast, Slow and Signal Moving Averages. Buy and sell alerts can be set based on moving average crossovers, consecutive convergence/divergence of the moving averages, and directional changes in the histogram moving averages.
The Fast, Slow and Signal Moving Averages can be set to:
Exponential Moving Average ( EMA )
Volume-Weighted Moving Average ( VWMA )
Simple Moving Average ( SMA )
Weighted Moving Average ( WMA )
Hull Moving Average ( HMA )
Exponentially Weighted Moving Average (RMA) ( SMMA )
Symmetrically Weighted Moving Average ( SWMA )
Arnaud Legoux Moving Average ( ALMA )
Double EMA ( DEMA )
Double SMA (DSMA)
Double WMA (DWMA)
Double RMA ( DRMA )
Triple EMA ( TEMA )
Triple SMA (TSMA)
Triple WMA (TWMA)
Triple RMA (TRMA)
Linear regression curve Moving Average ( LSMA )
Variable Index Dynamic Average ( VIDYA )
Fractal Adaptive Moving Average ( FRAMA )
If you have a strategy that can buy based on External Indicators use 'Backtest Signal' which returns a 1 for a Buy and a 2 for a sell.
'Backtest Signal' is plotted to display.none, so change the Style Settings for the chart if you need to see it for testing.

Triple SWMA + EMA Crossover Color Candle+ ADX Color Candle V2! IMPORTANT !
To better see the color of the bars I suggest you deactivate the Borders option in the chart settings / Symbol, LIKE THIS:
════════════════════════════════════════════════════════════════════════════════════════════════════════════════════
The indicator is the same as the previous version, with the only difference that now the indicator is composed of an addition of secondary candles colored according to the EMA cross, while the main candles based on the ADX, the SWMA are inserted into secondary candles
════════════════════════════════════════════════════════════════════════════════════════════════════════════════════
1) SWMA
There are 3 SWMA , with the possibility of modifying the Source and the length of each one, also each SWMA can be removed or can all of them be removed with the ON / OFF option in Inputs-STYLE. (ALL SWMA?)
════════════════════════════════════════════════════════════════════════════════════════════════════════════════════
2) EMA Fast and Slow, Cross
There are two EMAs, fast and slow, both with the possibility of changing the source and length, in the chart settings it is possible to change the color of EMA Long and EMA Short:
EMA Long = Ema Fast > Ema Slow
EMA Short = Ema Slow > Ema Fast
Ema cross has a style choice option, the possible choices are:
NONE = nothing
ALL = all choices
LINE = ema200 colored based on Ema Long-Short
BAR COLOR = color candles based on Ema Long-Short
PLOTSHAPE = signals based on Ema Long-Short
LINE + BAR COLOR = line + bar color
BAR COLOR + PLOTSHAPE = bar color + plotshape
════════════════════════════════════════════════════════════════════════════════════════════════════════════════════
3) ADX Candle
The candles are colored according to 4 inputs:
Color 1 ( Silver ) = ADX < 20
Color 2 (Black) = ADX cross-ADX Index (adx+adx 14 period back) / 2
Color 3 (Lime) = ADX > 0 and DI delta (DI plus - DI minus) > 0
Color 4 (Red) = ADX > 0 and DI delta (DI plus - DI minus) < 0
all colors are editable and if you don't want to have ADX Candle on the chart, just remove the ON / OFF option in Inputs-STYLE. (BAR COLOR ADX )

Triple SWMA + EMA Crossover Color Candle+ ADX Color CandleIMPORTANT
The indicator allows you to view the Color Bars only if it is in the foreground, to do this just put the indicator before the description of the symbol, LIKE THIS:
════════════════════════════════════════════════════════════════════════════════════════════════════════════════════════════════
This indicator is composed of:
1) Tiple SWMA
There are 3 SWMA, with the possibility of modifying the Source and the length of each one, also each SWMA can be removed or can all of them be removed with the ON / OFF option in Inputs-STYLE. (ALL SWMA?)
════════════════════════════════════════════════════════════════════════════════════════════════════════════════════════════════
2) EMA Fast and Slow, Cross
There are two EMAs, fast and slow, both with the possibility of changing the source and length, in the chart settings it is possible to change the color of EMA Long and EMA Short
EMA Long = Ema Fast > Ema Slow
EMA Short = Ema Slow > Ema Fast
Ema cross has a style choice option, the possible choices are:
ALL = all choices
LINE = ema200 colored based on Ema Long-Short
BAR COLOR = color candles based on Ema Long-Short
PLOTSHAPE = signals based on Ema Long-Short
LINE + BAR COLOR = line + bar color
BAR COLOR + PLOTSHAPE = bar color + plotshape
if you don't want to have EMA Fast and Slow, Cross on the chart, just remove the ON / OFF option in Inputs-STYLE. (EMA style)
════════════════════════════════════════════════════════════════════════════════════════════════════════════════════════════════
3) ADX Candle
The candles are colored according to 4 inputs:
Color 1 (Silver) = ADX < 20
Color 2 (Black) = ADX cross-ADX Index (adx+adx 14 period back) / 2
Color 3 (Lime) = ADX > 0 and DI delta (DI plus - DI minus) > 0
Colo 4 (Red) = ADX > 0 and DI delta (DI plus - DI minus) < 0
all colors are editable and if you don't want to have ADX Candle on the chart, just remove the ON / OFF option in Inputs-STYLE. (BAR COLOR ADX)

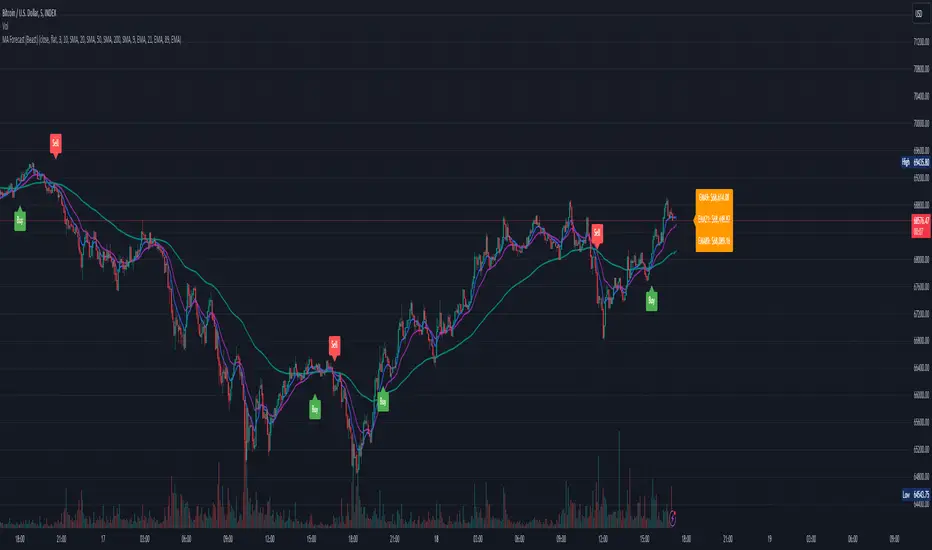
Moving Average Forecast (Beast)This script displays up to 8 lengths of moving averages using either the SMA , EMA, WMA, HMA, SWMA, VWMA or CCI and forecasts where the moving average will be in future periods (by removing the oldest periods and adding future prices based on either current price "flat" or a user-defined period linear regression "linreg".
Built on top of Triple MA Forecast by yatrader2, expanded it and added awesome features.
The following has been changed/added:
- Changed to pine script version 4
- Altered number of moving averages displayed up to 8
- Added multiple moving average types ( SMA , EMA , WMA, HMA, SWMA, VWMA, CCI )
* SMA - Simple moving average *
* EMA - Exponential moving average *
* WMA - Weighted moving average *
* HMA - Hull moving average *
* SWMA - Symmetrical weighted moving average *
* VWMA - Volume-weighted moving average *
* CCI - Commodity channel index *
- Fixed settings menu
- Added label with current moving average values (sorted by price)
- Cleaned up the logic
- Cleaned up the code
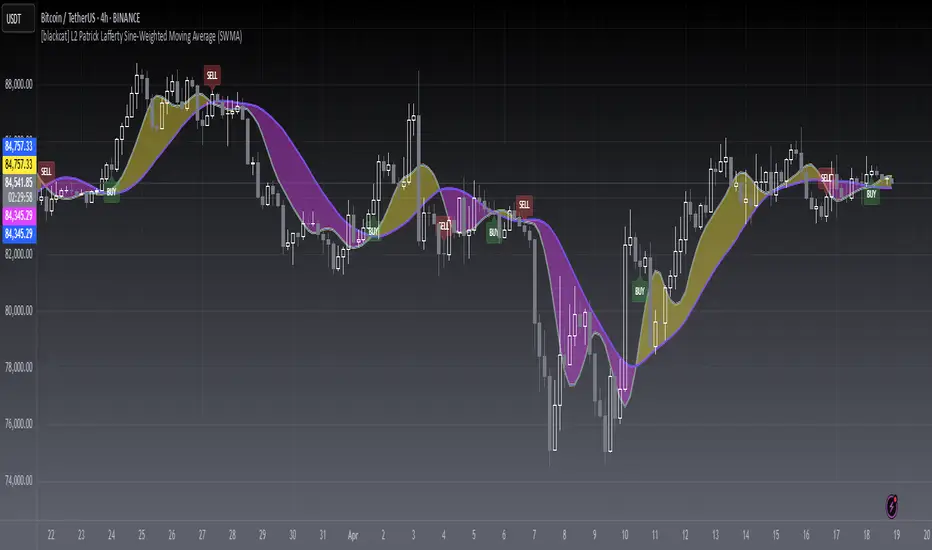
[blackcat] L2 Sine-Weighted Moving Average (SWMA)Level: 2
Background
Invented by Patrick Lafferty in 1999, a Sine Weighted Moving Average (SWMA) takes its weighting from the first half of a Sine wave cycle and accordingly, the most weighting is given to the data in the middle of the data set. It is therefore very similar to the Triangular Moving Average.
Function
A sine weighted moving average (Sine-MA) applies weights to each bar in the shape of the bulge in a sine curve from 0 to pi. For an N-bar average the weightings are
/ 1 \ / 2 \ / N \
sin | --- * pi |, sin | --- * pi |, ..., sin | --- * pi |
\ N+1 / \ N+1 / \ N+1 /
The effect is that middle prices have the greatest weight (much like the TMA, Triangular Moving Average). A Sine Weighted Moving Average ( Sine WMA ) takes its weighting from the first half of a Sine wave cycle and accordingly, the most weighting is given to the data in the middle of the data set.
Key Signal
SWMA(FastLength) --> SWMA Fast Line.
SWMA(SlowLength) --> SWMA Slow Line.
Remarks
This is a Level 2 free and open source indicator.
Feedbacks are appreciated.
Quad MAFor a dive into the fine details, see the source code/documentation.
Quad MA is a program designed to allow a wide range of flexibility in overlaying multiple moving averages onto a chart.
This program handles the ability to:
- Overlay Up to 4 moving averages on the chart.
- Change the length of each moving average.
- Adjust optional values for special moving averages
(least squares and Arnaud Legoux)
- Change the color for each moving average.
- Change the type of each moving average individually.
- Change the visibility of each moving average.
- Change the source of the moving averages.
- Set alerts for a cross between any two moving averages.

Bollinger Bands Plus [xdecow]Bollinger bands with the option to use different types of moving averages.
-SMA
-EMA
-RMA
-WMA
-VWMA
-SWMA
-DEMA
-HMA
-SMMA
-T3
-TEMA

Colored Moving Averages with Zero Lag and ATR BandsEnglish description:
- You can choose from 6 different Moving Averages: SMA , EMA , WMA , VWMA , RMA, SWMA
- Turn ON/OFF the Zero Lag alghorithm
- Make it 2 colors for better visibility of a trend
- Turn ON/OFF the ATR Bands up to 5 multiplicator
- Set the offset on the time axis
Polski opis:
- Możesz wybierać z 6 różnych średnich kroczących: SMA , EMA , WMA , VWMA , RMA, SWMA
- Włączyć/Wyłączyć algorytm Zero Lag
- Włączyć opcję 2 kolorowej średniej żeby lepiej widzieć trendy
- Włączyć/Wyłączyć wstęgi ATR z maksymalnym mnożnikiem x5
- Ustawić przesunięcie względem osi czasu

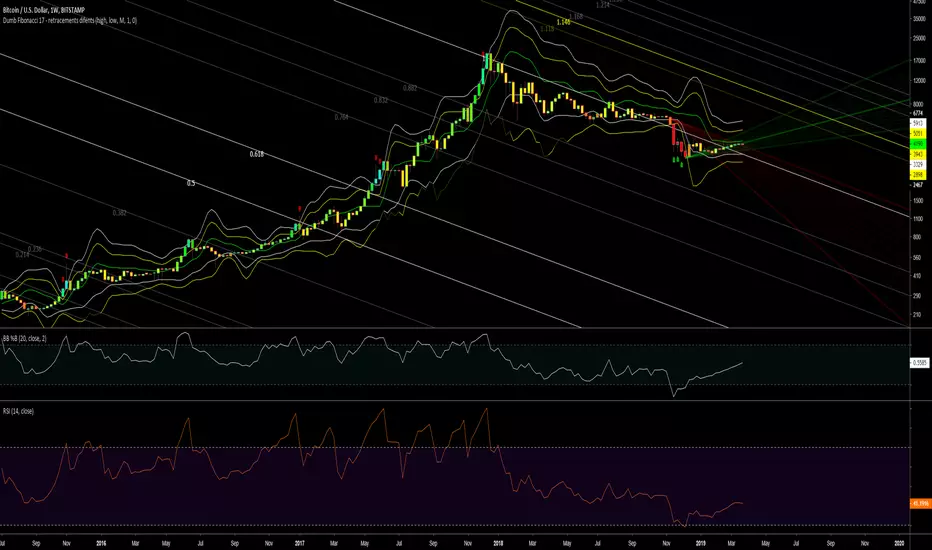
Dumb Indicator 17 - Retracement and market directionsThis indicator shows when the market is oversold or overbought changing the bar colors as the High+Low/2 going to extreme.
MA TypeAdd your MA Type.
# Inputs
- MA Type: "sma", "ema", "swma", "vwma", "wma"
- Length >=1
- Source
- Offset >= 0

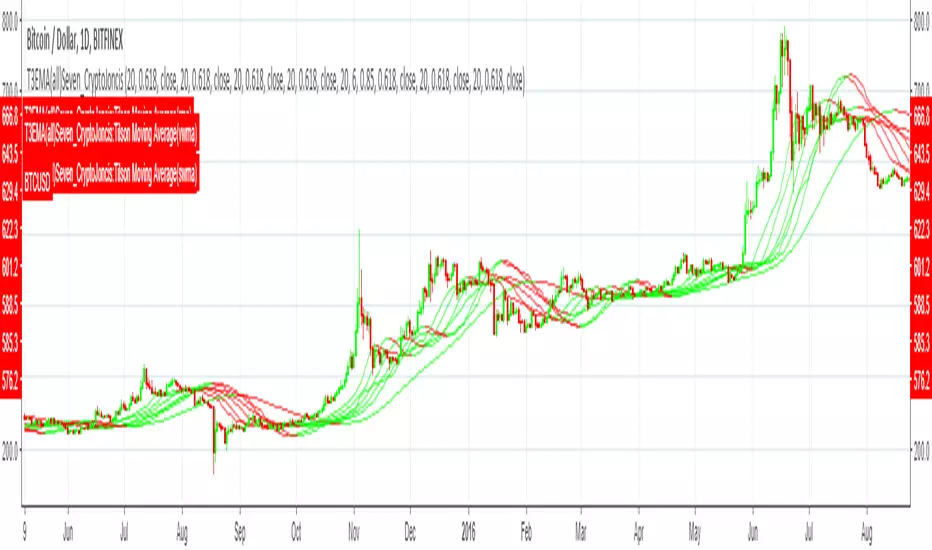
Tillson Moving Average(all_basic) SevenT3 Moving Average indicator was originally developed by Tim Tillson in 1998/99.
T3 Moving Average is considered as improved and better to traditional moving averages as it is smoother and performs better in trending market conditions.
It offers multiple opportunities when the price is in the state of retracement and therefore allows to minimize your exposed risk and allowing your profits run.
This version provides T3 MA
Source options - all standard + HA
T3 based on 6x ema, sma, rma, wma, alma, swma, vwma
Adds up to 7 different T3 on chart
Consider a tip in ETH to
0xac290B4A721f5ef75b0971F1102e01E1942A4578
Thank you and have a nice day
CryptoJoncis
Moving Average SelectorEvery type of Moving Average (MA) that is built into TradingView, rolled into one color-coded Moving Average Selector (MAS). Mix-n-match and compare all seven: 1) Simple Moving Average (SMA), 2) Exponential Moving Average (EMA), 3) Running Moving Average (RMA), 4) Symmetrically Weighted Moving Average (SWMΑ), 5) Volume-Weighted Moving Average (VWMA), 6) Weighted Moving Average (WMA), and/or 7) Arnaud Legoux Moving Average (ALMA).
View any or all 7 averages together for comparison, or average one or more together into your own custom Averaged Moving Average! Better still, each Moving Average comes complete with independent Crossover and/or Crossunder Alerts, and an option in Settings to Require Candle Confirmation prior to alert-firing.
All seven moving averages averaged together into a new moving average (build your own):
Easily control the line-width of all your averages at once, and enjoy clearly labeled style tab in MAS Settings:
If you'd like to see more Moving Averages added to MAS, write your requests in the comments below.
PLEASE NOTE:
When using Alerts on TradingView, the alerts you create will retain the settings that were set at the time you created the alert, and will not update as you change the indicator settings later, after you created the alert. This is true of all custom tradingView alerts. For example, if "Require Candle Confirmation for Crossover Alerts" is unchecked in MAS Settings, and then you create an alert for "ALMA Crossunder", and then later decide to go to MAS Settings and check "Require Candle Confirmation for Crossover Alerts", the alerts you created beforehand will not respect your settings changes, but will continue to operate without requiring candle confirmations. Currently, TradingView policy is that the alert should be created anew, and the original alert should either be "Stopped" or "Deleted".
Moving Averages (gotta plot them all!)The length of the lookback period and the type of moving average can be changed in the inputs tab of the indicator.
The type of moving average can be selected from:
Simple Moving Averages
Exponential Moving Averages
Symmetrically Weighted Moving Average
Weighted Moving Averages
Volume-weighted Moving Averages
Moving average used in RSI
Arnaud Legoux Moving Averages
The source of prices to use in the calculation can be selected from:
close
open
high
low
(high + low + close + open)/4
(high + low)/2
(high + low + close)/3
Line-weight and colours can be edited in the style tab of the indicator.
The default is to plot the SMAs using a length of 20, 50, 100 and 200.
A simpler version of this script is available here:

Moving Averages (SMA and EMA)Plot the simple moving averages (SMA) and/or exponential moving averages (EMA).
The length of the lookback period and the type of moving average can be changed in the inputs tab of the indicator.
Line-weight and colours can be edited in the style tab of the indicator.
The default is to plot the SMAs using a length of 20, 50, 100 and 200.

Sine Weighted Moving AverageSine Weighted Moving Average indicator.
The result is very similar to the Triangular Moving Average.

Stochastic Weighted Moving Averages [DW]This is an experimental study derived from George Lane's Stochastic Oscillator.
The %KWMA is calculated by taking a moving average of source with a %K weighting factor over its specified period.
The %DWMA is calculated by taking a simple moving average of %KWMA over its specified period.
Custom bar color scheme included.