Techindicator

ADX FunctionsLibrary "ADX"
adx(dilen, adxLen)
Parameters:
dilen : Length of the Directional Index.
adxLen : Length (smoothing) of the Average Directional Index.
Returns:

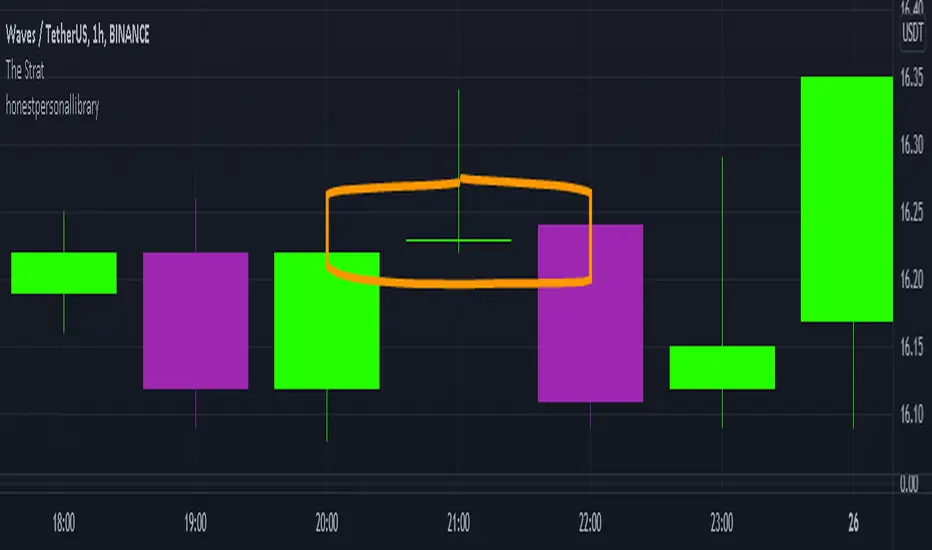
honest personal libraryLibrary "honestpersonallibrary"
thestratnumber() this will return the number 1,2 or 3 using the logic from Rob Smiths #thestrat which uses these type of bars for setups
getBodySize() Gets the current candle's body size (in POINTS, divide by 10 to get pips)
Returns: The current candle's body size in POINTS
getTopWickSize() Gets the current candle's top wick size (in POINTS, divide by 10 to get pips)
Returns: The current candle's top wick size in POINTS
getBottomWickSize() Gets the current candle's bottom wick size (in POINTS, divide by 10 to get pips)
Returns: The current candle's bottom wick size in POINTS
getBodyPercent() Gets the current candle's body size as a percentage of its entire size including its wicks
Returns: The current candle's body size percentage
strictBearPinBar(float, float) This it to find pinbars with a very long wick compared to the body that are bearish
Parameters:
float : minTopMulitplier (default=4) The minimum number of times that the top wick has to be bigger than the candle body size
float : maxBottomMultiplier (default=2) The maximum number of times that the bottom wick can be bigger than the candle body size
Returns: a bool function true if current candle is withing the parameters
strictBullPinBar(float, float) This it to find pinbars with a very long wick compared to the body that are bearish
Parameters:
float : minTopMulitplier (default=4) The minimum number of times that the top wick has to be bigger than the candle body size
float : maxBottomMultiplier (default=2) The maximum number of times that the bottom wick can be bigger than the candle body size
Returns: a bool function true if current candle is withing the parameters
Intraday High/LowLibrary "IntradayHighLow"
Provides functions calculating the intraday high/low of values.
IntradayHigh(val) Calculates the intraday high of a series.
Parameters:
val : Series to use ('high' is used if no argument is supplied).
Returns: The intraday high for the series.
IntradayLow(val) Calculates the intraday low of a series.
Parameters:
val : Series to use ('low' is used if no argument is supplied).
Returns: The intraday low for the series.

StapleIndicatorsLibrary "StapleIndicators"
This Library provides some common indicators commonly referenced from other studies in Pine Script
squeeze(bbSrc, bbPeriod, bbDev, kcSrc, kcPeriod, kcATR, signalPeriod) Volatility Squeeze
Parameters:
bbSrc : (Optional) Bollinger Bands Source. By default close
bbPeriod : (Optional) Bollinger Bands Period. By default 20
bbDev : (Optional) Bollinger Bands Standard Deviation. By default 2.0
kcSrc : (Optional) Keltner Channel Source. By default close
kcPeriod : (Optional) Keltner Channel Period. By default 20
kcATR : (Optional) Keltner Channel ATR Multiplier. By default 1.5
signalPeriod : (Optional) Keltner Channel ATR Multiplier. By default 1.5
Returns:
adx(diPeriod, adxPeriod, signalPeriod, adxTier1, adxTier2, adxTier3) ADX: Average Directional Index
Parameters:
diPeriod : (Optional) Directional Indicator Period. By default 14
adxPeriod : (Optional) ADX Smoothing. By default 14
signalPeriod : (Optional) Signal Period. By default 13
adxTier1 : (Optional) ADX Tier #1 Level. By default 20
adxTier2 : (Optional) ADX Tier #2 Level. By default 15
adxTier3 : (Optional) ADX Tier #3 Level. By default 10
Returns:
smaPreset(srcMa) Delivers a set of frequently used Simple Moving Averages
Parameters:
srcMa : (Optional) MA Source. By default 'close'
Returns:
emaPreset(srcMa) Delivers a set of frequently used Exponential Moving Averages
Parameters:
srcMa : (Optional) MA Source. By default 'close'
Returns:
maSelect(ma, srcMa) Filters and outputs the selected MA
Parameters:
ma : (Optional) MA text. By default 'Ema-21'
srcMa : (Optional) MA Source. By default 'close'
Returns: maSelected
periodAdapt(modeAdaptative, src, maxLen, minLen) Adaptative Period
Parameters:
modeAdaptative : (Optional) Adaptative Mode. By default 'Average'
src : (Optional) Source. By default 'close'
maxLen : (Optional) Max Period. By default '60'
minLen : (Optional) Min Period. By default '4'
Returns: periodAdaptative
azlema(modeAdaptative, srcMa) Azlema: Adaptative Zero-Lag Ema
Parameters:
modeAdaptative : (Optional) Adaptative Mode. By default 'Average'
srcMa : (Optional) MA Source. By default 'close'
Returns: azlema
ssma(lsmaVar, srcMa, periodMa) SSMA: Smooth Simple MA
Parameters:
lsmaVar : Linear Regression Curve.
srcMa : (Optional) MA Source. By default 'close'
periodMa : (Optional) MA Period. By default '13'
Returns: ssma
jvf(srcMa, periodMa) Jurik Volatility Factor
Parameters:
srcMa : (Optional) MA Source. By default 'close'
periodMa : (Optional) MA Period. By default '7'
Returns:
jBands(srcMa, periodMa) Jurik Bands
Parameters:
srcMa : (Optional) MA Source. By default 'close'
periodMa : (Optional) MA Period. By default '7'
Returns:
jma(srcMa, periodMa, phase) Jurik MA (JMA)
Parameters:
srcMa : (Optional) MA Source. By default 'close'
periodMa : (Optional) MA Period. By default '7'
phase : (Optional) Phase. By default '50'
Returns: jma
maCustom(ma, srcMa, periodMa, lrOffset, almaOffset, almaSigma, jmaPhase, azlemaMode) Creates a custom Moving Average
Parameters:
ma : (Optional) MA text. By default 'Ema'
srcMa : (Optional) MA Source. By default 'close'
periodMa : (Optional) MA Period. By default '13'
lrOffset : (Optional) Linear Regression Offset. By default '0'
almaOffset : (Optional) Alma Offset. By default '0.85'
almaSigma : (Optional) Alma Sigma. By default '6'
jmaPhase : (Optional) JMA Phase. By default '50'
azlemaMode : (Optional) Azlema Adaptative Mode. By default 'Average'
Returns: maTF

STPFunctionsLibrary "STPFunctions"
These functions are used as part of the STP trading strategy and include commonly used candle patterns, trade triggers and frequently monitored stock parameters
MAs() Determines if the last price is abover or below key moving averages. MAs used on the daily are SMA20, SMA50 and SMA200. SMA20 and SMA50 are used intraday.
Returns: 1 if the last price/close was over the moving averages. -1 is returned if the last price/close is below the moving averages. 0 is returned otherwise.
HTFOrderFlow(HTF1_open, HTF2_open) Determine the state of the higher time frame order flow.
Parameters:
HTF1_open : float value representing the higher time frame open.
HTF2_open : float value representing the higher time frame open.
Returns: 1 if the last price/close was over the higher time frame open. -1 is returned if the last price/close is below the higher time frame open. 0 is returned otherwise.
OrderFlow() Determine the recent order flow... basically are we well bid or well offered
Returns: 1 if the last 2 candles are well bid. -1 is returned if the last 2 candles are well offered. 0 is returned otherwise.
isInside() Used to flag inside candles
Returns: 1 if the close >= open. -1 is returned if the close <= open. 0 is returned otherwise.
isOutside() Used to flag outside or engulfing candles
Returns: 1 if the close >= open. -1 is returned if the close <= open. 0 is returned otherwise.
isUTN() Used to flag the U-turn reversal pattern
Returns: 1 for a BUTN. -1 is returned for a BRUTN. 0 is returned otherwise.
isSNapBack() Flag for Snapback Entries
Returns: 1 for a bullish snapback setup. -1 is returned for a bearish snapback setup. 0 is returned otherwise.

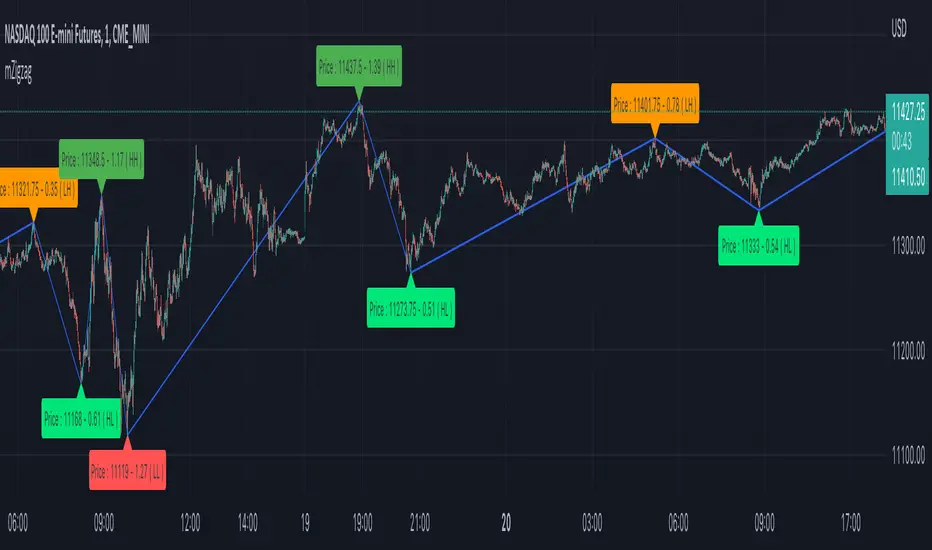
mZigzagLibrary "mZigzag"
Matrix implementation of zigzag to allow further possibilities.
Main advantage of this library over previous zigzag methods is that you can attach any number of indicator/oscillator information to zigzag
calculate(length, ohlc, indicatorHigh, indicatorLow, numberOfPivots) calculates zigzag and related information
Parameters:
length : is zigzag length
ohlc : array of OHLC values to be used for zigzag calculation
indicatorHigh : Array of indicator values calculated based on high price of OHLC
indicatorLow : Array of indicators values calculated based on low price of OHLC
numberOfPivots : Number of pivots to be returned
Returns: pivotMatrix Matrix containing zigzag pivots, pivot bars, direction, ratio, and indicators added via indicatorHigh/indicatorLow
newZG is true if a new pivot is added to array
doubleZG is true if last calculation returned two new pivots (Happens on extreme price change)
draw(length, ohlc, indicatorLabels, indicatorHigh, indicatorLow, numberOfPivots, lineColor, lineWidth, lineStyle, showHighLow, showRatios, showIndicators) draws zigzag and related information
Parameters:
length : is zigzag length
ohlc : array of OHLC values to be used for zigzag calculation
indicatorLabels : Array of name of indicators passed
indicatorHigh : Array of indicator values calculated based on high price of OHLC
indicatorLow : Array of indicators values calculated based on low price of OHLC
numberOfPivots : Number of pivots to be returned
lineColor : zigzag line color. set to blue by default
lineWidth : zigzag line width. set to 1 by default
lineStyle : zigzag line style. set to line.style_solid by default
showHighLow : show HH, HL, LH, LL labels
showRatios : show pivot retracement ratios from previous zigzag
showIndicators : show indicator values
Returns: pivotMatrix Matrix containing zigzag pivots, pivot bars, direction, ratio, and indicators added via indicatorHigh/indicatorLow
zigzaglines array of zigzag lines
zigzaglabels array of zigzag labels
Library CommonLibrary "LibraryCommon"
A collection of custom tools & utility functions commonly used with my scripts
@description TODO: add library description here
getDecimals() Calculates how many decimals are on the quote price of the current market
Returns: The current decimal places on the market quote price
truncate(float, float) Truncates (cuts) excess decimal places
Parameters:
float : number The number to truncate
float : decimalPlaces (default=2) The number of decimal places to truncate to
Returns: The given number truncated to the given decimalPlaces
toWhole(float) Converts pips into whole numbers
Parameters:
float : number The pip number to convert into a whole number
Returns: The converted number
toPips(float) Converts whole numbers back into pips
Parameters:
float : number The whole number to convert into pips
Returns: The converted number
getPctChange(float, float, int) Gets the percentage change between 2 float values over a given lookback period
Parameters:
float : value1 The first value to reference
float : value2 The second value to reference
int : lookback The lookback period to analyze
av_getPositionSize(float, float, float, float) Calculates OANDA forex position size for AutoView based on the given parameters
Parameters:
float : balance The account balance to use
float : risk The risk percentage amount (as a whole number - eg. 1 = 1% risk)
float : stopPoints The stop loss distance in POINTS (not pips)
float : conversionRate The conversion rate of our account balance currency
Returns: The calculated position size (in units - only compatible with OANDA)
bullFib(priceLow, priceHigh, fibRatio) Calculates a bullish fibonacci value
Parameters:
priceLow : The lowest price point
priceHigh : The highest price point
fibRatio : The fibonacci % ratio to calculate
Returns: The fibonacci value of the given ratio between the two price points
bearFib(priceLow, priceHigh, fibRatio) Calculates a bearish fibonacci value
Parameters:
priceLow : The lowest price point
priceHigh : The highest price point
fibRatio : The fibonacci % ratio to calculate
Returns: The fibonacci value of the given ratio between the two price points
getMA(int, string) Gets a Moving Average based on type (MUST BE CALLED ON EVERY CALCULATION)
Parameters:
int : length The MA period
string : maType The type of MA
Returns: A moving average with the given parameters
getEAP(float) Performs EAP stop loss size calculation (eg. ATR >= 20.0 and ATR < 30, returns 20)
Parameters:
float : atr The given ATR to base the EAP SL calculation on
Returns: The EAP SL converted ATR size
getEAP2(float) Performs secondary EAP stop loss size calculation (eg. ATR < 40, add 5 pips, ATR between 40-50, add 10 pips etc)
Parameters:
float : atr The given ATR to base the EAP SL calculation on
Returns: The EAP SL converted ATR size
barsAboveMA(int, float) Counts how many candles are above the MA
Parameters:
int : lookback The lookback period to look back over
float : ma The moving average to check
Returns: The bar count of how many recent bars are above the MA
barsBelowMA(int, float) Counts how many candles are below the MA
Parameters:
int : lookback The lookback period to look back over
float : ma The moving average to reference
Returns: The bar count of how many recent bars are below the EMA
barsCrossedMA(int, float) Counts how many times the EMA was crossed recently
Parameters:
int : lookback The lookback period to look back over
float : ma The moving average to reference
Returns: The bar count of how many times price recently crossed the EMA
getPullbackBarCount(int, int) Counts how many green & red bars have printed recently (ie. pullback count)
Parameters:
int : lookback The lookback period to look back over
int : direction The color of the bar to count (1 = Green, -1 = Red)
Returns: The bar count of how many candles have retraced over the given lookback & direction
getBodySize() Gets the current candle's body size (in POINTS, divide by 10 to get pips)
Returns: The current candle's body size in POINTS
getTopWickSize() Gets the current candle's top wick size (in POINTS, divide by 10 to get pips)
Returns: The current candle's top wick size in POINTS
getBottomWickSize() Gets the current candle's bottom wick size (in POINTS, divide by 10 to get pips)
Returns: The current candle's bottom wick size in POINTS
getBodyPercent() Gets the current candle's body size as a percentage of its entire size including its wicks
Returns: The current candle's body size percentage
isHammer(float, bool) Checks if the current bar is a hammer candle based on the given parameters
Parameters:
float : fib (default=0.382) The fib to base candle body on
bool : colorMatch (default=false) Does the candle need to be green? (true/false)
Returns: A boolean - true if the current bar matches the requirements of a hammer candle
isStar(float, bool) Checks if the current bar is a shooting star candle based on the given parameters
Parameters:
float : fib (default=0.382) The fib to base candle body on
bool : colorMatch (default=false) Does the candle need to be red? (true/false)
Returns: A boolean - true if the current bar matches the requirements of a shooting star candle
isDoji(float, bool) Checks if the current bar is a doji candle based on the given parameters
Parameters:
float : wickSize (default=2) The maximum top wick size compared to the bottom (and vice versa)
bool : bodySize (default=0.05) The maximum body size as a percentage compared to the entire candle size
Returns: A boolean - true if the current bar matches the requirements of a doji candle
isBullishEC(float, float, bool) Checks if the current bar is a bullish engulfing candle
Parameters:
float : allowance (default=0) How many POINTS to allow the open to be off by (useful for markets with micro gaps)
float : rejectionWickSize (default=disabled) The maximum rejection wick size compared to the body as a percentage
bool : engulfWick (default=false) Does the engulfing candle require the wick to be engulfed as well?
Returns: A boolean - true if the current bar matches the requirements of a bullish engulfing candle
isBearishEC(float, float, bool) Checks if the current bar is a bearish engulfing candle
Parameters:
float : allowance (default=0) How many POINTS to allow the open to be off by (useful for markets with micro gaps)
float : rejectionWickSize (default=disabled) The maximum rejection wick size compared to the body as a percentage
bool : engulfWick (default=false) Does the engulfing candle require the wick to be engulfed as well?
Returns: A boolean - true if the current bar matches the requirements of a bearish engulfing candle
isInsideBar() Detects inside bars
Returns: Returns true if the current bar is an inside bar
isOutsideBar() Detects outside bars
Returns: Returns true if the current bar is an outside bar
barInSession(string, bool) Determines if the current price bar falls inside the specified session
Parameters:
string : sess The session to check
bool : useFilter (default=true) Whether or not to actually use this filter
Returns: A boolean - true if the current bar falls within the given time session
barOutSession(string, bool) Determines if the current price bar falls outside the specified session
Parameters:
string : sess The session to check
bool : useFilter (default=true) Whether or not to actually use this filter
Returns: A boolean - true if the current bar falls outside the given time session
dateFilter(int, int) Determines if this bar's time falls within date filter range
Parameters:
int : startTime The UNIX date timestamp to begin searching from
int : endTime the UNIX date timestamp to stop searching from
Returns: A boolean - true if the current bar falls within the given dates
dayFilter(bool, bool, bool, bool, bool, bool, bool) Checks if the current bar's day is in the list of given days to analyze
Parameters:
bool : monday Should the script analyze this day? (true/false)
bool : tuesday Should the script analyze this day? (true/false)
bool : wednesday Should the script analyze this day? (true/false)
bool : thursday Should the script analyze this day? (true/false)
bool : friday Should the script analyze this day? (true/false)
bool : saturday Should the script analyze this day? (true/false)
bool : sunday Should the script analyze this day? (true/false)
Returns: A boolean - true if the current bar's day is one of the given days
atrFilter()
fillCell()

OscillatorPivotsLibrary "OscillatorPivots"
Measures pivots in an oscillator and flags if they are above a configurable size. Uses absolute size rather than just highest/lowest in a candle range.
f_osc_Pivots()
Uses the total change in the Y axis, instead of a simple Williams pivot over a defined number of bars. In other words, it measures the size of the actual pivot, not just whether it happens to be the highest/lowest value in a range.
Measures the absolute, cumulative change both before and after the pivot, to avoid flagging mere kinks in trends.
The advantage is that absolute pivot size is, in some cases, precisely what we care about. A disadvantage is that it can take an arbitrary, perhaps long, time to confirm.
You can configure the threshold size of the pivot so that it finds large or small pivots.
Always returns a pivot high after a pivot low, then another pivot high and so on, in order. It never returns a high followed by a high, which simple indicators based on the ta.pivot() function can do.
@param chart_H_1 This must always be set to 1, unless you are using my HighTimeframeTiming library, in which case set it to the output of the function for a _HTF_H of 1.
@param chart_H_2 This must always be set to 2, unless you are using my HighTimeframeTiming library, in which case set it to the output of the function for a _HTF_H of 2.
@param _osc This is the oscillator float value.
@param _oscPivotSize This is the user setting for what counts as a big enough change to be a pivot.
@returns Information about the pivot that is likely to be useful in further calculations:
confirmPeak, confirmDip - whether the pivot was confirmed this bar
peakBarsBack, dipBarsBack - how many bars ago the actual peak or dip was
peakPrice, dipPrice - the value of the oscillator at the peak/dip
It also returns some internal variables, which are plotted in this library only for an understanding of how the function works.
debug_peakStartLevel, debug_dipStartLevel - The level of the currently active peak/dip

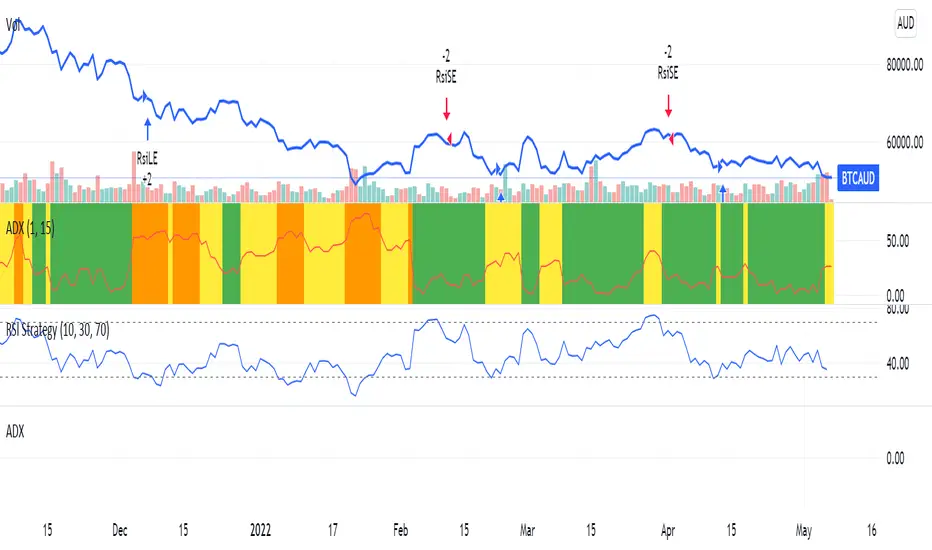
ReversalCandlestickPatternWithTrendIndentifierGMLibrary "ReversalCandlestickPatternWithTrendIndentifierGM"
Provides functions calculating the all-time high/low of values.
reversalCandlestickPatternWithTrendIndentifier(bullishcriteria, bearishcriteria, momentumOscillatorTypeInput) Calculates the Reversal Candlestick Pattern With Trend Indentifier.
Parameters:
bullishcriteria : Stoch RSI/RSI Bullish Criteria. defval=70, minval=60, maxval=100
bearishcriteria : Stoch RSI/RSI Bearish Criteria. defval=30, minval=0, maxval=40
momentumOscillatorTypeInput : Momentum Oscillator Type. options=
Returns: Reversal Candlestick Pattern With Trend Indentifier.

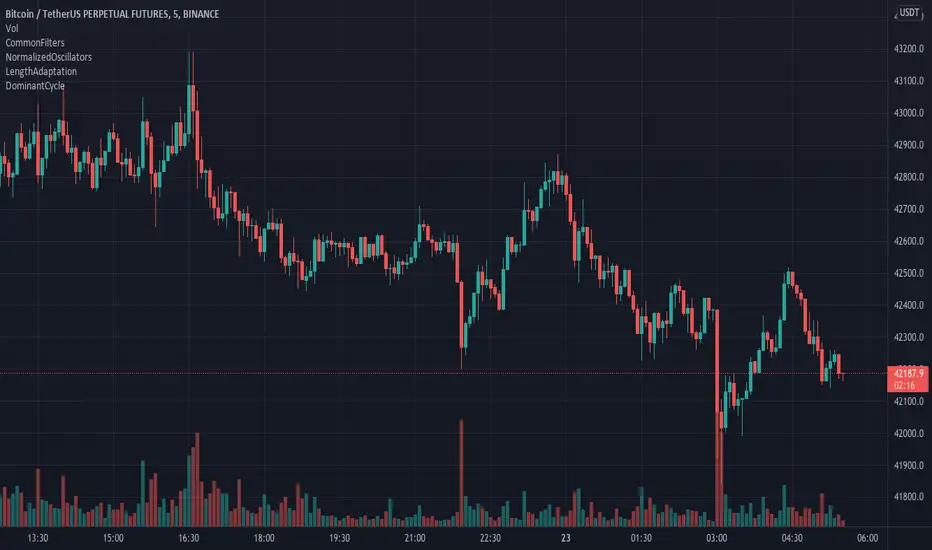
DominantCycleCollection of Dominant Cycle estimators. Length adaptation used in the Adaptive Moving Averages and the Adaptive Oscillators try to follow price movements and accelerate/decelerate accordingly (usually quite rapidly with a huge range). Cycle estimators, on the other hand, try to measure the cycle period of the current market, which does not reflect price movement or the rate of change (the rate of change may also differ depending on the cycle phase, but the cycle period itself usually changes slowly). This collection may become encyclopaedic, so if you have any working cycle estimator, drop me a line in the comments below. Suggestions are welcome. Currently included estimators are based on the work of John F. Ehlers
mamaPeriod(src, dynLow, dynHigh) MESA Adaptation - MAMA Cycle
Parameters:
src : Series to use
dynLow : Lower bound for the dynamic length
dynHigh : Upper bound for the dynamic length
Returns: Calculated period
Based on MESA Adaptive Moving Average by John F. Ehlers
Performs Hilbert Transform Homodyne Discriminator cycle measurement
Unlike MAMA Alpha function (in LengthAdaptation library), this does not compute phase rate of change
Introduced in the September 2001 issue of Stocks and Commodities
Inspired by the @everget implementation:
Inspired by the @anoojpatel implementation:
paPeriod(src, dynLow, dynHigh, preHP, preSS, preHP) Pearson Autocorrelation
Parameters:
src : Series to use
dynLow : Lower bound for the dynamic length
dynHigh : Upper bound for the dynamic length
preHP : Use High Pass prefilter (default)
preSS : Use Super Smoother prefilter (default)
preHP : Use Hann Windowing prefilter
Returns: Calculated period
Based on Pearson Autocorrelation Periodogram by John F. Ehlers
Introduced in the September 2016 issue of Stocks and Commodities
Inspired by the @blackcat1402 implementation:
Inspired by the @rumpypumpydumpy implementation:
Corrected many errors, and made small speed optimizations, so this could be the best implementation to date (still slow, though, so may revisit in future)
High Pass and Super Smoother prefilters are used in the original implementation
dftPeriod(src, dynLow, dynHigh, preHP, preSS, preHP) Discrete Fourier Transform
Parameters:
src : Series to use
dynLow : Lower bound for the dynamic length
dynHigh : Upper bound for the dynamic length
preHP : Use High Pass prefilter (default)
preSS : Use Super Smoother prefilter (default)
preHP : Use Hann Windowing prefilter
Returns: Calculated period
Based on Spectrum from Discrete Fourier Transform by John F. Ehlers
Inspired by the @blackcat1402 implementation:
High Pass, Super Smoother and Hann Windowing prefilters are used in the original implementation
phasePeriod(src, dynLow, dynHigh, preHP, preSS, preHP) Phase Accumulation
Parameters:
src : Series to use
dynLow : Lower bound for the dynamic length
dynHigh : Upper bound for the dynamic length
preHP : Use High Pass prefilter (default)
preSS : Use Super Smoother prefilter (default)
preHP : Use Hamm Windowing prefilter
Returns: Calculated period
Based on Dominant Cycle from Phase Accumulation by John F. Ehlers
High Pass and Super Smoother prefilters are used in the original implementation
doAdapt(type, src, len, dynLow, dynHigh, chandeSDLen, chandeSmooth, chandePower, preHP, preSS, preHP) Execute a particular Length Adaptation or Dominant Cycle Estimator from the list
Parameters:
type : Length Adaptation or Dominant Cycle Estimator type to use
src : Series to use
len : Reference lookback length
dynLow : Lower bound for the dynamic length
dynHigh : Upper bound for the dynamic length
chandeSDLen : Lookback length of Standard deviation for Chande's Dynamic Length
chandeSmooth : Smoothing length of Standard deviation for Chande's Dynamic Length
chandePower : Exponent of the length adaptation for Chande's Dynamic Length (lower is smaller variation)
preHP : Use High Pass prefilter for the Estimators that support it (default)
preSS : Use Super Smoother prefilter for the Estimators that support it (default)
preHP : Use Hann Windowing prefilter for the Estimators that support it
Returns: Calculated period (float, not limited)
doEstimate(type, src, dynLow, dynHigh, preHP, preSS, preHP) Execute a particular Dominant Cycle Estimator from the list
Parameters:
type : Dominant Cycle Estimator type to use
src : Series to use
dynLow : Lower bound for the dynamic length
dynHigh : Upper bound for the dynamic length
preHP : Use High Pass prefilter for the Estimators that support it (default)
preSS : Use Super Smoother prefilter for the Estimators that support it (default)
preHP : Use Hann Windowing prefilter for the Estimators that support it
Returns: Calculated period (float, not limited)
LengthAdaptationCollection of dynamic length adaptation algorithms. Mostly from various Adaptive Moving Averages (they are usually just EMA otherwise). Now you can combine Adaptations with any other Moving Averages or Oscillators (see my other libraries), to get something like Deviation Scaled RSI or Fractal Adaptive VWMA. This collection is not encyclopaedic. Suggestions are welcome.
chande(src, len, sdlen, smooth, power) Chande's Dynamic Length
Parameters:
src : Series to use
len : Reference lookback length
sdlen : Lookback length of Standard deviation
smooth : Smoothing length of Standard deviation
power : Exponent of the length adaptation (lower is smaller variation)
Returns: Calculated period
Taken from Chande's Dynamic Momentum Index (CDMI or DYMOI), which is dynamic RSI with this length
Original default power value is 1, but I use 0.5
A variant of this algorithm is also included, where volume is used instead of price
vidya(src, len, dynLow) Variable Index Dynamic Average Indicator (VIDYA)
Parameters:
src : Series to use
len : Reference lookback length
dynLow : Lower bound for the dynamic length
Returns: Calculated period
Standard VIDYA algorithm. The period oscillates from the Lower Bound up (slow)
I took the adaptation part, as it is just an EMA otherwise
vidyaRS(src, len, dynHigh) Relative Strength Dynamic Length - VIDYA RS
Parameters:
src : Series to use
len : Reference lookback length
dynHigh : Upper bound for the dynamic length
Returns: Calculated period
Based on Vitali Apirine's modification (Stocks and Commodities, January 2022) of VIDYA algorithm. The period oscillates from the Upper Bound down (fast)
I took the adaptation part, as it is just an EMA otherwise
kaufman(src, len, dynLow, dynHigh) Kaufman Efficiency Scaling
Parameters:
src : Series to use
len : Reference lookback length
dynLow : Lower bound for the dynamic length
dynHigh : Upper bound for the dynamic length
Returns: Calculated period
Based on Efficiency Ratio calculation orifinally used in Kaufman Adaptive Moving Average developed by Perry J. Kaufman
I took the adaptation part, as it is just an EMA otherwise
ds(src, len) Deviation Scaling
Parameters:
src : Series to use
len : Reference lookback length
Returns: Calculated period
Based on Derivation Scaled Super Smoother (DSSS) by John F. Ehlers
Originally used with Super Smoother
RMS originally has 50 bar lookback. Changed to 4x length for better flexibility. Could be wrong.
maa(src, len, threshold) Median Average Adaptation
Parameters:
src : Series to use
len : Reference lookback length
threshold : Adjustment threshold (lower is smaller length, default: 0.002, min: 0.0001)
Returns: Calculated period
Based on Median Average Adaptive Filter by John F. Ehlers
Discovered and implemented by @cheatcountry:
I took the adaptation part, as it is just an EMA otherwise
fra(len, fc, sc) Fractal Adaptation
Parameters:
len : Reference lookback length
fc : Fast constant (default: 1)
sc : Slow constant (default: 200)
Returns: Calculated period
Based on FRAMA by John F. Ehlers
Modified to allow lower and upper bounds by an unknown author
I took the adaptation part, as it is just an EMA otherwise
mama(src, dynLow, dynHigh) MESA Adaptation - MAMA Alpha
Parameters:
src : Series to use
dynLow : Lower bound for the dynamic length
dynHigh : Upper bound for the dynamic length
Returns: Calculated period
Based on MESA Adaptive Moving Average by John F. Ehlers
Introduced in the September 2001 issue of Stocks and Commodities
Inspired by the @everget implementation:
I took the adaptation part, as it is just an EMA otherwise
doAdapt(type, src, len, dynLow, dynHigh, chandeSDLen, chandeSmooth, chandePower) Execute a particular Length Adaptation from the list
Parameters:
type : Length Adaptation type to use
src : Series to use
len : Reference lookback length
dynLow : Lower bound for the dynamic length
dynHigh : Upper bound for the dynamic length
chandeSDLen : Lookback length of Standard deviation for Chande's Dynamic Length
chandeSmooth : Smoothing length of Standard deviation for Chande's Dynamic Length
chandePower : Exponent of the length adaptation for Chande's Dynamic Length (lower is smaller variation)
Returns: Calculated period (float, not limited)
doMA(type, src, len) MA wrapper on wrapper: if DSSS is selected, calculate it here
Parameters:
type : MA type to use
src : Series to use
len : Filtering length
Returns: Filtered series
Demonstration of a combined indicator: Deviation Scaled Super Smoother

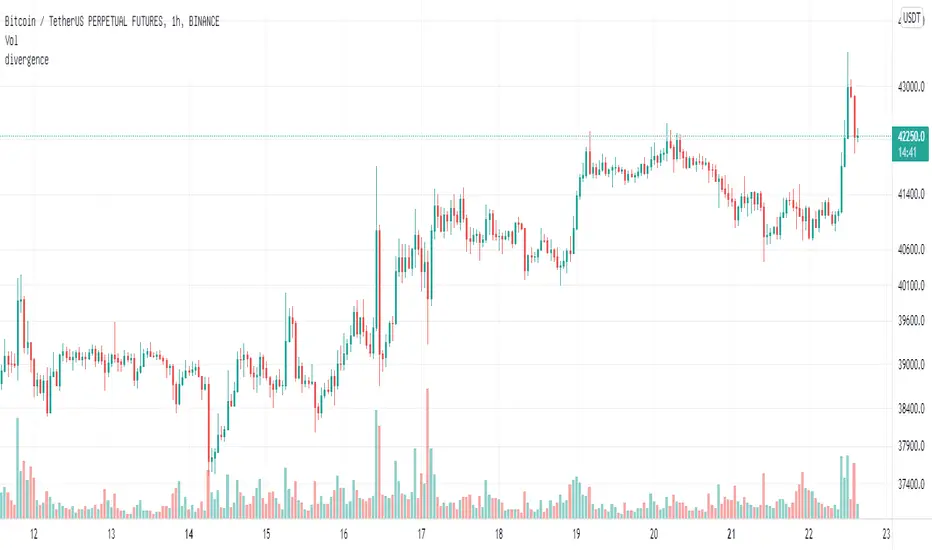
divergenceLibrary "divergence"
divergence: divergence algorithm with top and bottom kline tolerance
regular_bull(series, series, simple, simple, simple, simple, simple) regular_bull: regular bull divergence, lower low src but higher low osc
Parameters:
series : float src: the source series
series : float osc: the oscillator index
simple : int lbL: look back left
simple : int lbR: look back right
simple : int rangeL: min look back range
simple : int rangeU: max look back range
simple : int tolerance: the number of tolerant klines
Returns: array:
hidden_bull(series, series, simple, simple, simple, simple, simple) hidden_bull: hidden bull divergence, higher low src but lower low osc
Parameters:
series : float src: the source series
series : float osc: the oscillator index
simple : int lbL: look back left
simple : int lbR: look back right
simple : int rangeL: min look back range
simple : int rangeU: max look back range
simple : int tolerance: the number of tolerant klines
Returns: array:
regular_bear(series, series, simple, simple, simple, simple, simple) regular_bear: regular bear divergence, higher high src but lower high osc
Parameters:
series : float src: the source series
series : float osc: the oscillator index
simple : int lbL: look back left
simple : int lbR: look back right
simple : int rangeL: min look back range
simple : int rangeU: max look back range
simple : int tolerance: the number of tolerant klines
Returns: array:
hidden_bear(series, series, simple, simple, simple, simple, simple) hidden_bear: hidden bear divergence, lower high src but higher high osc
Parameters:
series : float src: the source series
series : float osc: the oscillator index
simple : int lbL: look back left
simple : int lbR: look back right
simple : int rangeL: min look back range
simple : int rangeU: max look back range
simple : int tolerance: the number of tolerant klines
Returns: array:
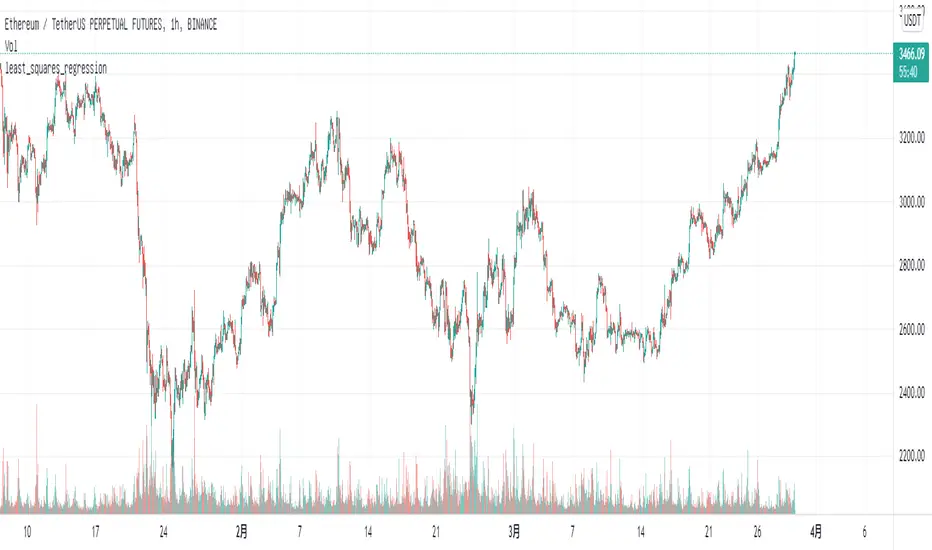
least_squares_regressionLibrary "least_squares_regression"
least_squares_regression: Least squares regression algorithm to find the optimal price interval for a given time period
basic_lsr(series, series, series) basic_lsr: Basic least squares regression algorithm
Parameters:
series : int t: time scale value array corresponding to price
series : float p: price scale value array corresponding to time
series : int array_size: the length of regression array
Returns: reg_slop, reg_intercept, reg_level, reg_stdev
trend_line_lsr(series, series, series, string, series, series) top_trend_line_lsr: Trend line fitting based on least square algorithm
Parameters:
series : int t: time scale value array corresponding to price
series : float p: price scale value array corresponding to time
series : int array_size: the length of regression array
string : reg_type: regression type in 'top' and 'bottom'
series : int max_iter: maximum fitting iterations
series : int min_points: the threshold of regression point numbers
Returns: reg_slop, reg_intercept, reg_level, reg_stdev, reg_point_num
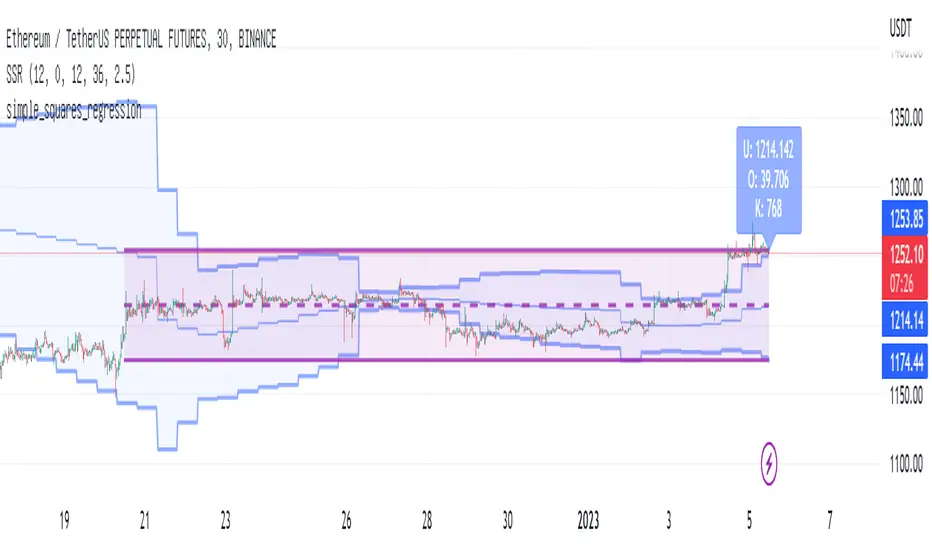
simple_squares_regressionLibrary "simple_squares_regression"
simple_squares_regression: simple squares regression algorithm to find the optimal price interval for a given time period
basic_ssr(series, series, series) basic_ssr: Basic simple squares regression algorithm
Parameters:
series : float src: the regression source such as close
series : int region_forward: number of candle lines at the right end of the regression region from the current candle line
series : int region_len: the length of regression region
Returns: left_loc, right_loc, reg_val, reg_std, reg_max_offset
search_ssr(series, series, series, series) search_ssr: simple squares regression region search algorithm
Parameters:
series : float src: the regression source such as close
series : int max_forward: max number of candle lines at the right end of the regression region from the current candle line
series : int region_lower: the lower length of regression region
series : int region_upper: the upper length of regression region
Returns: left_loc, right_loc, reg_val, reg_level, reg_std_err, reg_max_offset
on_balance_volumeLibrary "on_balance_volume"
on_balance_volume: custom on balance volume
obv_diff(string, simple) obv_diff: custom on balance volume diff version
Parameters:
string : type: the moving average type of on balance volume
simple : int len: the moving average length of on balance volume
Returns: obv_diff: custom on balance volume diff value
obv_diff_norm(string, simple) obv_diff_norm: custom normalized on balance volume diff version
Parameters:
string : type: the moving average type of on balance volume
simple : int len: the moving average length of on balance volume
Returns: obv_diff: custom normalized on balance volume diff value

moving_averageLibrary "moving_average"
moving_average: moving average variants
variant(string, series, simple) variant: moving average variants
Parameters:
string : type: type in
series : float src: the source series of moving average
simple : int len: the length of moving average
Returns: float: the moving average variant value

NormalizedOscillatorsLibrary "NormalizedOscillators"
Collection of some common Oscillators. All are zero-mean and normalized to fit in the -1..1 range. Some are modified, so that the internal smoothing function could be configurable (for example, to enable Hann Windowing, that John F. Ehlers uses frequently). Some are modified for other reasons (see comments in the code), but never without a reason. This collection is neither encyclopaedic, nor reference, however I try to find the most correct implementation. Suggestions are welcome.
rsi2(upper, lower) RSI - second step
Parameters:
upper : Upwards momentum
lower : Downwards momentum
Returns: Oscillator value
Modified by Ehlers from Wilder's implementation to have a zero mean (oscillator from -1 to +1)
Originally: 100.0 - (100.0 / (1.0 + upper / lower))
Ignoring the 100 scale factor, we get: upper / (upper + lower)
Multiplying by two and subtracting 1, we get: (2 * upper) / (upper + lower) - 1 = (upper - lower) / (upper + lower)
rms(src, len) Root mean square (RMS)
Parameters:
src : Source series
len : Lookback period
Based on by John F. Ehlers implementation
ift(src) Inverse Fisher Transform
Parameters:
src : Source series
Returns: Normalized series
Based on by John F. Ehlers implementation
The input values have been multiplied by 2 (was "2*src", now "4*src") to force expansion - not compression
The inputs may be further modified, if needed
stoch(src, len) Stochastic
Parameters:
src : Source series
len : Lookback period
Returns: Oscillator series
ssstoch(src, len) Super Smooth Stochastic (part of MESA Stochastic) by John F. Ehlers
Parameters:
src : Source series
len : Lookback period
Returns: Oscillator series
Introduced in the January 2014 issue of Stocks and Commodities
This is not an implementation of MESA Stochastic, as it is based on Highpass filter not present in the function (but you can construct it)
This implementation is scaled by 0.95, so that Super Smoother does not exceed 1/-1
I do not know, if this the right way to fix this issue, but it works for now
netKendall(src, len) Noise Elimination Technology by John F. Ehlers
Parameters:
src : Source series
len : Lookback period
Returns: Oscillator series
Introduced in the December 2020 issue of Stocks and Commodities
Uses simplified Kendall correlation algorithm
Implementation by @QuantTherapy:
rsi(src, len, smooth) RSI
Parameters:
src : Source series
len : Lookback period
smooth : Internal smoothing algorithm
Returns: Oscillator series
vrsi(src, len, smooth) Volume-scaled RSI
Parameters:
src : Source series
len : Lookback period
smooth : Internal smoothing algorithm
Returns: Oscillator series
This is my own version of RSI. It scales price movements by the proportion of RMS of volume
mrsi(src, len, smooth) Momentum RSI
Parameters:
src : Source series
len : Lookback period
smooth : Internal smoothing algorithm
Returns: Oscillator series
Inspired by RocketRSI by John F. Ehlers (Stocks and Commodities, May 2018)
rrsi(src, len, smooth) Rocket RSI
Parameters:
src : Source series
len : Lookback period
smooth : Internal smoothing algorithm
Returns: Oscillator series
Inspired by RocketRSI by John F. Ehlers (Stocks and Commodities, May 2018)
Does not include Fisher Transform of the original implementation, as the output must be normalized
Does not include momentum smoothing length configuration, so always assumes half the lookback length
mfi(src, len, smooth) Money Flow Index
Parameters:
src : Source series
len : Lookback period
smooth : Internal smoothing algorithm
Returns: Oscillator series
lrsi(src, in_gamma, len) Laguerre RSI by John F. Ehlers
Parameters:
src : Source series
in_gamma : Damping factor (default is -1 to generate from len)
len : Lookback period (alternatively, if gamma is not set)
Returns: Oscillator series
The original implementation is with gamma. As it is impossible to collect gamma in my system, where the only user input is length,
an alternative calculation is included, where gamma is set by dividing len by 30. Maybe different calculation would be better?
fe(len) Choppiness Index or Fractal Energy
Parameters:
len : Lookback period
Returns: Oscillator series
The Choppiness Index (CHOP) was created by E. W. Dreiss
This indicator is sometimes called Fractal Energy
er(src, len) Efficiency ratio
Parameters:
src : Source series
len : Lookback period
Returns: Oscillator series
Based on Kaufman Adaptive Moving Average calculation
This is the correct Efficiency ratio calculation, and most other implementations are wrong:
the number of bar differences is 1 less than the length, otherwise we are adding the change outside of the measured range!
For reference, see Stocks and Commodities June 1995
dmi(len, smooth) Directional Movement Index
Parameters:
len : Lookback period
smooth : Internal smoothing algorithm
Returns: Oscillator series
Based on the original Tradingview algorithm
Modified with inspiration from John F. Ehlers DMH (but not implementing the DMH algorithm!)
Only ADX is returned
Rescaled to fit -1 to +1
Unlike most oscillators, there is no src parameter as DMI works directly with high and low values
fdmi(len, smooth) Fast Directional Movement Index
Parameters:
len : Lookback period
smooth : Internal smoothing algorithm
Returns: Oscillator series
Same as DMI, but without secondary smoothing. Can be smoothed later. Instead, +DM and -DM smoothing can be configured
doOsc(type, src, len, smooth) Execute a particular Oscillator from the list
Parameters:
type : Oscillator type to use
src : Source series
len : Lookback period
smooth : Internal smoothing algorithm
Returns: Oscillator series
Chande Momentum Oscillator (CMO) is RSI without smoothing. No idea, why some authors use different calculations
LRSI with Fractal Energy is a combo oscillator that uses Fractal Energy to tune LRSI gamma, as seen here: www.prorealcode.com
doPostfilter(type, src, len) Execute a particular Oscillator Postfilter from the list
Parameters:
type : Oscillator type to use
src : Source series
len : Lookback period
Returns: Oscillator series

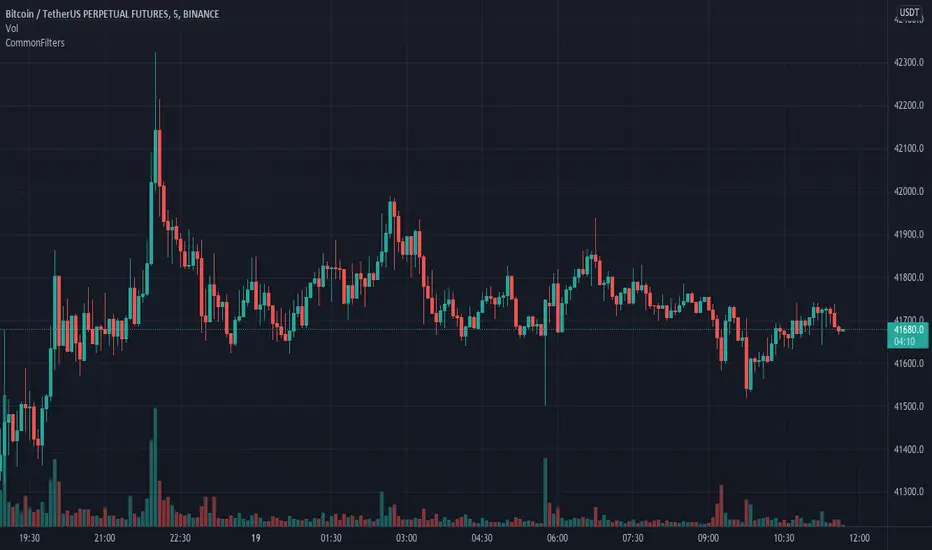
CommonFiltersLibrary "CommonFilters"
Collection of some common Filters and Moving Averages. This collection is not encyclopaedic, but to declutter my other scripts. Suggestions are welcome, though. Many filters here are based on the work of John F. Ehlers
sma(src, len) Simple Moving Average
Parameters:
src : Series to use
len : Filtering length
Returns: Filtered series
ema(src, len) Exponential Moving Average
Parameters:
src : Series to use
len : Filtering length
Returns: Filtered series
rma(src, len) Wilder's Smoothing (Running Moving Average)
Parameters:
src : Series to use
len : Filtering length
Returns: Filtered series
hma(src, len) Hull Moving Average
Parameters:
src : Series to use
len : Filtering length
Returns: Filtered series
vwma(src, len) Volume Weighted Moving Average
Parameters:
src : Series to use
len : Filtering length
Returns: Filtered series
hp2(src) Simple denoiser
Parameters:
src : Series to use
Returns: Filtered series
fir2(src) Zero at 2 bar cycle period by John F. Ehlers
Parameters:
src : Series to use
Returns: Filtered series
fir3(src) Zero at 3 bar cycle period by John F. Ehlers
Parameters:
src : Series to use
Returns: Filtered series
fir23(src) Zero at 2 bar and 3 bar cycle periods by John F. Ehlers
Parameters:
src : Series to use
Returns: Filtered series
fir234(src) Zero at 2, 3 and 4 bar cycle periods by John F. Ehlers
Parameters:
src : Series to use
Returns: Filtered series
hp(src, len) High Pass Filter for cyclic components shorter than langth. Part of Roofing Filter by John F. Ehlers
Parameters:
src : Series to use
len : Filtering length
Returns: Filtered series
supers2(src, len) 2-pole Super Smoother by John F. Ehlers
Parameters:
src : Series to use
len : Filtering length
Returns: Filtered series
filt11(src, len) Filt11 is a variant of 2-pole Super Smoother with error averaging for zero-lag response by John F. Ehlers
Parameters:
src : Series to use
len : Filtering length
Returns: Filtered series
supers3(src, len) 3-pole Super Smoother by John F. Ehlers
Parameters:
src : Series to use
len : Filtering length
Returns: Filtered series
hannFIR(src, len) Hann Window Filter by John F. Ehlers
Parameters:
src : Series to use
len : Filtering length
Returns: Filtered series
hammingFIR(src, len) Hamming Window Filter (inspired by John F. Ehlers). Simplified implementation as Pedestal input parameter cannot be supplied, so I calculate it from the supplied length
Parameters:
src : Series to use
len : Filtering length
Returns: Filtered series
triangleFIR(src, len) Triangle Window Filter by John F. Ehlers
Parameters:
src : Series to use
len : Filtering length
Returns: Filtered series
doPrefilter(type, src) Execute a particular Prefilter from the list
Parameters:
type : Prefilter type to use
src : Series to use
Returns: Filtered series
doMA(type, src, len) Execute a particular MA from the list
Parameters:
type : MA type to use
src : Series to use
len : Filtering length
Returns: Filtered series
WaddahAttarExplosionLibrary "WaddahAttarExplosion"
wae(sensitivity, macdFastEMALength, macdSlowEMALength, bbChannelLength, bbStdevMultiplier, refHigh, refLow, refClose) Returns the Waddah Attar Uptrend, Downtrend, Explosion Line and Dead zone
Parameters:
sensitivity : simple float multiplicator for trend line calculation from macd
macdFastEMALength : simple int length for macd fast line
macdSlowEMALength : simple int length for macd slow line
bbChannelLength : simple int length for calculating the bb channel (for std deviation)
bbStdevMultiplier : simple float multiplier to increace bb std deviation
refHigh : series float optional if you want to use another timeframe or symbol, pass it's 'high' series here
refLow : series float optional if you want to use another timeframe or symbol, pass it's 'low' series here
refClose : series float optional if you want to use another timeframe or symbol, pass it's 'close' series here
Returns:

ATRStopLossFinderLibrary "ATRStopLossFinder"
Average True Range Stop Loss Finder
credits to www.tradingview.com for the initial version
stopLossFinder(length, smoothing, multiplier, refHigh, refLow, refClose) Returns the stop losses for an entry on this candle, depending on the ATR
Parameters:
length : simple int optional to select the lookback amount of candles
smoothing : string optional to select the averaging method, options=
multiplier : simple float optional if you want to tweak the speed the trend changes.
refHigh : series float optional if you want to use another timeframe or symbol, pass it's 'high' series here
refLow : series float optional if you want to use another timeframe or symbol, pass it's 'low' series here
refClose : series float optional if you want to use another timeframe or symbol, pass it's 'close' series here
Returns: series float stopLossLong, series float stopLossShort, series float atr

AbdulLibraryLibrary "AbdulLibrary"
The library consists of three sections:
Technical Analysis Functions - A collection of tools commonly used by day traders
Trading Setup Filters Functions - A number of filters that help day traders to screen trading signals
Candlestick Pattern Detection Functions - To detect different candlestick patterns that are used in day trading setups
Note that this would have been possible without the help of @ZenAndTheArtOfTrading as I build-up this library after completing his pine script mastery course so big thanks to him
The content of the library are:-
fibLevels(preDayClose, preDayHigh, preDayLow) Calculates Daily Pivot Point and Fibonacci Key Levels
Parameters:
preDayClose : The previous day candle close
preDayHigh : The previous day candle high
preDayLow : The previous day candle low
Returns: Returns Daily Pivot Point and Fibonacci Key Levels as a tuple
bullishFib(canHigh, canLow, fibLevel) Calculates Fibonacci Levels in Bullish move
Parameters:
canHigh : The high of the move
canLow : The low of the move
fibLevel : The Fib level as % you want to calculate
Returns: Returns The Fib level for the Bullish move
bearishFib(canHigh, canLow, fibLevel) Calculates Fibonacci Levels in Bearish move
Parameters:
canHigh : The high of the move
canLow : The low of the move
fibLevel : The Fib level as % you want to calculate
Returns: Returns The Fib level for the Bearish move
getCandleSize() Calculates the size of candle (high - low) in points
Returns: Returns candle size in points
getCandleBodySize() Calculates the size of candle (close - open) in points
Returns: Returns candle body size in points
getHighWickSize() Calculates the high wick size of candle in points
Returns: Returns The high wick size of candle in points
getLowWickSize() Calculates the low wick size of candle in points
Returns: Returns The low wick size of candle in points
getBodyPercentage() Calculates the candle body size as % of overall candle size
Returns: Returns The candle body size as % of overall candle size
isSwingHigh(period) Checks if the price has created new swing high over a period of time
Parameters:
period : The lookback time we want to check for swing high
Returns: Returns True if the current candle or the previous candle is a swing high
isSwingLow(period) Checks if the price has created new swing low over a period of time
Parameters:
period : The lookback time we want to check for swing low
Returns: Returns True if the current candle or the previous candle is a swing low
isDojiSwingHigh(period) Checks if a doji is a swing high over a period of time
Parameters:
period : The lookback time we want to check for swing high
Returns: Returns True if the doji is a swing high
isDojiSwingLow(period) Checks if a doji is a swing low over a period of time
Parameters:
period : The lookback time we want to check for swing low
Returns: Returns True if the doji is a swing low
isBigBody(atrFilter, atr, candleBodySize, multiplier) Checks if a candle has big body compared to ATR
Parameters:
atrFilter : Check if user wants to use ATR to filter candle-setup signals
atr : The ATR value to be used to compare candle body size
candleBodySize : The candle body size
multiplier : The multiplier to be used to compare candle body size
Returns: Returns Boolean true if the candle setup is big
isSmallBody(atrFilter, atr, candleBodySize, multiplier) Checks if a candle has small body compared to ATR
Parameters:
atrFilter : Check if user wants to use ATR to filter candle-setup signals
atr : The ATR value to be used to compare candle body size
candleBodySize : The candle body size
multiplier : The multiplier to be used to compare candle body size
Returns: Returns Boolean true if the candle setup is small
isHammer(fibLevel, colorMatch) Checks if a candle is a hammer based on user input parameters and candle conditions
Parameters:
fibLevel : Fib level to base candle body on
colorMatch : Checks if user needs for the candel to be green
Returns: Returns Boolean - True if the candle setup is hammer
isShootingStar(fibLevel, colorMatch) Checks if a candle is a shooting star based on user input parameters and candle conditions
Parameters:
fibLevel : Fib level to base candle body on
colorMatch : Checks if user needs for the candel to be red
Returns: Returns Boolean - True if the candle setup is star
isBullEngCan(allowance, period) Check if a candle is a bullish engulfing candle
Parameters:
allowance : How many points the candle open is allowed to be off (To allow for gaps)
period : The lookback period for swing low check
Returns: Boolean - True only if the candle is a bullish engulfing candle
isBearEngCan(allowance, period) Check if a candle is a bearish engulfing candle
Parameters:
allowance : How many points the candle open is allowed to be off (To allow for gaps)
period : The lookback period for swing high check
Returns: Boolean - True only if the candle is a bearish engulfing candle
isBullDoji(maxSize, wickLimit, colorFilter) Check if a candle is a bullish doji candle
Parameters:
maxSize : Maximum candle body size as % of total candle size to be considered as doji
wickLimit : Maximum wick size of one wick compared to the other wick
colorFilter : Checks if the doji is green
Returns: Boolean - True if the candle is a bullish doji
isBearDoji(maxSize, wickLimit, colorFilter) Check if a candle is a bearish doji candle
Parameters:
maxSize : Maximum candle body size as % of total candle size to be considered as doji
wickLimit : Maximum wick size of one wick compared to the other wick
colorFilter : Checks if the doji is red
Returns: Boolean - True if the candle is a bearish doji
isBullOutBar() Check if a candle is a bullish outside bar
Returns: Boolean - True if the candle is a bullish outside bar
isInsideBar() Check if a candle is an inside bar
Returns: Returns Boolean - True if a candle is an inside bar
