High/Low Strat Trigger LinesHigh/Low Strat Trigger Lines that show the 1hr, 4hr, and Daily timeframe triggers
Thestrat

Broadening Formation Reclaim Stats v1.0Description: Broadening Formation Reclaim Stats v1.0
Overview
The Broadening Formation Reclaim Stats is a technical analysis tool designed to track and quantify "reclaim" price action within expanding market structures (Broadening Formations). It focuses on scenarios in which price breaches a prior Swing High or Swing Low and subsequently rotates back into the range, often signaling a potential reversal toward the opposite side of the formation.
This indicator is built for traders who study price action rotations, "The Strat" (Rev 2-2 / Failed 2-Down/Up), and liquidity sweeps.
How It Works
The script utilizes a state-machine logic to track price movements relative to high and low pivots:
1. Structure Identification: It identifies recent Pivot Highs and Lows (Auto-Swing mode) or allows users to input specific price levels (Manual mode).
2. The Breach: It identifies when price breaks above the established high or below the established low, "locking" the structure for a potential reclaim.
3. The Reclaim: A signal is generated when price moves back inside the range using specific price action triggers:
Rev 2-2: A reversal pattern where price reverses the direction of the previous candle.
Failed 2-Down/Up: Price makes a new wick extreme but closes back within the previous candle's range and below its opening price.
4. Targets: The script considers a reclaim "Successful" if price reaches the opposite side of the broadening formation (the opposing pivot).
Key Features
Backtesting Dashboard: A real-time table displaying the total number of reclaims, global success rates, and a breakdown of Bullish vs. Bearish performance.
Flexible Lookbacks: Statistics can be calculated based on the entire chart history, "Today Only" (for day traders), or a specific number of bars.
Dual Mode Detection: Choose between **Auto Swing** detection (based on a user-defined pivot length) or **Manual** mode for specific levels.
Optimized Visuals: Uses the Pine Script Plot Engine for core levels to ensure price-scale stability and "Box Objects" for clear pivot visualization.
Settings
Swing Length: Adjust the sensitivity of the pivot detection.
BF Mode: Toggle between automatic pivot tracking or manual price entry.
Statistics Start Mode: Filter the data displayed in the table to focus on recent price action or historical performance.
UI Customization: Fully adjustable table position, size, and transparency.
Disclaimer
This indicator is for educational and research purposes only. It tracks historical price action patterns and does not constitute financial advice. Past performance (success rates) as displayed in the dashboard is not an indicator of future results.

Timeframe Continuity BarsTimeframe Continuity Bars is a script that is extremely simple for good reason
So please, do not remove this post because it seems 'simple'
Now that's over with. Lets dive in to understand what timeframe continuity IS and what this indicator does.
Timeframe continuity is defined by 4 or more timeframes and it is the relationship of the last price traded to those 4 opening prices. Standard timeframe continuity would be using the M,W,D,60min timeframes.
The reason we use MTF analysis is because of the truth of what price is and how it works.
Price movement is SOLELY caused due to aggressive buying / selling. Some may attempt to refute this however at the end of the day. If the price is at 100.00 it is because a buyer is willing to buy there and a seller is willing to sell there. If those market participants did not want to buy or sell at 100.00 price would go up or down to meet the more aggressive participant.
So what does this look like you may ask...
If an aggressive buyer takes the offer we will see prices go up if they were willing to pay more than the last guy who took the offer.
So price may go from 100.00 to 100.01 because you decided to invest in that stock that day at that time with a market order
This same thing occurs when every other institution creates, adds, reduces, or exits a position. They have to buy or sell and they have to either do it aggressively or do it passively by sitting on the bid / ask and waiting.
So since this is true, we know that the relationship to the opening price is extremely important. This is because if price is above it's open that means buyers were willing to take the offer and buy at higher prices. If price is below it's open it means that sellers were willing to sell at the bid and they sold at lower prices.
So any candlestick chart is simply an aggregation of this aggressive buying/selling that is taking place at all times.
By using the timeframe continuity bars indicator we can measure the distance from the current open across 4 or more timeframes.
By doing this we can identify monthly participation groups, weekly participation groups, daily participation groups, and 60min participation groups.
When all those groups align green or red this is considered full timeframe continuity. Where the monthly weekly daily 60min groups are all taking the offer and buying, or all selling at the bid!
When this aligns this is when price is for CERTAIN going in one direction.
However, It is subject to change every 60 minutes as the 60min determines if those monthly weekly daily buyers are present RIGHT NOW.
So if the 60min changes we go into direct conflict against the month/week/day groups.
If we see the 60min and day align we go into direct conflict against the month/week
if the 60min day and week are red we over-take the monthly group for control. At the time of the week day and 60 being red we have ZERO evidence of the previous monthly buyer/seller that was present.
Now that you understand a little bit about continuity.. Check it out on the chart!
P.S Here is some tips
1) it is not about just all timeframes aligning, we want to see long green / red bars!
2) The opens reset on a cyclical basis. Each day, each week, each month... When the new timeframes open we will see timeframes have the SAME open. When the opens are the same price we have LESS evidence versus having all opens seperate.
3) Investors can use the Y Q M W as their 4 timeframes to see when institutional buying is occurring [go do a case study on AMEX:GLD and AMEX:SLV weekly timeframe with these settings]
4) You need to add 4 separate indicators and change the timeframes. It is ideal to then save this layout!
5) The best way to do price analysis is using #TheStrat across all 4 timeframes instead of one timeframe with this indicator. This is soley a tool we use to show changing of control between participation groups!

The Strat - Multi-Timeframe Combo Analyzer## 📊 The Strat - Multi-Timeframe Combo Analyzer
This open-source indicator implements **The Strat** methodology, a universal price action framework developed by Rob Smith (@RobInTheBlack).
---
### 🎯 What is The Strat?
The Strat categorizes every candle into one of three scenarios based on its relationship to the previous bar:
| Type | Name | Definition |
|------|------|------------|
| **1** | Inside Bar | High < Previous High AND Low > Previous Low |
| **2** | Directional | Breaks only one side (2↑ = broke high, 2↓ = broke low) |
| **3** | Outside Bar | Breaks BOTH previous high AND low |
By tracking these bar types across timeframes, traders can identify actionable setups with defined entry triggers and target levels.
---
### ✨ Features
**Daily Timeframe Analysis:**
- Real-time 3-bar combo detection (2-1-2, 3-1-2, 1-2-2, etc.)
- Pattern classification: Bullish/Bearish Continuation or Reversal
- Entry and Target levels based on Strat rules
- Pattern status: ACTIONABLE, IN-FORCE, TRIGGERED, or WATCHING
**ATR Context:**
- Range % used (how much of daily ATR has been consumed)
- Entry quality assessment (Excellent → Exhausted)
- Day type classification (Quiet → Trend Day)
- Remaining range estimation
**15-Minute Analysis:**
- Separate combo tracking for intraday precision
- Pattern detection on lower timeframe
**Visuals:**
- Customizable info tables
- Entry/Target horizontal lines
- Signal labels on chart
- Alert conditions
---
### 🔧 How to Use
1. Look for **ACTIONABLE** patterns - these are setups waiting for a trigger
2. Entry triggers when price breaks the designated level
3. Target is the next logical Strat level (typically prior bar's high/low)
4. Use **Range%** to assess if there's room left in the daily range
5. Combine Daily and 15-Min combos for trade confluence
---
### ⚠️ Disclaimer
This indicator is for **educational purposes only**. It does not constitute financial advice or guarantee profitable trades. Trading involves substantial risk of loss. Past performance is not indicative of future results. Always conduct your own research and trade responsibly.
---
### 🙏 Credits
**The Strat** methodology was created by Rob Smith (@RobInTheBlack).
This implementation is open-source. Feel free to study, modify, and improve the code!

Broadening Formation Structure Review ToolThis script provides an educational, checklist-based framework for studying Broadening Formations together with basic Strat-style reversal behavior and higher-timeframe direction. It is designed to show multiple structural conditions in one place so users can observe how they interact. It does not execute trades, generate signals, or provide financial advice.
What makes this script original is the integration of four components into a single logical framework:
• dynamic tracking of Broadening Formation high/low levels
• proximity evaluation relative to those levels
• classification of simple bar reversal behavior
• higher-timeframe open–close continuity checks
Instead of using these concepts as separate tools, the script combines them into a single checklist so users can see when multiple conditions occur at the same time.
Broadening Formation levels may be user-defined or automatically derived using:
• unlimited dynamic expansion
• range-limited dynamic expansion
• swing-pivot detection
• manual input mode
Users may also optionally lock levels once a structure is identified.
Proximity to BF levels can be measured in several ways, including percentage, ticks, points, dollars, ATR multiples, or expected-move multiples. The script can also detect when price takes out BF highs or lows.
The script classifies basic Strat-style price behavior, including:
• two-up / two-down moves
• outside bars
• failed 2U/2D reversals
• 2D→2U and 2U→2D reversals
A selectable higher timeframe (such as 60, 240, D, W, or M) is used to evaluate direction by comparing the higher-timeframe open and close.
The on-chart table summarizes:
• current BF High and BF Low levels
• proximity status relative to those levels
• whether BF highs or lows have been taken out
• reversal classification results
• higher-timeframe direction
• theoretical risk distance and 2R/3R projections
Optional alerts can notify when three-condition or four-condition checklist alignment occurs, based only on the logical rules visible in the script. Optional chart lines for BF levels may also be displayed.
Transparency and behavior notes
• swing pivots repaint until confirmed
• higher-timeframe direction is only final at bar close
• dynamically derived BF levels may update as price forms new extremes
This script is intended purely for market-structure study and education. It does not guarantee performance, predict outcomes, or recommend trades.

The Strat Candle Labels & Color Inc F2D F2UThis script uses TheStrat candle numbers 1, 2D, 2U, 3 and places the text below or above. I have also now added the Failed 2D/2U labels. You can also change the text size. This also allows you to change the colors of the candles with two options for the 1 & 3 so you can color them in the direction they are going. For example a 1 that is green can be green and a 1 that is red can be red.

The Strat: 3-2D Setup Label + Entry, Target & AlertsThis is an indicator that identifies the 3-2D setup based on TheStrat & will alert you if you have this on the chart. Once the 3-2D setup happens this will give you the entry, target and price labels. You can change the font size, label colors and add optional alerts.

The Strat Candle Types (1 / 2U / 2D / 3)This script uses TheStrat candle numbers 1, 2D, 2U, 3 and places the text below or above. You can also change the text size. This also allows you to change the colors of the candles with two options for the 1 & 3 so you can color them in the direction they are going. For example a 1 that is green can be green and a 1 that is red can be red.

Hardwaybets Strat Market Checklist Trading## **Hardwaybets TheStrat Market Checklist Engine**
**A Checklist-Driven TheStrat Trading**
---
### **Overview**
This script is an **informational market context and permission framework** designed to help users **organize structural and liquidity information** in a clear, checklist-based format.
It evaluates **price context only** and displays the results in a table.
It does **not** generate trade signals or trading instructions.
---
### **What This Script Does**
The indicator evaluates and displays:
* Nearest prior **Area of Interest (AOI)**
(Previous Day High/Low or Previous Week High/Low)
* Higher-timeframe structural bias (Daily & Weekly)
* Proximity to liquidity
* Liquidity behavior (acceptance vs rejection)
* **Strat pattern classification only** (12 canonical patterns)
* A final **permission state** based on the above conditions
All information is presented as **contextual reference data**, not execution guidance.
---
### **What This Script Does NOT Do**
* ❌ No buy or sell signals
* ❌ No arrows, markers, or execution prompts
* ❌ No entries, exits, stops, or targets
* ❌ No performance metrics or profitability claims
* ❌ No strategy or backtesting logic
The word **“TRADE”** in the dashboard refers to **permission status only**, not a recommendation to trade.
---
### **Dashboard Modes**
* **Full Mode**: displays AOI price and distance (points & ticks)
* **Compact Mode**: minimal checklist view for reduced screen usage
Both modes are **informational only**.
---
### **Pattern Classification**
The script identifies and labels Strat candle pattern **types only**, including:
* Reversal patterns
* Continuation patterns
* Compression patterns
* Expansion patterns
Pattern labels are **descriptive classifications**, not signals or instructions.
---
### **Intended Use**
This script is intended to be used as a **contextual reference tool** alongside a user’s own analysis, rules, or education.
It may be useful for:
* Market structure study
* Liquidity behavior observation
* Pattern classification review
* Educational purposes
---
### **Technical Notes**
* Pine Script® v6
* Uses completed candles only
* No repainting logic
* No future data access
* Table-based UI only
---
### **Disclaimer**
This indicator is provided **for educational and informational purposes only**.
The author does not provide financial advice, trading recommendations, or execution guidance.
All trading decisions remain the sole responsibility of the user.
---
### **Conceptual Attribution**
This script is inspired by publicly available market structure concepts commonly referred to as “The Strat” methodology.
No proprietary or paid content is included.
---
### **Feedback**
Constructive feedback and suggestions are welcome.
Please note that this script is intentionally **non-signaling by design**.

STRAT - MTF Dashboard + FTFC + Reversals v2.7# STRAT Indicator - Complete Description
## Overview
A comprehensive multi-timeframe STRAT trading system indicator that combines market structure analysis, flip levels, Full Timeframe Continuity (FTFC), and reversal pattern detection across 12 timeframes.
## Core Features
### 1. **Multi-Timeframe STRAT Dashboard**
- Displays STRAT combos (1, 2u, 2d, 3) across 12 timeframes: 1m, 5m, 15m, 30m, 1H, 4H, 12H, Daily, Weekly, Monthly, Quarterly, Yearly
- Color-coded directional bias (green/red/doji)
- Inside bars (●) and Outside bars (●) highlighted
- Current timeframe marked with ★
### 2. **HTF Flip Levels with Smart Grouping**
- Displays higher timeframe (HTF) flip levels (open prices) as labels on the right side
- Automatically groups multiple timeframes at the same price level (e.g., "★ 1H/4H/D")
- Current timeframe flip level always displayed with ★ marker
- Color-coded: Green (above price) / Red (below price)
### 3. **Full Timeframe Continuity (FTFC)**
- User-selectable 4 timeframes for FTFC analysis (default: D, W, M, Q)
- Green line: FTFC Up (highest open of 4 timeframes)
- Red line: FTFC Down (lowest open of 4 timeframes)
- Identifies when price is above/below all 4 timeframe opens
### 4. **Hammer & Shooting Star Detection**
- **Hammer Pattern**: Long lower wick (≥2x body), small upper wick, signals potential bottom reversal
- **Shooting Star Pattern**: Long upper wick (≥2x body), small lower wick, signals potential top reversal
- Scans last 100 bars (adjustable) and marks ALL historical patterns
- Chart markers: 🔨 (Hammer) below bars, 🔻 (Shooting Star) above bars
- Dashboard column shows reversal patterns for each timeframe
- Adjustable wick-to-body ratio sensitivity (1.5 to 5.0)
### 5. **Debug Tables**
- **FTFC Debug**: Shows close vs. 4 timeframe opens, confirms all-green/all-red conditions
- **Reversal Debug**: Real-time analysis of current bar - body size, wick measurements, ratios, and pattern qualification
## Settings
### Display Settings
- Dashboard position (9 options: top-left to bottom-right)
- Dashboard text size (tiny to huge)
- Label offset and text size
- Toggle individual features on/off
### FTFC Settings
- Select 4 custom timeframes for continuity analysis
- Default: Daily, Weekly, Monthly, Quarterly
### Reversal Settings
- **Wick to Body Ratio**: Sensitivity for pattern detection (default 2.0)
- **Lookback Bars**: How many historical bars to scan (default 100, max 500)
- Show/hide reversal markers on chart
- Show/hide reversal debug table
## Use Cases
1. **Momentum Trading**: Identify STRAT setups (2-2, 2-1-2 reversals, 3-bar plays) across multiple timeframes
2. **Swing Trading**: Use HTF flip levels as support/resistance and FTFC for trend confirmation
3. **Reversal Trading**: Catch hammer/shooting star patterns at key levels for counter-trend entries
4. **Multi-Timeframe Analysis**: Confirm alignment across timeframes before entering trades
## How to Use
### For STRAT Traders
- Look for 2-1-2 reversal setups in the dashboard
- Watch for inside bars (●) at HTF flip levels for breakout trades
- Use outside bars (●) to identify potential volatility expansion
### For Reversal Traders
- 🔨 Hammers after downtrends = potential long entries
- 🔻 Shooting stars after uptrends = potential short entries
- Combine with HTF flip levels for high-probability setups
### For Trend Followers
- FTFC green line above = bullish structure
- FTFC red line below = bearish structure
- Enter when price breaks and holds above/below FTFC levels
## Visual Elements
- **Green Labels**: HTF flip levels above current price (resistance)
- **Red Labels**: HTF flip levels below current price (support)
- **Lime Line**: FTFC Up (highest timeframe open)
- **Red Line**: FTFC Down (lowest timeframe open)
- **🔨 Icon**: Hammer pattern (potential reversal up)
- **🔻 Icon**: Shooting Star pattern (potential reversal down)
- **★ Symbol**: Current timeframe or multiple timeframes grouped
## Performance Notes
This indicator performs 12 multi-timeframe security calls and may take 15-30 seconds to calculate on initial load. This is normal for comprehensive MTF analysis.
## Version
v2.7 - Simplified reversal detection, current TF labeling, optimized performance
---
**Perfect for**: STRAT traders, multi-timeframe analysts, reversal pattern traders, swing traders looking for high-probability setups with confluence across timeframes.

ORB 30 Alerts (ATH)Overview
ATH ORB 30m automates the Opening Range Breakout (ORB) process across multiple global sessions — Tokyo, London, and New York — and delivers clean, consolidated alerts when fresh breakouts occur.
It’s built for traders who track several tickers and want precise, non-repeating signals that reflect genuine momentum shifts, not constant noise.
How it works
The script defines a 30-minute Opening Range (ORB) for each enabled session and plots its high, low, and midpoint levels.
Every 10-minute candle close is evaluated to detect first-time crosses of those range boundaries — upward or downward.
Once a breakout triggers, that side’s alert is disabled until price returns inside the range, where the system automatically re-arms.
Multiple triggers in the same bar are batched into one combined alert, listing all symbols that broke out.
A built-in debug panel and optional chart labels visualize each trigger and re-arm event in real time.
Key features
-Multi-session ORB logic (Tokyo, London, New York)
-10-minute confirmation filter to validate breakouts
-Automatic alert re-arming when price re-enters range
-Combined per-bar alert messages (no duplicates)
-Optional on-chart labels and debug diagnostics
-Optimized for watchlists and multi-symbol scanners
Usage
Designed for day traders and momentum scalpers, this tool highlights early directional strength during market opens.
Add it to your chart, enable your preferred sessions, and set alert conditions for “ORB Breakouts (BUY),” “ORB Breakdowns (SELL),” or "Any alert() function call" You’ll receive one concise message each bar showing exactly which symbols broke out and in which direction.
DISCLAIMER:
This script is for educational and informational purposes only.
It does not constitute financial advice or a recommendation to buy or sell any security.
Always perform your own due diligence and backtesting before using any trading strategy live.
Trading involves risk; past performance does not guarantee future results.

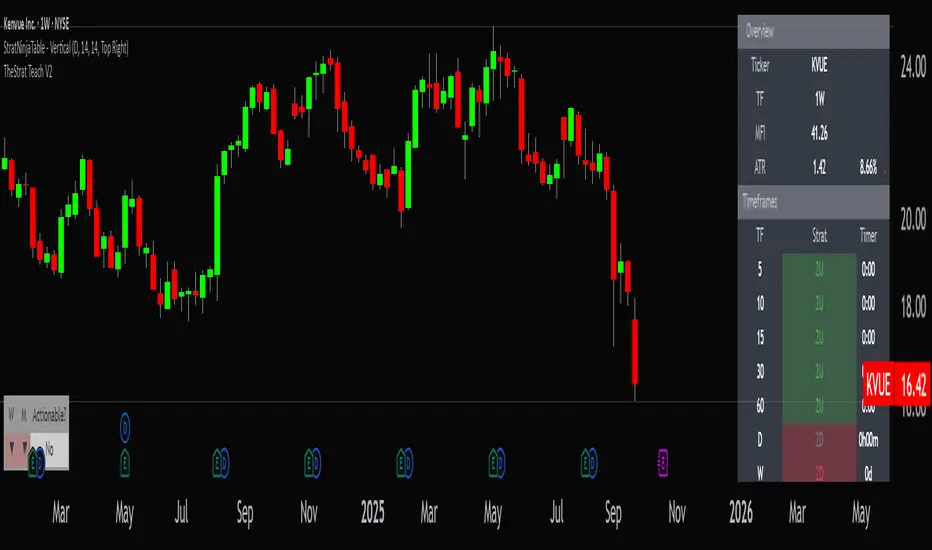
StratNinjaTable - VerticalA Pine Script v6 indicator that displays a vertical table with key The Strat data and supporting metrics.
✦ Table Structure:
Overview:
Ticker – the stock symbol.
TF – the chart’s main timeframe.
MFI – Money Flow Index with selectable timeframe.
ATR – Average True Range with color coding:
Green – below 3%.
Yellow – between 3% and 6%.
Red – above 6%.
Timeframes:
Displayed vertically (5m, 15m, 1H, D, W, M, etc.).
Each shows the current bar type according to The Strat (1, 2U, 2D, 3).
Text color reflects candle direction (green = close above open, red = close below open).
Includes a countdown timer to bar close.
Fundamentals:
Market Cap – in billions.
Sector – stock sector.
SMA20 Δ – distance from the 20-period SMA (in %).
Avg Volume (30d) – average 30-day volume (in millions).
✦ Adjustments Made:
Removed the Strat Pattern section completely.
Removed the DIR column – direction is now represented by Strat cell text color.
Reordered Overview section: Ticker → TF → MFI → ATR.
ATR now has three levels of coloring (Green/Yellow/Red) for >3% and >6%
30m stratDefine a time range, and the indicator will highlight it with a shaded area
This indicator lets you visualize higher timeframe levels while viewing a lower timeframe chart.

FAILED 9Define a time range, and the indicator will highlight it with a shaded area.
The indicator helps you see higher timeframe structure while trading on a lower timeframes

#TheStrat Multi-Timeframe In-Force Signals, Failed 2's, and FTFCThis indicator combines #TheStrat concepts of bar combinations, in-force signals, and timeframe continuity with 'Failed 2's' which can be early indication of a trend reversal.
It’s designed to help identify the prevailing trend but also reversal points when timeframe-based ranges are reclaimed because a signal failed or went out-of-force.
Core Concepts
1. TheStrat Bar Types
• 1 (Inside Bar): High ≤ previous high and Low ≥ previous low.
• 2U (Two Up): High > previous high and Low ≥ previous low.
• 2D (Two Down): Low < previous low and High ≤ previous high.
• 3 (Outside Bar): High > previous high and Low < previous low.
2. Failed 2’s — Definition & Detection
A Failed 2 occurs when a directional break (2U or 2D) reverses before following through.
This script lets you choose from four failure-definition modes:
1. Open — A 2U fails if last price is below open; a 2D fails if last price is above open.
2. Reclaim — A 2U or 2D fails if last price is within the previous bar’s range.
3. Both — Both of the above conditions must be met.
4. Either — Either condition must be met.
Failed 2U setups are bearish; Failed 2D setups are bullish.
You can also enable FTFC Override, which ignores reclaim-type failures when all higher timeframes are in full agreement with the current trend.
3. Timeframe Continuity (TFC)
TFC measures directional agreement across multiple timeframes.
• Full TFC (FTFC) Up: All selected timeframes above their opens.
• Full TFC (FTFC) Down: All selected timeframes below their opens.
• Mixed or neutral conditions are also displayed.
The indicator tracks classic TFC and supports trend-flip alerts when full agreement changes direction.
Features
• Customizable TFC table showing bar types, failed status, in-force status, reclaims, and direction arrows.
• Automatic bar coloring for TFC alignment, failed-2 transitions, or neutral states.
• Alerts for TFC trend flips.
• Multi-timeframe scanning with selectable intervals.
• Option to highlight bars that trigger a TFC flip due to failed-2 events.
Use Cases
• Quickly gauge market bias across multiple timeframes
• Identify failed 2 reversals against higher timeframes
• Spot potential turning points when trend flips occur
Limitations
This is a tool which can give earlier indication of trend reversals but is highly dependent on selected timeframes. This is discretionary, but having a range of higher and lower timeframes works best. In many cases, it will give the same trend 'flip' that classic FTFC would (based on open).
Ranges are based on timeframes, not swing highs and lows. The selected timeframes must capture the swing high or low to show a 'range' reclaim.
Timeframes lower than the display timeframe cannot be accurately shown due to PineScript limitations. They are 'greyed out' and not included in calculations or displays.
This script is based on the FTFC indicator by TradeForOpportunity with deep gratitude. It has been modified and expanded with permission under MPL 2.0.

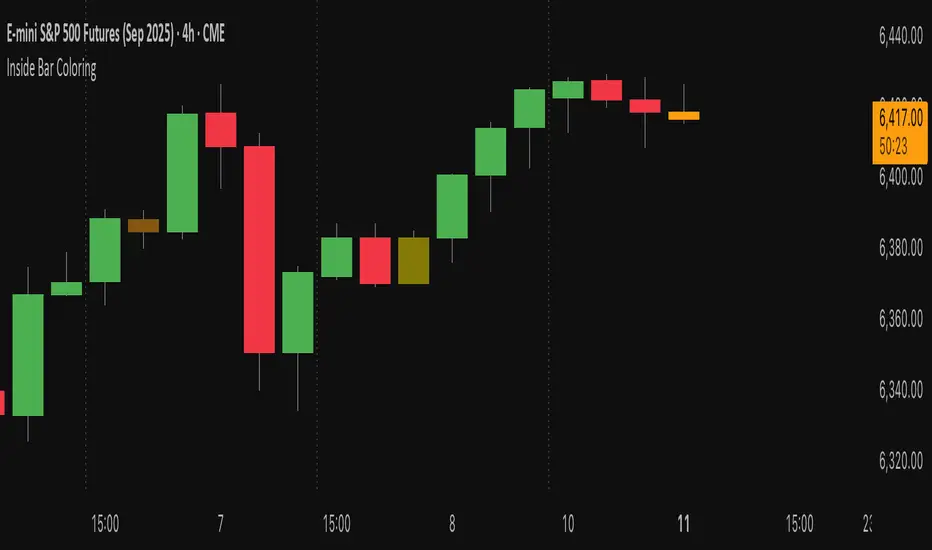
Inside Bar Coloring (Real-time + Historical) w/ AlertsDescription
This Pine Script v6 indicator identifies and colors inside bars, whose entire range (high and low) stays within the previous bar's range. It gives the option to color the real-time bar as well as historical inside bars.
Inside bars are colored differently based on whether they close above or below their opening price (bullish vs bearish). The indicator offers flexible display options including real-time-only highlighting, historical inside bar visualization with transparency, and optional triangle markers for enhanced visibility.
Utility
Inside bars represent periods of market consolidation and reduced volatility, and are by nature consolidating. During this equilibrium, it can be valuable to observe price development rather than engage with it. Conversely, a break of the equilibrium often marks a shift in volatility and provides opportunity. This indicator provides instant visual identification of this price action on your chart.
Features
Smart Coloring System: Separate colors for bullish (close ≥ open) and bearish (close < open) inside bars
Flexible Display Modes: Show only real-time bar, all historical bars, or customize transparency levels
Visual Markers: Optional triangles above or below inside bars
Real-time Alerts: Configurable alerts notify you when new inside bars form
Optimized Performance: Efficient Pine Script v6 code with minimal resource usage
Open Source: Released under Mozilla Public License 2.0
Settings
Customizable colors for bullish/bearish inside bars (real-time and historical)
Toggle historical inside bar display
Real-time bar only mode for clean charts
Adjustable marker position (above/below bars)
Alert activation with detailed price information
SHYY-TFC-Horizontal V2SHYY-TFC-Horizontal V2 – Multi-Timeframe Clarity for The Strat Traders
SHYY-TFC-Horizontal V2 is a powerful, clean, and efficient overlay designed for serious traders who use Rob Smith’s The Strat.
This real-time table gives you instant visual insight across all key timeframes – from 5 minutes to monthly – with:
Candle direction (bullish, bearish, neutral)
Strat bar type (1, 2U, 2D, 3)
Live countdown to bar close
Compact horizontal layout that saves space and enhances clarity
Fully customizable table position to fit any chart setup
Built with no lookahead bias, this version meets TradingView’s script publishing standards and is optimized for actionable, real-time decisions.
Ideal for:
Scalpers who need fast confirmation
Swing traders aligning entries with time frame continuity
Price action traders following The Strat methodology
Trade with confidence. See the full picture. React faster.
SHYY-TFC-Horizontal V2 – built to make you faster, sharper, and more in control.

SHYY TFC Candles_Confirmation X 4TF)SHYY Real-Time FTC Confirmation is a multi-timeframe trend alignment tool designed to provide real-time confirmation of market direction across up to four configurable timeframes. Unlike traditional tools that rely on closed candles, this version uses in-progress bars to detect live momentum, allowing traders to respond as trends are forming rather than after they are confirmed.
This script checks the current price direction on each selected timeframe by comparing the current close to the open of the same candle. A timeframe is considered bullish if the close is above the open, bearish if below, and neutral if equal. If all enabled timeframes are aligned in the same direction, the current chart candle is colored accordingly.
White candles indicate that all selected timeframes are currently bullish. Yellow candles indicate that all selected timeframes are currently bearish. If the timeframes are not fully aligned, the candle remains uncolored.
Each of the four timeframes can be configured individually in the settings panel. Users can also enable or disable each timeframe independently using checkboxes, allowing flexibility in how the confirmation logic is applied.
The script uses a single request.security() call per timeframe with lookahead enabled, so that the information shown reflects the live status of each timeframe’s bar, not just completed ones. This makes it suitable for real-time decision-making and strategy filtering.
This tool can assist scalpers, trend followers, and breakout traders in aligning trades with broader market direction. It can be used as a standalone trend filter or in conjunction with other indicators and strategies.
No external dependencies or overlays are required.
This is an original script, built to provide real-time, multi-timeframe confirmation using a clean and efficient approach.

The Strat The Strat Bar Type Identifier – Pure Price Action Logic
This open-source indicator implements the foundational bar classification of "The Strat" method developed by Rob Smith. It identifies each candle on the chart as one of the three core types used in The Strat:
* Inside Bar (1): The candle’s range is fully within the previous candle’s range. This indicates consolidation or balance and often precedes breakouts or reversals.
* Two-Up Bar (2U): The current candle breaks the previous high but does not break its low. This is considered bullish directional movement.
* Two-Down Bar (2D): The current candle breaks the previous low but not the high. This signals bearish directional movement.
* Outside Bar (3): The candle breaks both the high and the low of the previous candle, signaling a broadening formation and high volatility.
The script plots a character below each candle based on its type:
* "1" for Inside Bar
* "2" for Two-Up or Two-Down (color-coded)
* "3" for Outside Bar
This tool helps traders quickly identify actionable setups according to The Strat method and serves as a foundation for more advanced strategies like the 3-1-2 reversal or 1-2-2 continuation.
All calculations are based purely on price action—no indicators, no smoothing, no lagging elements. It is ideal for traders looking to understand price structure and bar sequencing from a Strat perspective.
To use:
1. Add the indicator to any chart and timeframe.
2. Look for the numbers below the candles.
3. Analyze the sequence of bar types to spot Strat setups.
This script is educational and can be extended with multi-timeframe context, FTFC logic, actionable signals, or broadening formation detection.
Clean, minimal, and faithful to the core principles of The Strat.

Multi-Timeframe High/Low MarkerDescription
This indicator displays the previous period's high and low price levels from up to three different timeframes simultaneously. Lines extend from the previous period through the current period, providing clear visual reference points for key price levels across multiple time horizons.
Utility
Identify price ranges and key levels from multiple periods.Reduce chart switching by displaying multiple ranges on a single chart.
Function
Track up to 3 different timeframes simultaneously (default: 1H, 4H, Daily)
Customize each timeframe's high and low line colors, width, and style (solid/dashed/dotted)
Optional current period opening price display for each timeframe
Smart overlap detection prevents duplicate lines when multiple timeframes share the same price level
Each timeframe can be individually enabled or disabled
All visual elements fully customizable through indicator settings

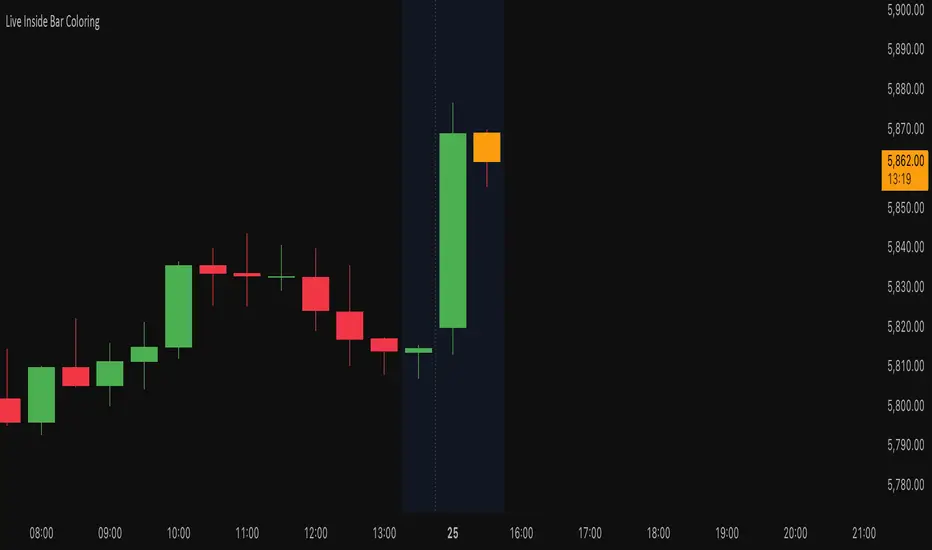
Live Inside Bar ColoringDescription
This script colors the current bar if it is inside the prior bar's high and low. Inside is defined as ≤ the high, and ≥ the low of the prior bar.
Utility
This gives a quick visual indication if the current bar is inside. This can indicate a choppier market. By definition, an inside bar is consolidating and not trending.
Function
Colors distinguish if the current price is above the opening price of the inside bar on a given timeframe. If you do not want to distinguish this, you can set both colors the same.
Failed 2D & Failed 2U BarsI created this indicator to plot a triangle when a candle is either 1) a failed 2 down--the candle breaks the low of the prior candle but closes green (or higher than its opening price) and doesn't break the high of the previous candle; and 2) a failed 2 up--high of the prior candle is broken but the bar is red and does not break the low of the prior candle.
It has alerts which you can set up in the alert system.
I think that this candle is one of the most telling and powerful when it comes to candle analysis.
R.I.P. Rob Smith, Creator of The Strat.
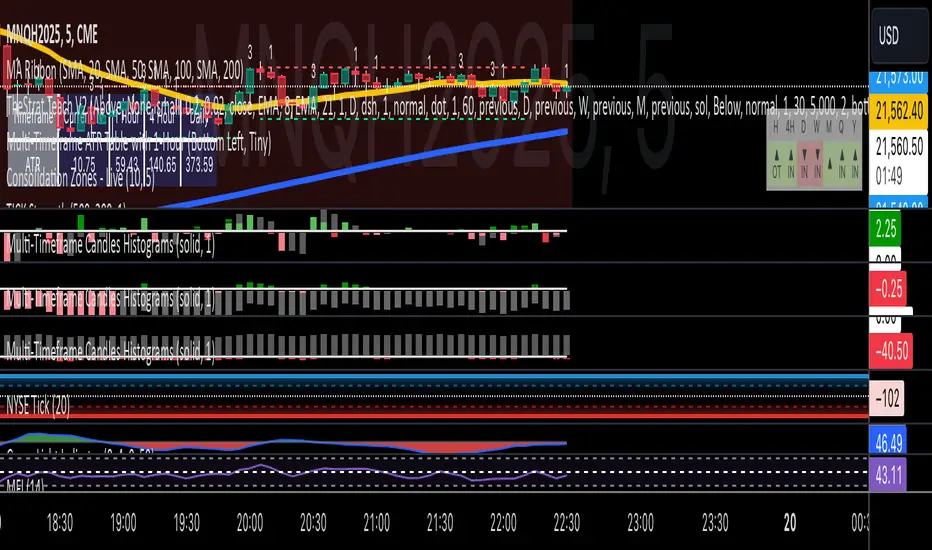
Multi-Timeframe Candles HistogramsAt some community members' requests, I have built on the original code to make it a single indicator with the option for users to check off which timeframes they want to be shown. Choices are 1-hour, daily, weekly, and monthly.
I couldn't figure out how to separate each timeframe into its own histogram, so this is the best I can offer at the moment. If any community member wants to take a crack at it, be my guest.
Colors are customizable.
If you have a paid TW account, you can lay it down twice and put the hour and daily on one and the weekly and monthly on the other.
That said, I hope you enjoy this version of this indicator.
R.I.P. Rob Smith, creator of TheStrat.
---
Key Features and Benefits
1. Custom Timeframe Selection:
- Choose from an array of timeframes ranging from minutes to months, giving you complete flexibility in your market analysis.
- Quickly switch between different timeframes (e.g., 1-hour, daily, or weekly) to track continuity across varying levels.
2. Visual Representation of High/Low Markers:
- Enable or disable the display of high and low points to better understand price ranges and reversals.
- These markers allow you to spot key turning points on different timeframes, facilitating better entry or exit decisions.
3. Enhanced Candle Visualization:
- Displays candles with precise price levels aligned to your chosen timeframe, giving a clearer view of price trends.
- Candles are color-coded to reflect price movement, which is customizable by the user.
---
How to Use This Indicator
Monitor Multiple Timeframes Simultaneously:
- Place the indicator on your chart and choose the timeframes you want to follow (e.g., hourly, daily, weekly, monthly).
- For each instance, checkmark the desired timeframes in the menu to ensure that you’re tracking the right period.
Achieve Timeframe Continuity:
- By aligning lower timeframes with higher ones, this tool helps you confirm trends, detect reversals, and avoid trades that go against the broader market movement.
---
Why This Indicator is Valuable for Traders
This tool simplifies a core principle of TheStrat—full timeframe continuity—by visually representing price action across multiple timeframes in a clear and actionable way. It removes the guesswork and helps traders stay in sync with market momentum, regardless of the timeframe they are analyzing.
This solution offers flexibility, clarity, and speed, enabling traders to quickly grasp critical movements and improve decision-making. Whether you are a scalper focusing on intraday moves or a swing trader watching weekly trends, this tool empowers you to maintain alignment with the overall market structure.
In essence, it brings the power of TheStrat to your fingertips by offering precise and easy-to-read visual aids, allowing you to seamlessly apply Rob Smith’s philosophy to your trading.