TKP T3 Trend With Psar BarcolorThis script is adapted from TKP's long/short indicator to initiate buy/sell indications when price crosses the T3 moving averages, and when the T3's themselves cross. Bars change colors based on price over/under T3 and T3 up or down or This allows for simple visual analysis of trend direction along with entries, exits, and stop loss values.
Tilson

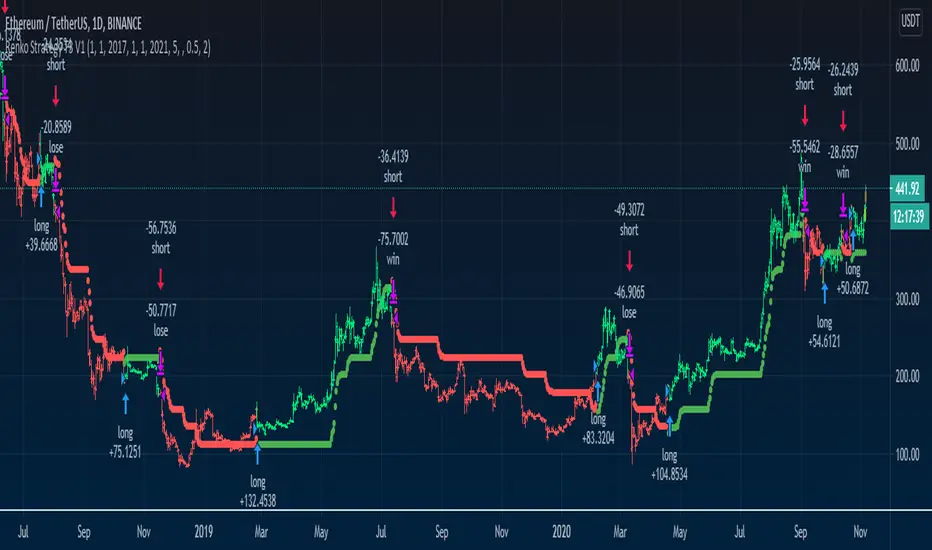
Renko Strategy T3 V1An interesting strategy using Renko calculations and Tilson T3 on normal charts targeted for cryptocurrencies but can work with different assets.
Tested on Daily but can work with lower frames using Renko Size and T3 Length adjustments.
== Description ==
Strategy get Renko close/open/high/low values and smooth them with T3 Tilson.
Base on these results the strategy triggers a long and short orders, where green uptrending and red downtrending.
Including Alerts
== Repaint ==
There seems to be some sort of inconsistency when doing 'Replay' function with the strategy, which means using Replay function won't trade like if you see the trading results without Replay. Regarding real time, it does not seem to repaint, besides that you need to wait for the last active bar to complete for it to give you indication.
You can disable strategy to use it has a sole indicator.
There might be a new strategy of Renko Strategy V2 in the future as i have an in progress prototype, Follow to get updated:
www.tradingview.com
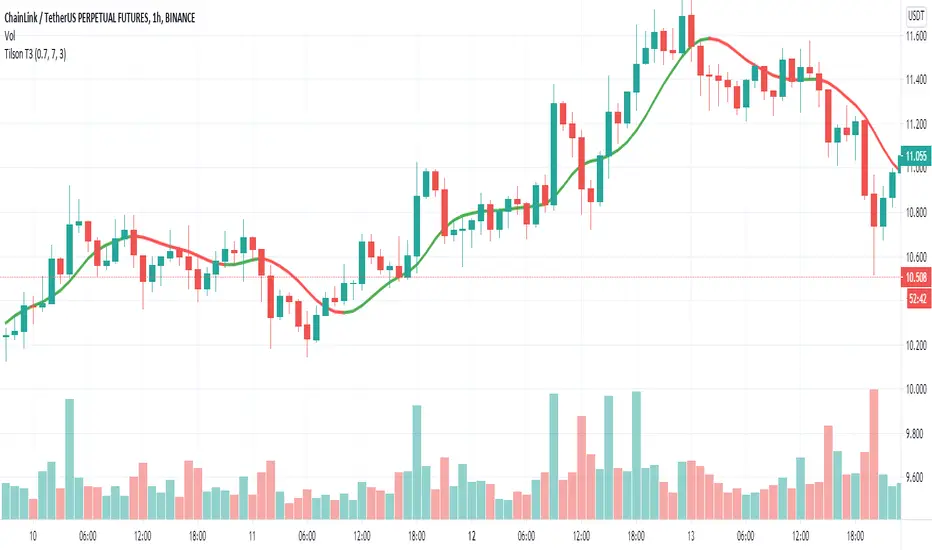
Tilson T3Developed by Tim Tillson, the T3 Moving Average is considered superior to traditional moving averages as it is smoother, more responsive and thus performs better in ranging market conditions as well. However, it bears the disadvantage of overshooting the price as it attempts to realign itself to current market conditions (www.tradingpedia.com).
Heikin Ashi Trend IndicatorMy own implantation of Heikin Ashi which i call HAT.
The Heikin Ashi Trend Indicator (HAT) used to determine the price direction of an asset, as well as draw attention to when the price direction is changing.
The HAT indicator translates the current close/open/high/low into Heikin Ashi and smooths them a bit using Tilson T3 formula.
Buy signal when Heikin Ashi Close is bigger than Heikin Ashi Open with Tilson T3 smoothing.
Sell signal when Heikin Ashi Open is bigger than Heikin Ashi Close with Tilson T3 smoothing.
Set the 'percentSqueeze' percentage to display possible reversal with light Red/Green crosses.
Green - Up Trend
Light Green - Possible reversal is near
Red - Down Trend
Light Red - Possible reversal is near
Follow for more indicators: www.tradingview.com

KK_MA_MTFThis is multitimeframe Hull moving average
you can change offset to 0 if you want realtime data

Tilson T3 and MavilimW Triple Combined StrategyInspired by truly greatful Kivanç Ozbilgic (www.tradingview.com).
The strategy tries to combined three different moving average strategies into one.
Strategies covered are:
1. Tillson T3 Moving Average Strategy
Developed by Tim Tillson, the T3 Moving Average is considered superior to traditional moving averages as it is smoother, more responsive and thus performs better in ranging market conditions as well. However, it bears the disadvantage of overshooting the price as it attempts to realign itself to current market conditions.
It incorporates a smoothing technique which allows it to plot curves more gradual than ordinary moving averages and with a smaller lag. Its smoothness is derived from the fact that it is a weighted sum of a single EMA, double EMA, triple EMA and so on. When a trend is formed, the price action will stay above or below the trend during most of its progression and will hardly be touched by any swings. Thus, a confirmed penetration of the T3 MA and the lack of a following reversal often indicates the end of a trend. Here is what the calculation looks like:
T3 = c1*e6 + c2*e5 + c3*e4 + c4*e3, where:
– e1 = EMA (Close, Period)
– e2 = EMA (e1, Period)
– e3 = EMA (e2, Period)
– e4 = EMA (e3, Period)
– e5 = EMA (e4, Period)
– e6 = EMA (e5, Period)
– a is the volume factor, default value is 0.7 but 0.618 can also be used
– c1 = – a^3
– c2 = 3*a^2 + 3*a^3
– c3 = – 6*a^2 – 3*a – 3*a^3
– c4 = 1 + 3*a + a^3 + 3*a^2
T3 MovingThe T3 Moving Average generally produces entry signals similar to other moving averages and thus is traded largely in the same manner.
Strategy for Tillson T3 is if the close crossovers T3 line and for at least five bars the close was under the T3
2. Tillson T3 Fibonacci Cross
Kivanc Ozbilgic added a second T3 line with a volume factor of 0.618 (Fibonacci Ratio) and length of 3 (fibonacci number) which can be added by selecting the T3 Fibonacci Strategy input box.
Strategy for Tillson T3 Fibo is when the Fibo Line crossover the T3 it gives long signal vice versa.
3. MavilimW
MavilimW is originally a support and resistance indicator based on fibonacci injected weighted moving averages.
Strategy for MavilimW is is if the close crossovers T3 line and for at least five bars the close was under the T3
Hope you enjoy

TKP Short/Long IndicatorThis script uses T3 Moving averages and a modified Parabolic Sar Calculation to help Identify trend reversals, but can also keep you in the predominant direction of strong trending price action.

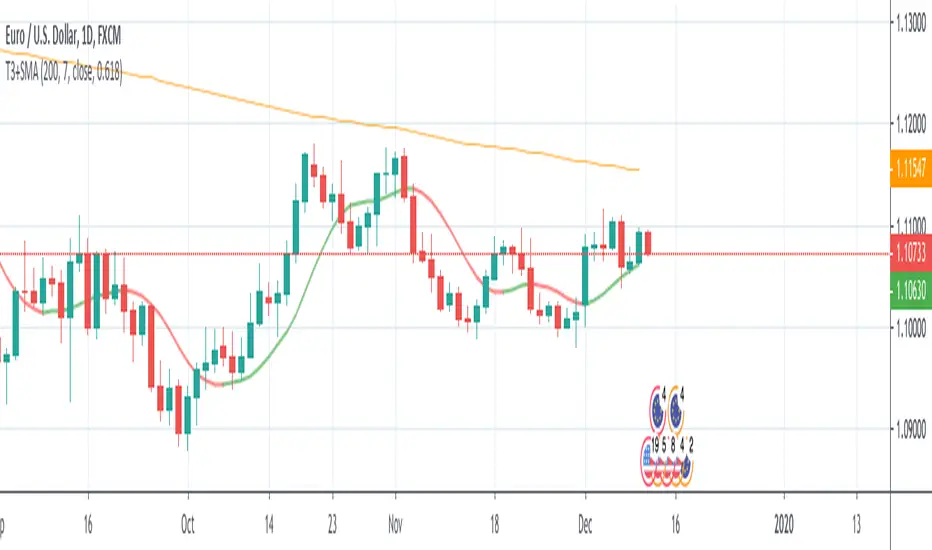
T3+SMA This source code is subject to the terms of the Mozilla Public License 2.0 at mozilla.org
© 03.freeman
This strategy is based only on T3 moving average, but uses sma 200 as filter for enter long or short.
The default settings considers a daily timeframe.
The strategy is very simple: long if T3 increase, short if T3 decrease.
Note that if you set volume factor to 0 you will have an exponential moving average, while if you set to 1 you'll get a DEMA.
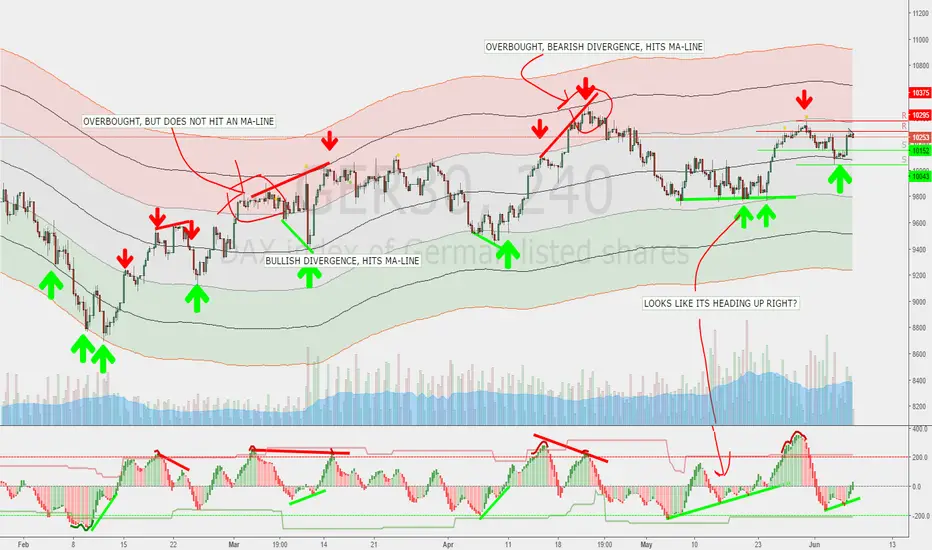
Yacine MA Bands ModMashed together the ema-bands from IvanLabrie with some moving average script stuff from ChrisMoody and LazyBear and this is the result. Credit goes to them, 'cause I don't know to how to code tbh. Just copy/pasted stuff untill I got the result I wanted.
Bands work as support/resistance among other things. You can use them to trade breakouts or reversals or whatever.
Combining them with a momentum indicator would probably be useful for timing divergence or OB/OS and stuff like that.
Included moving average types;
SMA
EMA
RMA
WMA
VWMA
HullMA
TilsonMA
TEMA
Not sure if all of them works as they should... y'know since I cant code/script. Looks good to me though.¨
Default should work pretty good for the DAX, But you'll probably want to fiddle a bit with the settings.
Here's a pic of how they can be used. Ofc everything looks simple in hindsight, but you get the point.