TPO IQ [TradingIQ]Hello Traders!
Introducing "TPO IQ"!
TPO IQ offers a Time Price Opportunity profile with several customization options that packs several related features to help traders navigate the generated profiles!
Features
TPO Profiles
Single Print identification
Initial Balance Identification
Can be anchored to timeframe change
Can be anchored to fixed time interval
Last profile detailed visuals
Customizable value area percentage
POC identification
Mid-point identification
TPO Profiles
A TPO profile is a market profile visualization that details how much time was spent at each price level throughout the time interval.
The image above further explains what a TPO Profile is!
Each letter corresponds to a candlestick. With this information, traders are able to visualize how much time was spent at each price area.
With customizable gradient colors, specifically in this example, blocks colored red are the earliest times in the profile, blocks colored green are in the beginning half of the time midpoint of the profile. Blue blocks represent the first half of the end of the time period, and purple blocks correspond to the end of the time period.
Please note that this form of TPO profile generation will only occur when the most recent profile uses less than 500 alphabet characters! If more than 500 characters are preset, TPO IQ will revert to using labels!
Initial Balance
TPO IQ also identifies the initial balance range and all alphabet characters that form within it!
The image above exemplifies this feature. The initial balance range is denoted by a a neon-blue line, with a blue circle showing the opening price. All characters within the initial balance range are highlighted blue, which is a feature that can be disabled with customizable colors.
POC
TPO IQ also identifies the point of control (POC) of the TPO Profile.
The point of control for the profile is labeled yellow by default, and shows where price spent the most time throughout the time period.
The image above shows the POC for the time period being identified by TPO IQ.
Value Area
TPO IQ also identifies the value area of the profile. A customizable percentage that is 70% by default, the value area of a TPO profile shows where price traded the majority of the time.
The image above further explains this feature. For this example, with the value area percentage being set to 70%, the value area high and value area low show the price zone that prices traded at 70% of the time throughout the profile.
TPO Midpoint
In addition to the POC, the TPO profile midpoint is also identified by TPO IQ.
The TPO midpoint simply corresponds to the middle price between the session's high and low!
Fixed Interval Mode
By default, TPO IQ recalculates every day, but this can also be changed to a customizable session time, such as 4 hours. If 4 hours is selected, then a new TPO profile will be generated every 4 hours.
However, in Fixed Interval mode, a TPO profile will be generated through a user-defined time range, such as 1300-1700.
In the image above, Fixed Interval mode is applied with a time range of 1300-1700 and, consequently, TPO IQ generates a new profile throughout every 1300-1700 time range!
This feature allows traders to specify time ranges of interest to generate TPO profiles for!
TPO Overview Label
The TPO overview label shows key statistics for the TPO profile generated throughout the trading session!
The "TPO Count" statistic shows how many alphabetical letters were generated for the profile, which is an adequate method to determine the session's volatility and price range.
The "Tick Levels" statistic shows how many tick levels were used to create the profile - another method to determine the volatility and price range of the session.
The "Top Letter" statistic shows which letter appears most throughout the profile. In this example, the top letter was "f", which means throughout creation of the profile, the letter "f" appeared the most!
And that's all for now!
If you have any feedback or new feature ideas for TPO IQ please feel free to share them with us!
Thank you traders!
Tpochart

TPO Letters [Kioseff Trading]Hello!
"TPO Letters" functions similarly to the script "Realtime TPO Profile"; however, TPO characters are appended to a developing bar. Simply, TPO characters display on the bar that formed them.
All colors are configurable.
The image above emphasizes functionality; TPO letters are colored on a gradient . Additionally, the value area range is shaded; characters that form within the range are gradient colored. Gray-colored characters extend beyond the value area.
The columned data displayed right of the TPO letters shows tick levels. Tick levels are shaded various colors, each color indicative of some occurrence.
Tick Levels
Red: Single Print
Yellow: POC
Lime Green: VAH or VAL
Lighter Green: Value Area Inclusive Level
Left of the TPO horizontal-axis, the aqua-colored line (blue-line inclusive) reflects the high-low range of the session; the blue-colored line reflects the initial-balance range (IBR).
You can select to color TPO letters within the IBR blue (any color).
Additionally, you can select to shade the IBR.
The image above shows auxiliary features.
Unfortunately, I'm unable to orient TPO letters at their intended tick levels using one label per bar, a contrasting feature of the "Realtime TPO Profile" script.
This means only 1000 TPO letters can be displayed simultaneously. If the number of TPO letters exceeds 1000, early-session and middle-session characters will begin to disappear. This isn't an issue for the "Realtime TPO Profile" script, as each tick level comprised one label, to which additional TPO characters were appended to the label as necessary and extended horizontally. Using this same method proved fallible for this indicator - vertical scaling is an issue. While I could append all letters formed for a bar to one label, the letters wouldn't superimpose atop their corresponding tick level (using " " didn't suffice).
Consequently, you'll have to, at times, rely on the label & box count oriented in the bottom-right table to see whether the number of labels & boxes transcends the upper threshold. You can hide this table at anytime (:
The image above exemplifies the "Fixed Range" portion of the indicator. A useful inclusion for the "Realtime TPO Profile" script however, while still useful for "TPO Letters", can only display 1000 TPO letters concurrently.
You can also reset the TPO profile at user-defined time intervals.
The indicator hosts an auto-calculate tick levels option; however, there will be times you'll need to manually adjust the tick levels to achieve digestible results (:
That's all! If the script would benefit from an excluded feature, or you notice an error, please let me know! Thank you (:
Shoutout to @kaigouthro for creating an exceptional library for gradient colors!! It was used in this script (:

SpaceTime LevelsSpaceTime Levels Part of the SpaceTime Complete Suite
SpaceTime Levels provides a much needed improvement in the display of multi session compatible levels related to TPO calculations (Time x Price)
The relevant levels are neatly mapped out in a way that is easy to read without the need of the whole profile, e.g. having VA levels D/W/M without the addition
D/W/M Profiles being attached to them reducing the onscreen clutter.
Fully customizable for display includes:
Line styles,
Thickness,
and Coloring.
Text Size,
Coloring.
Custom offset for levels
Pros:
Visible levels, lack of onscreen distractions.
Previous Profile levels included, e.g. pVAH related to previous Value Area High
Cons:
Limited to one previous profile session
Updates incoming:
Additional levels if people request such as NPOCs
Full suite view:

SpaceTime TPOSpaceTime TPO Part of the SpaceTime Complete Suite
SpaceTime TPO Provides an modified codebased to remastered to display the TPO Calculations in a separate indicator with multiple new features, a separate release was necessary in order to maximise the usage of the draw history that can be provided.
Significantly improved from its predecessor Spacetime advanced, the display options used here are less resource heavy and therefore can display multiple profiles in comparison to the previous "high res lettering"
Full suite view:
The main additional advantage of this separate indicator comes in the form of Split TPO profiles ! This utilizes the tradingview display engine creating a whole new way to display data comparative to the candlestick method, doing so will help visualise the profile as it develops.
The Split profiles comes with a pro and con
Pro:
Split profile makes it easier to detect real price movement adjusted to tick
Also tracks the VA travel by history so it is easier to visualise value expansion!
Con:
Due to some limitation some data may occasionally be missed on very volatile candles
Fix:
Increase ticksize/Leave on wicks for candles to see these fluctuations
Update fix inbound: Will display the overflow in a dynamic way so no wicks are needed for all candles if this persists to be a problem
SpaceTime TPO also comes with the same advantages of multi session profile TPOs
Additionally comes with the ability to have a session line
Session Line tracking can continue with "Total" For full length of profile
And
"VA" for Value Area tracking
(or off)
Close tracking in the form of a square is available
Pending updates:
Split profile improvement
Close tracking improvement
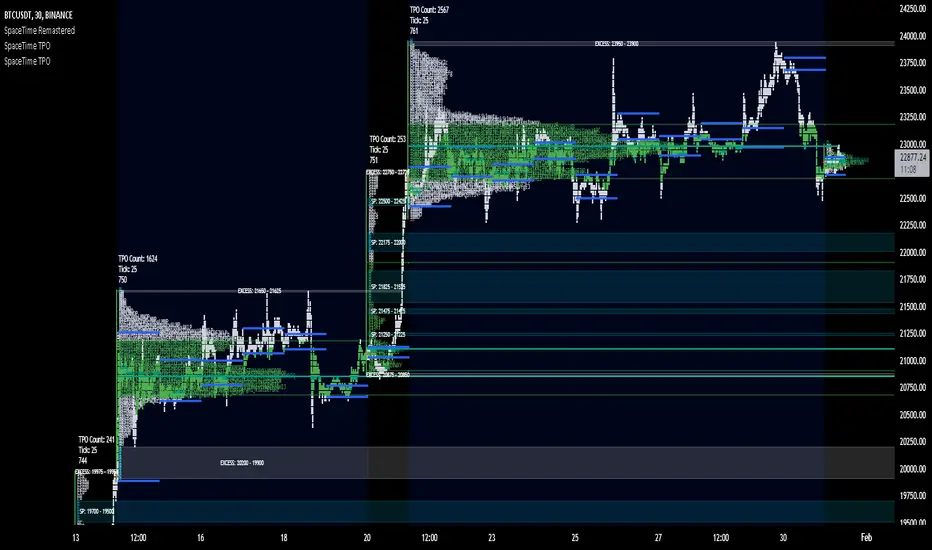
SpaceTime RemasteredSpaceTime Remastered
SpaceTime Remastered provides a new code base for TPO Calculations. Significantly enhanced and some differences justifying leaving both choices for users to choose between. Using the PineV5 library, providing the ability to create a profile of price and time.
The main advantage is now being able to run multiple sessions simultaneously whilst also being more efficient. This has allowed for synchronous data generation for multi profile uses and still executing at a faster speed. Additionally this has given the rise to London, New York and Asia sessions as options with this new knowledge in mind. However, the sessions can be utilised beyond this in the form of D,W,M at the same time as an example with a multitude of possible combinations up to the users interest.
Tick for the multiple sessions to determine the segmented data generation of the TPO, can be split between the sessions and work independently of one another. This tick is vital alongside time and price. The generation of this tool can be used to highlight trending and ranging conditions and opportunities to spot both can be used to take trades, e.g. using value migration in use of trend development.
The release of the AutoTick improvements is significant as well providing more consistency and less affected reaction to the volatility in its calculation leading to a more accurate profile tool. AutoTick is a global controller and will handle tick generation for any enabled session.
The words and their abbreviation plus key.
POC: Point Of Control
VA: Value Area
SP: Single Print
EXS: Excess *sell or buy tail
PHL: Poor High/Low
TPO: Time Price Opportunity
N = Naked e.g. NPOC Naked Point of Control
D = Developing e.g. DVA Developing Value Area
VAStyles and POCStyles exist to better customise the representation of datak,
Show Text Data is toggleable to give the text representation of key inflection points and data. TPO Count, TickSize used, Excess location boundaries, Single Print Location Boundaries.
Display modes exist for All data, VA + Levels and Levels up to the users choosing.
Session timings are adjustable.
ToDo:
Add Initial balance if requested.
Add User Settings for select members of the community.
Add TPO lettering, delayed as mostly unused in predecessor.
Add Rotation Factor

SpaceTime Profile CompositesSpaceTime Profile Composites
SpaceTime Profiel Composites provides an alternative composite builder to the existing solution in the SpaceTime Profile Advanced.
Using the new pinev5 I utilize the ability for user confirmed data to give them the choice in time in a more interactable and user friendly way.
The main advantage of this is the ability to create multiple composites without multiple uses of SpaceTime Profile Advanced, additionally the user can select the indicator and edit the composite start time using the chart as opposed to the date picker in pine.
The indicator is fully fleshed out with all the features:
PoC
NPoC
Single Prints
Naked Single Prints
Value Area
Value Area Levels
Naked Value Area Levels
Excess
Poor highs and lows
Initial Balance
Auto TickSize
Auto TickSize
This has been heavily adjusted to allow greater detail, and less reliant on volatility, should this work well consistently SpaceTime Profile Advanced may also recieve this change to auto ticksize.
How To Use
Composites are best utilized when multiple value areas are overlapping with their POCS in range of the previous VA's, using a composite
the user is able to generate the greater picture for how this area will provide useful levels of interest, instead of multiple smaller profiles, the user can utilize one larger profile to give more accurate levels of reaction.

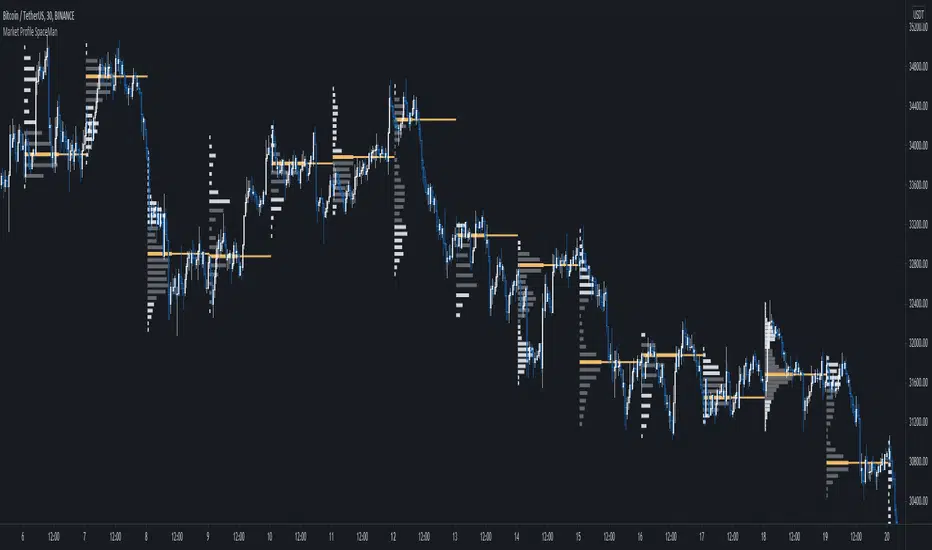
SpaceTime Profile Regular SpaceManBTCSpaceTime Profile Regular SpaceManBTC
Is a profiling tool for a market session.
Using time and price it calculates the TPO mapping the POC on your chart as well as the general profile.
The tool is useful as it can give you a general idea of how a day traded/is trading based off of its shape.
As well as provides the current developing POC as a reference for potentially a dynamic level of interest.
Value area shading is also including in the release using 68% as my reference of personal choice to represent where
bulk of the market activity occured on a given time frame.
To generate the data the indicator aims to look at the price variations over time of the given session (you can choose this in settings), this will then stack
and overlay on the chart to generate the TPO calculations by mapping 1 to 1 with the price you see on the chart.
This will give you areas of importance such as the POC which can be retested when naked providing a point of interest.
Works similar to volume profile but with no volume calculations only with price and time in mind.
Very useful tool for trend / market analysis by providing this graphical representation of a trading session between buyers and sellers!
SpaceTime Profile AdvancedSpaceTime Profile Advanced is different to the non overlay with a different codebase.
The main advantages are the 1:1 price mappings that occur on this data generation as well as the auto mapping POC line!
The implementation is heavily different and therefore they both provide different uses
Overlay is better for current chart data being mapped up to 10 days minimum in most cases
As well as POC lines and soon High value areas
ToDo:
Naked POC
High value areas
Auto Tick Size
Better colouring

SpaceTime Profiles Non Overlay SpacemanBTCSpaceTime Profiles Non Overlay is a tool used by many traders that aim to get more confluence with their trading style.
ALPHA V1.0.0
Typically, market profile can be used to help determine high value areas where a likely reaction is to occur when price reaches this level, this can provide market generated support and resistance . This indicator uses time price interaction to accurately create a market profile for TradingView, a feature that is useful for many traders who want to expand their knowledge.
User can choose to enable or disable lettering, and further features such as tick size and color are customizable.
Soon I will include additional features such as point of control extending the area of interest.
Currently works in non overlay mode, apply to existing panel to make it easier to chart lines.
Further more an overlay version is in the works
Looking forward to everyone trying this, you can appropriately message me for access.
