MorphWave Bands [JOAT]MorphWave Bands - Adaptive Volatility Envelope System
MorphWave Bands create a dynamic price envelope that automatically adjusts its width based on current market conditions. Unlike static Bollinger Bands, this indicator blends ATR and standard deviation with an efficiency ratio to expand during trending conditions and contract during consolidation.
What This Indicator Does
Plots adaptive upper and lower bands around a customizable moving average basis
Automatically adjusts band width using a blend of ATR and standard deviation
Detects volatility squeezes when bands contract to historical lows
Highlights breakouts when price moves beyond the bands
Provides squeeze alerts for anticipating volatility expansion
Adaptive Mechanism
The bands adapt through a multi-step process:
// Blend ATR and Standard Deviation
blendedVol = useAtrBlend ? (atrVal * 0.6 + stdVal * 0.4) : stdVal
// Normalize volatility to its historical range
volNorm = (blendedVol - volLow) / (volHigh - volLow)
// Create adaptive multiplier
adaptMult = baseMult * (0.5 + volNorm * adaptSens)
This creates bands that respond to market regime changes while maintaining stability.
Squeeze Detection
A squeeze is identified when band width drops below a specified percentile of its historical range:
Background highlighting indicates active squeeze conditions
Low percentile readings suggest compressed volatility
Squeeze exits often precede directional moves
Inputs Overview
Band Length — Period for basis calculation (default: 20)
Base Multiplier — Starting band width multiplier (default: 2.0)
MA Type — Choose from SMA, EMA, WMA, VWMA, or HMA
Adaptation Lookback — Historical period for normalization (default: 50)
Adaptation Sensitivity — How much bands respond to volatility changes
Squeeze Threshold — Percentile below which squeeze is detected
Dashboard Information
Current trend direction relative to basis and bands
Band width percentage
Squeeze status (Active or None)
Efficiency ratio
Current adaptive multiplier value
How to Use It
Look for squeeze conditions as potential precursors to breakouts
Use band touches as dynamic support/resistance references
Monitor breakout signals when price closes beyond bands
Combine with momentum indicators for directional confirmation
Alerts
Upper/Lower Breakout — Price exceeds band boundaries
Squeeze Entry/Exit — Volatility compression begins or ends
Basis Crosses — Price crosses the center line
This indicator is provided for educational purposes. It does not constitute financial advice.
— Made with passion by officialjackofalltrades
Trading-indicators

MACD Josh MACD Study — Visual Crossover Tags
Overview:
This script displays MACD signals in a clear, visual way by showing:
Histogram = EMA(Fast) − EMA(Slow)
Signal = EMA(Histogram, Signal Length)
It adds labels and arrows to help you see crossover events between the Histogram and the Signal line more easily.
⚠️ Disclaimer: This tool is for educational and research purposes only. It is not financial advice or an investment recommendation. Past performance does not guarantee future results. Users should make their own decisions and manage risk responsibly.
Features
Central Zero Line with Signal and Histogram plots
Optional labels/arrows to highlight Histogram–Signal crossovers
Alerts for crossover and crossunder events, integrated with TradingView’s alert system
Standard adjustable inputs: Fast EMA, Slow EMA, Signal EMA
How to Interpret (for study only)
When the Histogram crosses above the Signal, a visual label/arrow marks a positive MACD event
When the Histogram crosses below the Signal, a visual label/arrow marks a negative MACD event
The “BUY/SELL” labels are visual study tags only — they do not represent trade instructions or recommendations
Responsible Usage Tips
Test across multiple timeframes and different assets
Combine with higher-timeframe trend, support/resistance, or volume for confirmation
Use alerts with caution, and always test in a demo environment first
Technical Notes
The script does not use future data and does not repaint signals once bars are closed
Results depend on market conditions and may vary across assets and timeframes
License & Credits
Written in Pine Script® v5 for TradingView
The indicator name shown on chart is for labeling purposes only and carries no implication of advice or solicitation

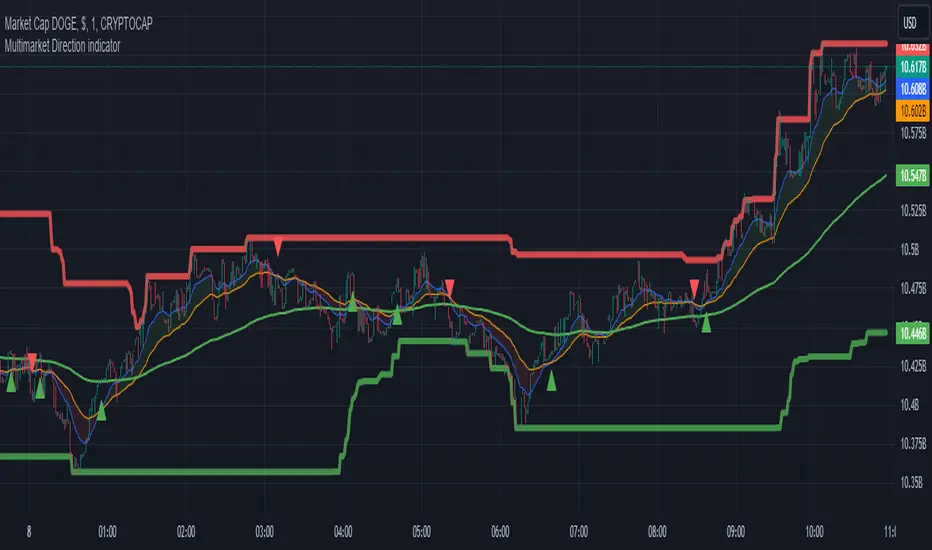
Multimarket Direction indicatorTrendline trading with resistant and support made by me.
Im bad coder and just jump into the tradingview pine script 1 days before so please don't hates me
- I don't know why my script is ded before lol
Signals to trade up
1. The big candles up cross the ema200 (last 5 candles for confirmation)
2. Wait for showing the up triangle.
3. Lookup the resistant/support line. If near the resistant please consider to wait if it break then join the trade
4. Only out trade when it has a down triagle or the candles has big down candles at the resistant/support line.
That it...
Auto Trailing stoploss By InvestYourAsset💥The Auto Trailing Stop-Loss indicator is a technical indicator that uses the ATR (Average True Range) to calculate a trailing stop-loss for both long and short positions.
💥The signals according to the indicator allows traders to exit from the position before its too late! The indicator can be used to determine when to enter and exit trades.
💥To use the indicator, you simply need to set the input parameters to suit your trading style and risk tolerance. The default values for the parameters are:
p: The ATR period (14)
q: The stop period (20)
x: The multiplier used to calculate the initial high and initial low (1.5)
Calculations:
📈Calculates the ATR using the specified period you can modify ATR period according to your trading style.
📈Calculates the initial high and low stop levels based on the highest high and lowest low over the user defined ATR period.
📈Calculates short and long stoploss levels using the initial high and low stops.
💥Once you have set the input parameters according to your trading style whether you are a day trader or a swing trader, the indicator will plot the short stoploss, long stoploss, and stoploss hit signals on your chart.
💥You can use the indicator to enter and exit trades in a various ways.
For example,
🚀 you could enter a long trade when the price crosses above both red and green lines plotted on the chart. (or when price crosses over both short stoploss and long stoploss.) You could also use the indicator to secure your profits by moving your stop-loss up as the price moves in your favor.
Here is an example of how you could use the indicator to enter and exit trades:
🚀Enter a long trade when the price crosses above the red line or short stoploss.
✅keep Moving your stop-loss upward with the long stoploss or green line.
✅Exit the trade when the price crosses below the long stoploss or green line.
💥You can also use the indicator to protect your existing trades. For example, if you are already in a long trade, you could move your stop-loss up to the short stop when the price moves up 10%. This will help you to protect your profits in case the price starts to move against you.
💥💥some additional tips for using the Auto Trailing Stop-Loss indicator:
✅Use the indicator in conjunction with other technical indicators or your own trading strategy to generate entry and exit signals.
✅Backtest your trading strategy before using it live to make sure that it is profitable.
✅Use the indicator to protect your profits by moving your stop-loss up as the price moves in your favor.
✅ Always follow risk management rules and manage your position sizing according to your risk appetite.
✅ Be aware of the overall trend direction. If the trend is up, you should be looking for bullish reversals or continuations. If the trend is down, you should be looking for bearish reversals or continuations.
This script essentially provides a visual representation of a trading strategy that automatically adjusts stop-loss levels based on market volatility (ATR). It also includes signals for entering long or short positions and visually highlights these signals on the chart.
📣📣Follow us for timely updates regarding future indicators and give it a like if you appreciate the work.📣📣
