Color Changing Moving Average
Hello everybody!
I'm not much of a coder but I do make indicators for myself for fun sometimes and found this one super cool. Hope it helps!
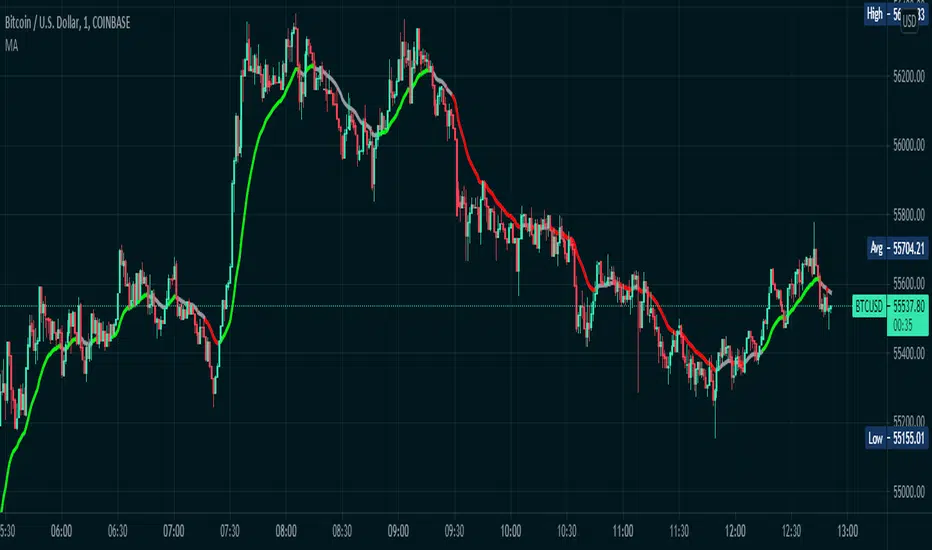
Basically it's a moving average that changes colors based on the trend. How does it do it, you may ask? Simply put, it checks and makes sure that the open and close price is above the moving average, then it checks and sees if the 50-period RSI (length adjustable) is above 50. If both conditions are met, the moving average turns green. Simple as that.
If the price is below the moving average and the RSI is below 50, the moving average turns red.
If the price is above the moving average but the RSI is below 50, the line is grey and I advise to simply waiting for the trend direction to be decided. Likewise, if the price is below the moving average, but the RSI is above 50, the line is also grey.
This is NOT a comprehensive system, and the changing color of the moving average does not indicate a buy or sell signal. It simply indicates that the price is trending. You should use your own entry and exit strategy, such as the MACD, Wave Trend, Schaff Trend Cycle, etc.
As well, I would recommend waiting for confirmation of a trend change when the color changes, since in a range price can cross multiple times before deciding on the right direction.
The slope of the moving average can help too, since in a range the moving average is typically flat.
I would recommend using a fixed risk to reward ratio, to limit emotions. But, this would also help with a trend-following strategy due to the trend filter functionality.
The length of the moving average is adjustable, as well as the RSI period- though I wouldn't recommend selecting an RSI lower than 30 because it will whipsaw more. Disabling the EMA option will give you an SMA that does the same thing as the EMA. You can also disable the RSI filter and simply have a moving average that changes color when the price is above/below- but that's pretty boring, huh?
Anyways, hope this helps, happy trading everybody :)
Trendfilter
Aligned Moving Average FilterThis is another adoption of Aligned Moving Average index study published earlier:
Instead of summing up the aligned moving average strength, here we are checking the max and min values from X bars. If maxValue is above threshold, we show bullish bias by coloring candles lime. Similarly if minValue is below threshold we show bearish bias by coloring candles orange. If the max and min signals are mixed - showing both bullish and bearish or showing neither bullish or bearish, then we do not have any bias and candles are colored in silver.
Parameter descriptions are as below:
Moving Average Type : Select moving average type to calculate moving average alignment index
LookbakPeriod : Periods to calculate min and max values
Threshold : Percentage less/more than min/max values of alignment index. At present, max value of alignment index is 36. Hence, 25 threshold will consider max ma alignment index above 27 as bullish and min alignment index below 9 as bearish
Filter type : allows you to use only bullish or bearish filter.
If bullish type is selected, then candle colors are based only on the maxValue of moving average alignment. Candle color will be lime if above threshold and silver otherwise.
If bearish type is selected, then candle colors are based only on the minValue of moving average alignment. Candle color will be orange if below threshold and silver otherwise.
SMOTHING_MOVE_SIDDThis Indicator is used to smooth the movement of scripts with SMMA and SEMA .
Inspired by Chris Moody RSI-EMA .
This indicator help to avoid any kind of small correction in trending direction and it filter small kind of correction.
Small correction like 2-15 irregular corrective candles is filtered with the help of smooth moving average and Arnaud Legoux Moving Average.
Keep default setting help for optimal trend filter changing setting may change the results.
This Indicator is not recommending for Buy and Sell.
New Choppiness IndexThis script tries to identify trending regions and ranging choppy regions.
Green areas are trends; Red areas are consolidation areas.
If you are a trend follower trader you should focus on green areas;
If you are a harmonic pattern trader you should focus on red areas.
I did not play with the parameters extensively, but as a rule of thumb higher parameters
helps on long term trades.
This tool seems to work better for major currencies pairs, presumably due to the
high exchanged volumes that reduces weird fluctuations.
Good set of parameters are:
(55, 9) the default ones, doing impressively well in EURUSD Daily;
(8, 5) doing well in GBPCHF Daily, short trades to be set at lower timeframes.
Happy trading,
vitelot/yanez/Vts
January 2019
Hitting the like button is a free sign of gratitude.
Trend FilterThe indicator colours the candles either Green or Red depending on the following conditions:-
If the N Bar Average Close > N Bar Average Open, the Bars are coloured Green.
If the N Bar Average Close < N Bar Average Open, the Bars are coloured Red.


