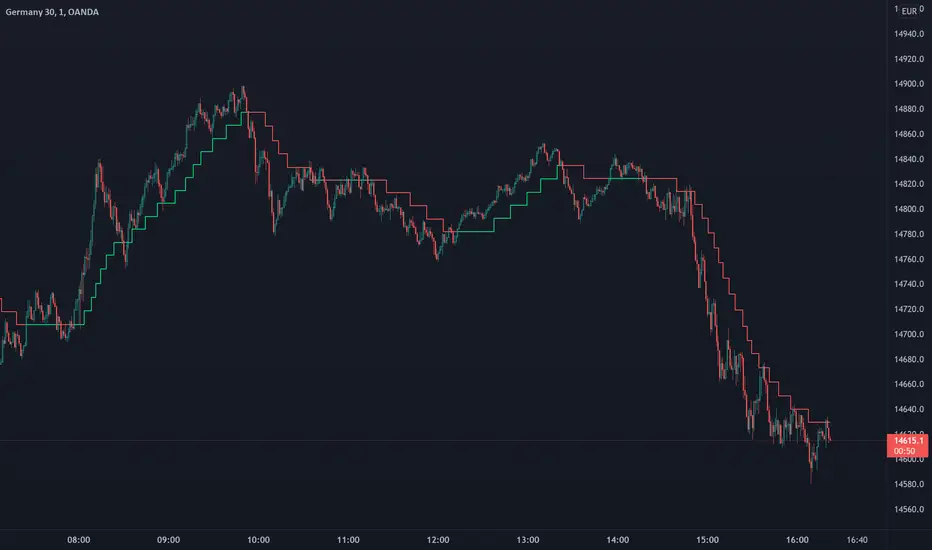
Trend Step - TrailingTrend Step - Trailing Stop is a moving average-based trailing stop that moves in pre-defined steps. In this way, the user can set the number of pips/points they want the trailing to move in relation to the movements in the average. You can also see it as trend steps. Every step represents the trend movement.
Usage
Use it as a trailing stop or as a trend direction tool.
Disclaimer: No financial advice, only for educational/entertainment purposes.
Trendtrading
[UPRIGHT] Awesome DMI+Hello Traders,
Today I'm releasing a spin on an 'oldie but goodie'; the Directional Movement Index (DMI).
DMI is a combination of 3 different indicators developed by the famous J. Welles Wilder. DMI has 3 different plots: the ADX, +DI, and -DI. The first is the ADX (Average Directional Index), which Wilder created in 1978 to show the strength of a trend by comparing the current price with the previous price range. The other two are the +DI (positive directional indicator) and the -DI show up as two separate lines, +DI is the difference between the highest price of the current day and the highest price of the day before, and -DI does the same calculation with the current and previous day's lows.
How does it work?
When the ADX line is above 25 (as a general rule, some traders use a different threshold, +/- 5), the trend is strong. When the +DI line is above the -DI line, the asset (stock) is moving in an uptrend, and the opposite means the asset is in a downtrend.
How is this different?
Uses multiple calculations to produce signals for an indicator than normally doesn't have any.
Multiple ADX's, +DI's, and -DI's for better accuracy and clearer direction changes.
Ability to use 2 different background highlight signals and several buy/sell signals.
Fully customizable (as always), ability to turn on or off any signals, change any of the colors to suit your needs.
Added pre-filled Alerts.
The ribbons created by the fill make it easier to see the change in direction of each plot.
The chart should look like:
Cheers,
Mike
(UPRIGHT TRADING)

Trading Made Easy Pressure OscillatorAs always, this is not financial advice and use at your own risk. Trading is risky and can cost you significant sums of money if you are not careful. Make sure you always have a proper entry and exit plan that includes defining your risk before you enter a trade.
Those who have looked at my other indicators know that I am a big fan of Dr. Alexander Elder and John Carter. This is relevant to my trading style and to this indicator in general. While I understand it goes against TradingView rules generally to display other indicators while describing a new one, I need the Bollinger Bands, Bollinger Bands Width, and a secondary directional indicator to explain the full power of this indicator. In short, if this is strongly against the rules, I will edit the post as needed.
Those of you who are aware of John Carter are going to know this already, but for those who don’t, an explanation is necessary. John Carter is a relatively famous retail-turned-institutional (sort of) trader. He is the founder of TradetheMarkets, that later turned into SimplerTrading. Him and his company have a series of YouTube videos, he has made appearances on the MoneyShow, TastyTrade, and has authored a couple of books about trading. However, he is probably most famous for his “Squeeze” indicator that was originally launched on Thinkorswim and through his website but has now been incorporated into several trading platforms and even has a few open-source versions available here. In short, the Squeeze indicator looks to identify periods of consolidation and marry that with a momentum oscillator so you can position yourself in a quiet period before a large move. This in my opinion, is one of the best indicators an option trader can have, since options are priced both on time and volatility. To do this, the Squeeze identifies when the Bollinger Bands, a measure of price standard deviation, have contracted inside the Keltner Channels (a measure of the average range of a stock). This highlights something known as “the Squeeze”, when the 2x standard deviations (95% of all likely price movement using data from the past 20 periods) is less than the 1.5x average true range (ATR) of the stock over the same number of periods. These periods are when a stock is resting and in a period of consolidation and is generally followed by another large move once it has rested long enough. The momentum oscillator is used to determine the direction of this next move.
While I think this is one of the best indicators ever made, it is not without its pitfalls. I find that the “Squeeze” periods sometimes take too long to setup (something that was addressed by John and released in a new indicator, the Squeeze Pro, but even that is still slowish) and that the momentum oscillator was also a bit slow. They used a linear regression formula to track momentum, which can lag considerably at times. Collectively, this meant that getting into moves a few candles late was not uncommon or someone solely trading squeeze setups could have missed very good trade opportunities.
To improve on this, I present, the Trading Made Easy Pressure Oscillator. This more accurately identifies when volatility is reducing and the trading range is likely to contract, increasing the “pressure” on the price. This is often marked several candles before a “Squeeze” has started. To identify these ranges, I applied a 21-period exponential moving average to the Bollinger Bands Width indicator (BBW). As mentioned above, the Bollinger Bands measure the 2x standard deviation of price, typically based on a 20-period SMA. When the BBs expand, it marks periods of high volatility, when they contract, conversely, periods of low volatility. Therefore, applying an EMA to the BBW indicator allows us to confidently mark when volatility has slowed down earlier than traditional methods. The second improvement I made was using the Absolute Price oscillator instead of a linear regression-style oscillator. The APO is very similar to a MACD, it measures the difference between two exponential moving averages, here the 8 and 21 (Fibonacci EMAs). However, I find the APO to be smoother than the MACD, yet more reactive than the linear regression-style oscillators to get you into moves earlier.
Uses:
1) Buying before a bigger than expected move. This is especially relevant for options traders since theta decay will often eat away much of our profits while we wait for a large enough price move to offset the time decay. Here, we buy a call option/shares when the momentum oscillator matches the longer-term trend (i.e. the APO crosses over the zero line when price is above the 200-day EMA, and vice versa for puts/shorting the stock). This coincides with Dr. Elder’s Triple Screen Trading System, that we are aligning ourselves with the path of least resistance. We want to do this when price is currently in an increasing pressure situation (i.e. volatility is contracting) to make sure we are buying an option when premium and Implied Volatility is low so we can get a better price and have a better risk to reward ratio. Low volatility is denoted by a purple dot, high volatility a blue dot along the midline of the indicator. A scalper or short-term swing trader may look to exit when the blue dots turn purple signalling a likely end to a move. A longer-term trend trader can look to other exit scenarios, such as a cross of the oscillator below the zero line, signalling to go short, or using a moving average as a trailing stop.
2) Sell premium after a larger than expected move has finished. After a larger than expected move has completed (a series of blue dots is followed by a purple dot), use this time to sell theta-driven options strategies such as straddles, strangles, iron condors, calendar spreads, or iron butterflies, anything that benefits from contracting volatility and stagnating prices. This is useful here since reducing volatility typically means a contraction of prices and the reduced likelihood of a move outside of the normal range.
3) Divergences. This indicator is sensitive enough to highlight divergences. I personally don’t use it as such as I prefer to trend trade vs. reversion trade. Use at your own risk, but they are there.
In summary, this indicator improves upon the famous Squeeze indicator by increasing the speed at which periods of consolidation are marked and trend identification. I hope you enjoy it.

Stock Rotation Model [CC]This is an original indicator so a true hidden gem in my opinion. I based this idea off of the work by Giorgos Siligardos (Stocks and Commodities Aug 2012) with his indicator called the Sector Rotation Model. This indicator is best used as a trend confirmation in combination with another indicator such as a leading indicator. This will show you how strong the current stock you are looking at is compared to the S&P 500 which almost everyone uses as a relative strength comparison. Feel free to change the default lengths if you would like as these were just the settings that I liked the best overall. Let me know if you find any good combos that works for most stocks in general. I have included strong buy and sell signals in addition to normal ones so strong signals are darker in color and normal signals are lighter in color. Buy when the line turns green and sell when it turns red.
Let me know if there are any other indicators or scripts you would like to see me publish!

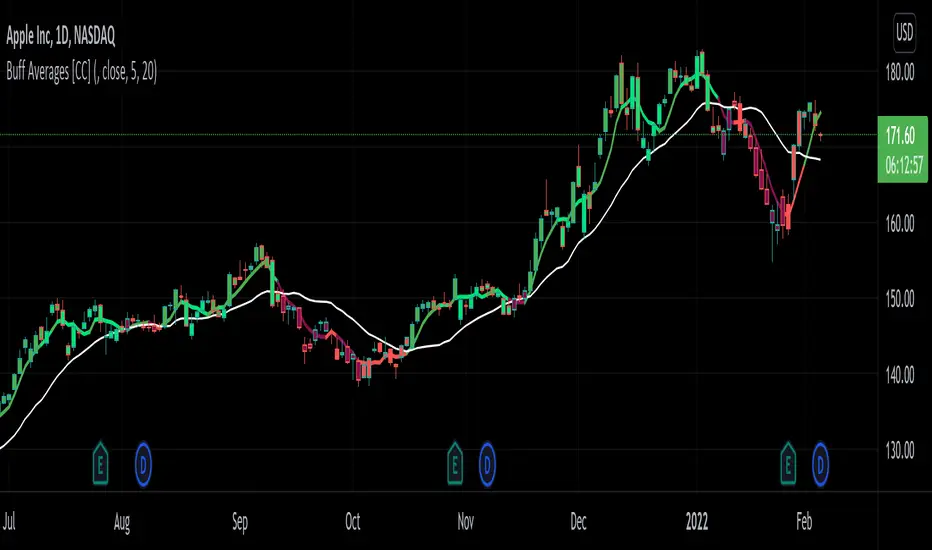
Buff Averages [CC]The Buff Averages were created by Buff Dormeier (Stocks and Commodities Feb 2001) and this is another hidden gem that is a combo of a volume weighted indicator and a moving average crossover system. It uses a special method to calculate the weighting based on volume. The colored line (fast buff) will follow the price closely and you use the other line to act as a trend confirmation. I have included strong buy and sell signals in addition to normal ones so strong signals are darker in color and normal signals are lighter in color. Buy when the line turns green and sell when it turns red.
Let me know if there are any other indicators or scripts you would like to see me publish!
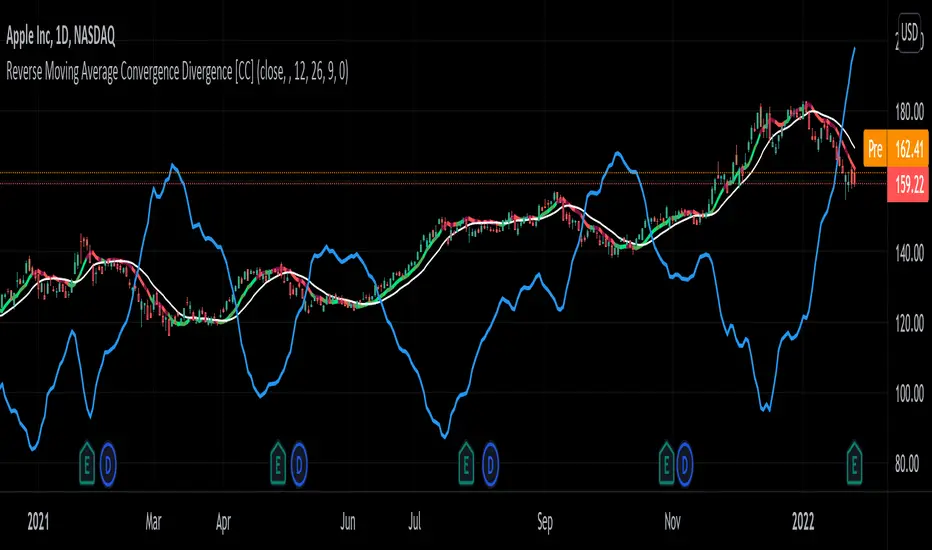
Reverse Moving Average Convergence Divergence [CC]The Reverse Macd was created by Johnny Dough (Stocks and Commodities Jan 2012) and this is another indicator in my ongoing series to find those hidden gems. This indicator works in a few very powerful ways. For example the blue line shows you what the current price would be if the macd was at the macd level that you choose. I set the default to 0 but feel free to change it if you want. This will give you short to medium term info by telling you if it is an uptrend when the price is above the blue line or vice versa. It also creates the reverse macd line and it's signal line by using information from the previous day to decompile the macd and show you the price that it would be at if the macd was at that level. It turns this into a new moving average that closely tracks price movements and with the two competing signals, gives you more than enough info to find the perfect entry and exit points. Like always I have included strong buy and sell signals in addition to normal ones so darker colors are strong signals and lighter colors are normal signals. Buy when the line is green and sell when it is red.
Let me know if there are any other scripts you would like to see me publish!
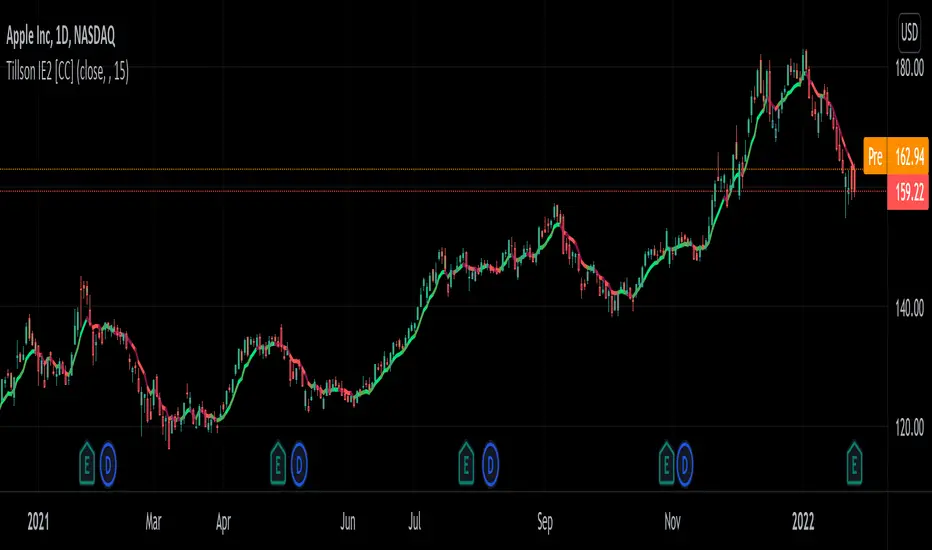
Tillson IE/2 [CC]The IE/2 was created by Tim Tillson (Stocks and Commodities Jan 1998) and this is a practically undiscovered gem because in that same article he goes on to to create the popular T3 moving average and the GDEma but practically no one seemed to notice the IE2 or maybe it is just my imagination. Anyway this indicator name is short for Integral of Linear Regression Slope + Endpoint Moving Average / 2 so you can why it was shortened to IE/2. Like the name implies this takes two variations of smoothing that complement each other and averages them together to in theory get the benefits of each. The EPMA is much noiser but follows the data more closely and the complete opposite for the ILRS so you can see the idea in action. Like all of my indicators I include strong buy and sell signals in addition to normal ones so strong signals are darker in color and normal signals are lighter in color. Buy when the line turns green and sell when it turns red.
Let me know if there are any other indicators or scripts you would like to see me publish!
Trend Analysis Index [CC]The Trend Analysis Index was created by Adam White and not to be confused with the Trend Analysis Indicator that I also published. This indicator operates under the same idea but using a completely different calculation to achieve similar results. The idea behind this indicator is for a combination of volatility and trend confirmation. If the indicator is above it's signal line then the stock is very volatile and vice versa. If the stock is currently trending as in above a chosen moving average for example and the indicator falls below the signal line then there is a pretty good chance in a trend reversal. The recommended buy and sell system to use is to pair this indicator with a moving average crossover system which I have included in the script. Buy when the indicator is above it's signal and the shorter moving average crosses above the longer moving average. For selling you would do the same and sell when the indicator is above it's signal and the shorter moving average crosses below the longer moving average. I have included strong buy and sell signals in addition to the normal ones so stronger signals are darker in color and normal signals are lighter in color.
Let me know what other indicators or scripts you would like to see me publish!

Adaptive Ehlers Deviation Scaled Moving Average (AEDSMA)AEDSMA INTRODUCTION
This indicator is a functional enhancement to “Ehlers Deviation Scaled Moving Average (EDSMA / DSMA)”. I’ve used Volume Breakout and Volatility for dynamic length adaption and further Slope too for trend evaluation.
EDSMA was originally developed by John F. Ehlers (Stocks & Commodities V. 36:8: The Deviation-Scaled Moving Average).
IDEA PLACEMENT
I’ve traded almost every kind of market with different volatility conditions using Moving Averages. It was too much of a hassle to select and use different MA length depending upon market trend. So, the journey started with adapting Moving Averages with another parameter and that’s how “MZ SAMA ” came into being where Slope was used to adapt Adaptive Moving Average with trend change. The problem was still pretty much the same as SAMA might not be effective on every market condition. Hence, I worked on Volume to adapt Moving Averages accordingly. I cane up with “MZ RVSI ” which I used in “MZ DVAMA ” to adapt dynamic length in Adaptive Moving Average and also used “MZ RVSI " alongside Slope as confirmation of trend changes.
Meanwhile, I started using DVAMA methodology on different types on Moving Averages that allow dynamic length for example Hull Moving Average, Linear Regression Curve, SMA, WMA, TMA and many more. All of my tested Mas showed too much flexibility because of volume based Adaptive length.
I came across a script of “Adaptive Hull Moving Average” which pretty much used the similar methodology as DVAMA but when I looked into its depth, its volume oscillator wasn’t working at all and only volatility based dynamic length was used. It was an interesting idea so, I decided to use Volume and Volatility alongside for better results but was nearly impossible to achieve what I wanted using only Hull Moving Average.
I had been using EDSMA in “MA MTF Cross Strategy” and “MZ SRSI Strategy V1.0” previously. It was the perfect choice when comparing to usage of slope on it. DSMA works perfectly as support and resistance as its Deviation Scaled. So, I tried using it to adapt dynamic length based on Volume and Volatility and I wasn’t disappointed. It worked like a charm when I adapted dynamic length between 50 and 255.
DYNAMIC LENGTH BENEFITS
Dynamic length adaption methodology works in a way of adapting Relatively Lower Length leading toward overfitting if trend is supported by Volume and Volatility . Similarly, adapting Relatively Higher Length leading toward underfitting if trend isn’t supported by Volume and Volatility .
Dynamic length adaption makes Moving Average to work better for both Bull and Bear-runs avoiding almost every fake break-in and breakouts. Hence, adaptive MA becomes more reliable for breakout trading.
MA would be more useful as it would adapt almost every chart based on its Volume and Volatility data.
DYNAMIC COLORS AND TREND CORRELATION
I’ve used dynamic coloring to identify trends with more detail which are as follows:
Lime Color: Strong Uptrend supported by Volume and Volatility or whatever you’ve chosen from both of them.
Fuchsia Color: Weak uptrend only supported by Slope or whatever you’ve selected.
Red Color: Strong Downtrend supported by Volume and Volatility or whatever you’ve chosen from both of them.
Grey Color: Weak Downtrend only supported by Slope or whatever you’ve selected.
Yellow Color: Possible reversal indication by Slope if enabled. Market is either sideways, consolidating or showing choppiness during that period.
SIGNALS
Green Circle: Market good for long with support of Volume and Volatility or whatever you’ve chosen from both of them.
Red Circle: Market good to short with support from Volume and Volatility or whatever you’ve chosen from both of them.
Yellow Cross: Market either touched top or bottom ATR band and can act as good TP or SL.
EDSMA EVELOPE/BANDS: I’ve included ATR based bands to the Adaptive EDSMA which act as good support/resistance despite from main Adaptive EDSMA Curve.
DEFAULT SETTINGS
I’ve set default Minimum length to 50 and Maximum length to 255 which I’ve found works best for almost all timeframes but you can change this delta to adapt your timeframe accordingly with more precision.
Dynamic length adoption is enabled based on both Volume and Volatility but only one or none of them can also be selected.
Trend signals are enabled based on Slope and Volume but Volatility can be enabled for more precise confirmations.
In “ RVSI ” settings TFS Volume Oscillator is set to default but others work good too especially Volume Zone Oscillator. For more details about Volume Breakout you can check “MZ RVSI Indicator".
ATR breakout is set to be positive if period 14 exceeds period 46 but can be changed if more adaption with volatility is required.
EDSMA super smoother filter length is set to 20 which can be increased to 50 or more for better smoothing but this will also change slope results accordingly.
EDSMA super smoother filter poles are set to 2 because found better results with 2 instead of 3.
FURTHER ENHANCEMENTS
So far, I’ve seen better results with Volume Breakout and Volatility but other parameters such as Linear Slope of Particular MA, MACD, “MZ SRSI ”, a Conditional Uptrend MA or simply KDJ can also be used for dynamic length adaption.
I haven't yet gotten used to pine script arrays so, defining and using conditional operators is pretty much lazy programming for me. Would be great redefining everything through truth matrix instead of using if-else conditions.

RVOL Relative Volume - IntradayHello All,
Relative Volume is one of the most important indicators and Traders should check it while trading/analyzing. it is used to identify whether the volume flows are increasing or decreasing. Relative volume measures current volume in relation to the “usual” volume for this time of the day. What is considered “usual"? For that, we have to use a historical baseline known as the average daily volume. That means how much volume a security does on a daily basis over a defined period. (This scripts runs on the time frames greater or equal 1 minute and less than 1 day)
The common definition for real-time relative volume is: Current volume for this time of day / Average volume for this time of day. It does not mean taking the volume (for example) from 10:30 am to 10:45 am and comparing it to what it does from 10:30 am to 10:45 am every day. What it truly means is to compare cumulative volumes. Therefore, this is the precise definition of real-time relative volume:
Current cumulative volume up to this time of day / Average cumulative volume up to this time of day
What should we understand while checking RVOL;
- Relative volume tell us if volume flows are increasing or decreasing
- A high relative volume tells us that there is increased trading activity in a security today
- Increased volume flows often accompany higher volatility i.e. a significant price move
Let see an example:
P.S. if you want to get more info about RVOL/Relative Volume then you can search it on the net. While developing the script this was used as reference, you can also check it for more info.
Enjoy!

Relative Volume Strength Index (MZ RVSI)INTRODUCTION
Volume always plays a role of key indication for price movements and momentum and I always found the same problem with all available volume oscillators and indicators which is that their data is always in compounded form that can’t be easily used in raw form as a parameter in many strategies.
This indicator uses raw volume data from one of following oscillators:
TFS Volume Oscillator
On Balance Volume
Klinger Volume Oscillator
Cumulative Volume Oscillator
Volume Zone Oscillator
Then this data goes through the following process of noise filtration:
Hull Moving Average of input data to reduce noise
Relative Strength Index of HMA
Hull Moving Average of RSI to reduce noise for finalized RVSI
ADDITIONAL FEATURES
Heiken-Ashi: Heiken-Ashi values are optional to use in calculations and I’ve set them to default as I found good results with them.
Slope for Trend Detection: Slope of finalized RVSI is calculated in order to check volume trend direction. Another additional feature of Volume breakouts is also added which is used in dynamic coloring of RVSI. Dynamic color indications are as follows.
Green Color:
Strong Volume Uptrend above volume breakout point
Fuchsia Color:
Weak Volume Uptrend below volume breakout point but slope supported
Red Color:
Strong Volume Downtrend below volume breakout point
Gray Color:
Weak Volume Downtrend above volume breakout point but slope supported
Yellow Color:
Possible trend reversal as slope is flat.
DEFAULTS SETTINGS
Volume length is 30 (Better for timeframes higher than 1H)
Hull Moving Average and RSI length is set to 14
ADDITIONAL APPLICATIONS
This indicator can be used as divergence detection tool for volume same way as RSI is used for price divergence. I’ll soon add divergence signals inside the code and this code can be used in multiple ways as volume breakout indication in strategies for better results.

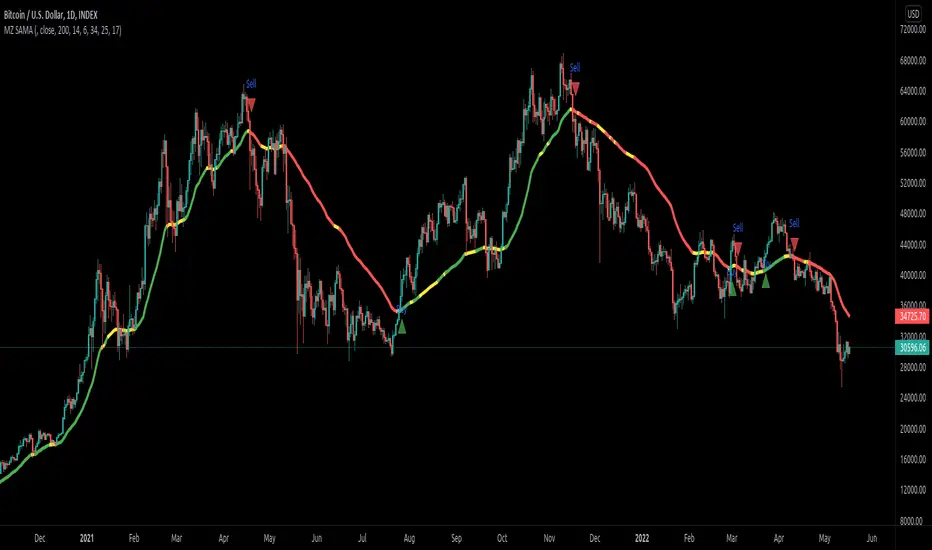
Slope Adaptive Moving Average (MZ SAMA)INTRODUCTION
This script is inspired from "Vitali Apirine (Stocks & Commodities V.36:5: Adaptive Moving Averages)" and a correction to Dynamic Volume Adaptive Moving Average (MZ DVAMA) . I have used slope filtering in order to adapt trends more precisely for better trades.
Slope adaption makes it better for adaptive moving average to detect trend health; making it easier to make decisions based on market strong price momentums, consolidations or breakouts. This isn’t possible with only using simply Adaptive Moving Averages .
Adaptive Moving Averages curve doesn’t change its length based on Slope but it uses slope adaptive color for trend strength detection.
TREND DETECTION
Green Color:
Strong Uptrend with good price momentum.
Red Color:
Strong Downtrend.
Yellow Color:
Market is either choppy, sideways or consolidating. Better to avoid taking new positions and if trade is running then its good to carry it on.
DEFAULTS SETTINGS
AMA length is 200 (Better for timeframes higher than 1H)
Minor length is 6
Major length is 14
Slope period is set to 34 with 25 of initial range. Consolidation is always below 17.
ALERTS
Buy/Sell Alerts will follow on when slope is out of consolidation/choppiness area. Best entry is at absolute alerts timing but other trades can be started midway based on trend condition.
ZigZag WavesHello All,
I am here with a new idea and script, " Zigzag Waves ". This indicator creates 3 Zigzags with different lengths, keeps the lengths of each zigzag wave and calculates/draws average waves for each zigzag. optionally it can reset the wave when zigzag direction changes and new highest/lowest found. And optionally it draws Exponential Moving Average(EMA) of the sum of waves. This idea is very new and at the moment there is no optimization for the Zigzag Periods. Maybe we altogether can improve the idea and find the best zigzag periods for different symbols and time frames.
Using the options You can play with the periods, add/remove EMA, set its color and reset the waves on new Highest/Lowest. As far as I see resetting the waves on new Highest/Lowest may bring better results.
if we enable "Reset the waves on new Highest/Lowest":
Using different periods and EMA length:
P.S. if you have ideas to improve this script, drop a comment under the script please.
Enjoy!

Gann FanHello All,
For long time I have been getting many requests about Gann Fan indicator. now we have linefill() function in Pine Language and I think it's right time to make Gann Fan Indicator. Many Thanks to Pine Team for adding many new features to the Pine Language!
How this indicator works:
- It calculates midline (1/1)
- By using midline it calculates other lines (1/2, 1/3, 1/4...etc)
- It calculates highest/lowest Pivot Points in last 280 bars.( by default it's 280 bars, you can change it and pivot period )
- It checks the location of highest/lowest Pivot Points
- After the calculation of the Gann Fan lines, it draws lines, puts Labels and paints the zones between the lines according to the colors set by the user
Long time ago I created a special algorithm for calculating the line with 45 degree and I used it for "1/1" line. Anybody who needs it can use this algorithm freely ;)
Options:
You can change following items;
- The colors
- Transparency. Possible values for transparency are from 0 (not transparent) to 100 (invisible)
- Line styles
- Loopback Period (by default it's 280)
- Pivot Period (by default it's 5)
- Enable/disable Labels
- Label location (by default it's 50
Tradingview Gann Fan page : The Gann Fan is a technical analysis tool created by WD Gann. The tool is comprised of 9 diagonal lines (extending indefinitely) designed to show different support and resistance levels on a chart. These angles -drawn from main tops and bottoms- divide time and price into proportionate parts and are often used to predict areas of support and resistance, key tops and bottoms and future price moves. Please note that the chart needs to be scaled properly to ensure the market has a square relationship....
Enjoy!

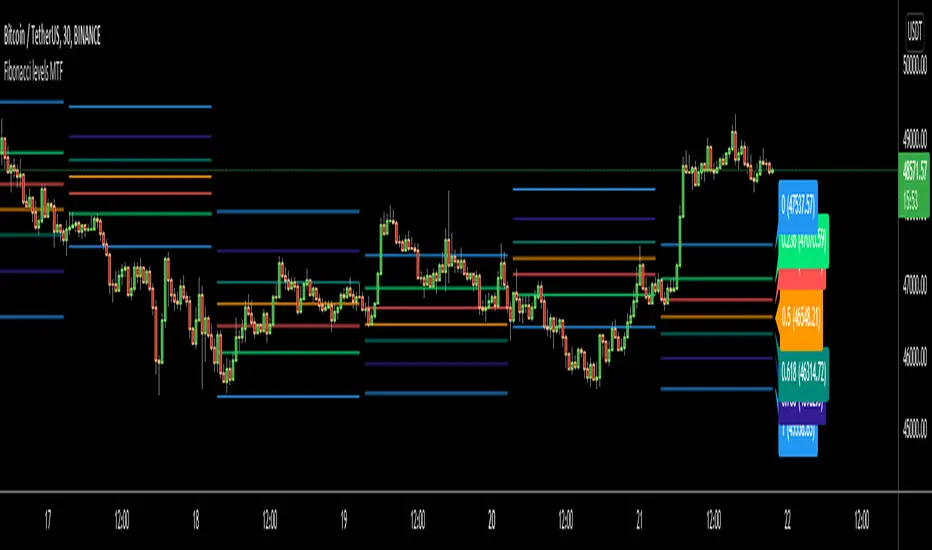
Fibonacci levels MTFHello All,
I got some requests for a script that shows Fibonacci Levels of Higher Time Frame Candles. so I made/published this script. I hope it would be useful for you.
Options:
You can set Higher Time Frame, by default it's 1 Day.
Optionally it can use Current or Last Candle of higher time frame to calculate/show its Fibonacci Levels.
It can show higher time frame candles at the background optionally. You can change its colors.
You can enable/disable/change each Fibonacci levels and their colors.
You can enable/disable Fibonacci Labels that is shown at the right ride and see only Fibonacci lines/levels
example, Fibonacci levels with higher time frame candles:
P.S. if you have ideas to improve this script, drop a comment under the script please
Enjoy!
Logarithmic Trend ChannelThis indicator automatically draws a regression channel plotted on logarithmic scale from the first quotation.
This model is useful for the long term series data (such as 10 or 20 years time span).
The Pearson correlation measures the strength of the linear relationship between two variables. It has a value between to 1, with a value of 0 meaning no correlation, and + 1 meaning a total positive correlation.
Logarithmic price scales are a type of scale used on a chart, plotted such that two equivalent price changes are represented by the same vertical changes on the scale.
They differ from linear price scales because they display percentage points and not dollar price increases for a stock.
Technical issues
*The user have to pan over the chart from the beginning to the end of the study range (such as 10 years of bars) so the pine script could generate those lines on the chart.
*If on the chart the number of bar is less than the lookback period, it won't generate any lines as well.

High-Low IndexHello All,
High-Low Index is a breadth indicator based on Record High Percent (RHP). RHP is based on new 52-week highs and new 52-week lows. RHP => 100 * (new highs) / (new highs + new lows). High-Low Index is a 10-day Simple Moving Average of the RHP, which makes it a smoothed version of RHP. You can find many articles about High-Low Index on the net.
High-Low Index above 50 indicates that there are more new highs than new lows, and considered as Bullish.
High-Low Index below 50 indicates that there are more new lows than new highs, and considered as Bearish.
High-Low Index = 0 indicates there is no new highs (0% new highs).
High-Low Index = 100 indicates that there is at least 1 new high and no new lows.
and High-Low Index = 50 indicates that new highs and new lows is equal.
by default 40 cryptos are used in the script and shows High-Low Index for these cryptos. but you can change them as you wish. for example you can set all of them as stocks and see High-Low Index for these stocks.
You can set " Time frame " and the " Length " using the options. For example; if you set " Time frame " = 1 Week and the " Length " = 52 then it finds High-Low Index for 52weeks .
or another example; if you set " Time frame " = 1 Day and the " Length " = 22 the High-Low Indexn it finds High-Low Index for 22days.
You can enable/disable Record High Percent or Simple Moving Average of High-Low Index. Some traders use High-Low Index with its SMA, for example; High-Low Index generates a buy signal when it crosses above its moving average, and a sell signal when it crosses below its moving average.
Optionally you can see the securities in a table on the left bottom, you can change table size by usşng the options.
In the Table, for each security/cell;
=> if background is green then it has New High
=> if background is red then it has New Low
=> if background is gray then no New High, no New Low
=> if background is back then Data is not available for the security
As you can see in the screenshot below, the securities were changed and stocks are used instead of cryptos, so it calculates & shows High-Low Index for these stocks.
you can also find explanation in this screenshot:
Enjoy!

Trendalix EntriesThis script is made to simplify the analysis of trends. It changes the mas based on whether you're looking at stocks or crypto. As these 2 markets currently move differently, they need a slightly different approach.
Crypto trends:
Can move much faster than stocks. Ideally the price should be bouncing above the williams alligators (about the 20-30 MAs).
Stocks:
These swing more than crypto so you need to get deep into these swing to be buying at the bottom of a move. The MAs are much larger, between the 50ma and 400ma. It's much more important here that the slower MAs are strong, i.e 200ma is above the 400ma, than it is that the faster MAs are okay.
For stocks an entry and stop line is drawn. These are only visible when the market is sufficiently in a pullback.

Support Resistance InteractiveHello All,
Using this "Support Resistance Interactive" script you can set the Support/Resistance levels interactively by clicking on the chart. Using the SR levels you set, the indicator creates Support Resistance zones. The width of the zones are calculated by using Threshold option and Threshold is the percent of the distance between Highest/Lowest levels in last 300 bars. if you set Threshold = 1 then it means 1% of the distance between Highest/Lowest levels. You can change SR levels by moving the level up/down by using your mouse anytime you want.
Now lets see it step by step;
After you added the indicator it will ask 5 Support/Resistance Levels and when you click any point then it's kept as S/R level and it asks another SR levels. if you want to use only 3 SR levels then last 2 SR levels are not important and you can click anywhere on the chart;
After you set all SR levels, it will ask "Number of Support/Resistance" . if you want to activate first 3 SR lines then set it 3. by default it's 5. when you set it click "Apply" and see the SR zones. that's it.
You can enable/disable alerts and set frequency, then create alerts. as it's interactive tool, the SR levels you set are specific for the current/active symbol. if you open another symbol then you better delete the indicator and add it again
Three Alerts exist in the script: Support Broken, Resistance Broken and Price in SR zone . you can enable/disable the alerts as you wish and you can set frequency for each one as "Once Per Bar" or "Once Per Bar Close"
by default Green/Red/Gray colors are used but You can change the colors using the options. according to the Price moves, SR zone colors are changed automatically.
when we have "Reset" feature to run the script interactively (like we added it for first time) I can update the script, then you will not need to delete/re-add each time you changed the symbol :)
In this example "Threshold" is 2 and "Number of Support/Resistance" is 4.
in this example "Threshold" is 0 and "Number of Support/Resistance" is 5.
Last example; Labels are shown for each zone, you can set location of the labels. SR order and Upper/lower band of each zone are shown in each label.
Enjoy!

M.Right Awesome RSI+ (cc)Hey Traders,
Tonight I figured I'd release a special indicator that I've had in the works for years and finally was able to piece it together using pine. It's an extremely accurate take on the RSI. I plan to continue to refine the indicator and add more features, but as it is this is still one you can make a lot of money with.
(((((Please note: all circles and arrows in the chart above are drawn for illustration. Below is a chart showing regular session)))))
This indicator will act similarly to a regular RSI (Relative Strength Indicator) in that there are Oversold and Overbought levels, but also volatility bands around it to allow for more accurate signals whilst moving the Oversold (OS) and Overbought (OB) levels further apart ( less false OB/OS signals ). As shown in the chart above, it's able to detect some pretty big moves with both speed and accuracy .
Most of you are familiar with and use an RSI indicator so I will keep this description as brief as possible: The Relative Strength Index (RSI), developed by the legendary J. Welles Wilder, is a momentum oscillator that measures the speed and change of price movements; it oscillates between 0 - 100, with levels set as Overbought and Oversold. These levels are where a trader make look for a reversal, however they must keep in mind in an uptrend or bull market, the RSI tends to remain in the 40 - 90 range; 40 - 50 zone often will act as support. More advanced traders will also look for divergences between the price and the oscillator (i.e. price trending upward while oscillator trending downward). As far as oscillators go, the RSI is one of the most frequently used, by both advanced and beginner traders alike.
Works great on multiple timeframes. It may not catch every rally, but it will catch most --even on smaller timeframes (i.e. 5 minutes in image below).
As with all of my scripts I like to make them customizable:
You can change the up and down colors on the RSI ribbons and the color and style (dotted shown) of Overbought / Oversold lines. In future versions, I will add more color customizations and additions.
Can toggle 1 or both of the 2 highlight signals off to make it a little more plain.
Lot's of ways to make it look the way you'd like it to.
--The alerts include both the super accurate Bullish and Bearish signals shown with the background highlights. They are pre-filled so it will automatically display the price and time that the alert went off for you.
If I missed anything or you have a question, please let me know!
Cheers,
Mike
Please note: I have made this indicator invite only, send me a DM if you're interested in trying it out.

Higher Time Frame Chart OverlayHello All,
This script gets OHLC values from any security and Higher/Same time frame you set, then creates the chart including last 10 candles. it shows Symbol name, Time Frame, Highest/Lowest level of last 10 candles and Close Price at the right side of the chart as well. Closing price text color changes by the real-time candle of the related symbol and time frame. The all this was made using the Tables in Pine and the chart location doesn't change even if you change the size of main chart window.
Almost everything can be change as you want. You can change/set:
- Colors of Body and Top/Bottom Wicks separately
- The Height of each Cell
- The Width of Body and Wicks
- The Background and Frame color
- Enable/disable Status Panel (if you disable Status Panel then only candle chart is shown)
- Location of Status Panel
- Text color and Text size
- The Background color of Status Panel
Some examples:
The info shown in Status Panel:
You can change The Height of each Cell and The Width of Body and Wicks
You can change colors:
You can change location of the chart:
If you add the script more than once then you can see the charts for different symbols and time frames: (This may slow down your chart)
If you right-click on the script and choose "Visual Order" => "Bring to front" then it will be better visually:
P.S. Using this script may slow down your chart, especially if you add it more than once
Enjoy!

HAP Auto Trend Line [PRO]Hello Traders!
The trend line is among the most important tools used by technical analysts. Instead of looking at past business performance or other fundamentals, technical analysts look for trends in price action. A trend line helps technical analysts determine the current direction in market prices. Technical analysts believe the trend is your friend, and identifying this trend is the first step in the process of making a good trade, and it can tell Support/resistance is very good.
But when drawing Trend Lines, sometimes we're not sure where to start. From where is the starting point? And sometimes it can be drawn multiple lines with different support/resistance lines over time. This itself can be confusing, so I tried to create a tool that allows it to draw lines automatically. According to price movement.
Let's take a look at the variables you need to understand from our indicators.
For this indicator it works in two main parts:
Section of Trend Line
Trend Reversal section
Therefore, these two parts have separate functions. To be used as a component for easier decision-making.
Trend Line, as I said before, what it is. Next is Trend Reversal. I will simply say it is. A period of time when the candle tries to pump and dump. This will help point out the potential price reversal. And if there is a trend line area, it is an interesting point to consider. To identify possibilities.
Some variables from the settings page
Number of Bars to Check : It is the number of past candlesticks to consider. To identify the start of the Trend Line, if it meets the condition, it will automatically draw the Trend Line for you.
Trend Line Depth : It is the frequency. Of identifying the starting point Trend Line. If the value is large, it will find a low Trend Line, and if it is low, it will find more Trend Line. This is flexible. So you have to try it yourself. On demand.
Overview
You can turn it on or off. Support/resistance position either.
Select Emoji Support/resistance. Freely
Line style you want
your favorite color
customizable line intensity
the script is fast enough to run on 1sec chart:
fun !

Indicators OverlayHello All,
This script shows the indicators in separate windows on the main chart. Included indicators are RSI, CCI, OBV, Stochastic, Money Flow Index, Average True Range and Chande Momentum Oscillator. indicator windows are located at the top or bottom of the chart according to last moves of the Closing price. Different colors are used for each indicator. Horizontal levels are shown as dashed line and label as well.
Using the options;
You can enable/disable the indicators you want to see or not
You can change source and length for each indicator
You can set window length. using this length indicator windows are located on the chart
After you added this indicator to your chart I recommend: right click on any of the indicator windows => "Visual Order" => "Bring to front" as seen screenshot below:
in this example only 3 indicators enabled and period is set as 80:
indicator windows moves to the top or bottom of the chart according to the close price:
P.S. if you want to see any other indicator in the options then leave a comment under the indicator ;)
Enjoy!
