ADR% / ATR / LoD dist. Table - V2ADR% / ATR / LoD Distance Table (V2) + ATR Range Lines is a simple “daily volatility dashboard” that helps you quickly judge how extended a stock is during the day and where “normal” daily movement zones sit relative to price.
It’s designed to help you answer:
“Has this stock already made most of its usual daily move?”
“Am I chasing too late?”
“Where are typical +ATR / −ATR stretch and pullback zones?”
What you’ll see
ADR% (Average Daily Range %)
Shows the stock’s typical daily travel (low → high) as a percentage.
Example: ADR% = 4% means the stock often swings ~4% in a normal day.
ATR (Average True Range)
Shows the stock’s typical daily movement in price units ($ / points).
Example: ATR = 2.50 means it often moves about $2.50 per day.
LoD dist. (Low of Day distance)
Shows how far price is from today’s Low of Day, measured relative to ATR (as a %).
Higher % = more extended away from the day’s low.
Optional: ATR Range Lines (added in this version)
You can enable two guide lines that extend to the right:
ATR Up Line = Price + ATR
ATR Down Line = Price − ATR
These act like volatility guardrails to visualize “typical daily stretch” and “typical pullback” zones.
ATR “Live vs Locked” option (important)
Lock ATR to last completed day (no intraday updates):
ON (Locked): Uses the last completed daily ATR (yesterday’s finished value).
✅ ATR stays constant all day while the market is live.
OFF (Live): ATR can update intraday as today’s daily candle expands.
✅ ATR may change during the session.
Either way, ATR is still based on your chosen ATR Length (lookback period). Locking simply prevents the ATR from drifting intraday.
How to use it (Kullamägi-style principle)
Kristjan Kullamägi’s momentum style emphasizes pressing strength when conditions are right, but also respecting extension and risk/reward. This tool helps you quantify that:
If ADR%/ATR suggests the stock already moved near its usual daily range, chasing can be lower reward.
The ATR lines help you visualize when price is in a “normal stretch zone” vs a better risk area.
Locking ATR gives you stable intraday reference levels for cleaner execution.
Tips
Use ADR% to understand whether there’s likely “room” left in today’s move.
Use LoD dist. to quickly gauge if price is already far from the day’s low (extended).
Use ATR Up/Down Lines as a simple volatility framework for entries, add-ons, and risk planning.
Keep Lock ATR ON if you prefer stable levels throughout the session.
Credits
Original indicator concept & script: ArmerSchlucker
ADR% formula credit: MikeC / TheScrutiniser and GlinckEastwoot
Modifications (V2): TradersPod
Added optional ATR Up/Down lines extending to the right
Added “Lock ATR to last completed day” option for stable intraday ATR reference
Kept the original logic and purpose intact
VCP

Zig Zag ++ SG (Premium)🔥 Zig Zag ++ SG
Professional Market Structure & Cycle Analyzer
Zig Zag ++ SG is an advanced, research-grade market structure indicator built on top of a refined ZigZag engine, designed for traders and investors who want to understand price cycles, not chase candles.
This is not a buy-sell arrow tool.
It is a decision-support system used to analyze trend strength, exhaustion, pullback depth, and cycle behavior across any market and timeframe.
🧠 What Makes Zig Zag ++ SG Different?
Most ZigZag indicators only draw lines.
Zig Zag ++ SG answers the real questions:
Is the trend getting stronger or weaker?
Are higher highs still meaningful?
How deep are pullbacks in percentage terms?
Which stocks recover fast vs stay weak?
Is this accumulation, distribution, or reversal?
It does this by combining:
Market Structure (HH / HL / LH / LL)
Consecutive structure counting
Gain & fall percentage per swing
Clean visual logic (no repaint confusion)
📌 Core Features
✅ 1. Automatic Market Structure Detection
Labels every major swing as:
HH – Higher High
HL – Higher Low
LH – Lower High
LL – Lower Low
This instantly shows whether the market is:
Trending
Consolidating
Distributing
Reversing
✅ 2. Consecutive Structure Count (ON by default)
Each structure type is counted sequentially:
HH (1), HH (2), HH (3)…
HL (1), HL (2)…
This reveals:
Trend maturity
Exhaustion zones
Early breakdown warnings
Example:
HH (4) = trend may be overextended
HL (3) = healthy trend continuation
✅ 3. Gain & Fall % on Every Swing (ON by default)
Every HH, HL, LH, LL shows:
Exact % move from the previous pivot
This allows you to:
Compare pullback depth across stocks
Identify leaders (shallow HLs)
Spot weak stocks (deep HLs / LHs)
Study cycle symmetry
Example label:
HL (2)
-6.4%
✅ 4. Clean, Readable Visual Design
🟩 Green labels → White text
🟥 Red labels → High-contrast white text
Optional background trend shading (OFF by default)
Works perfectly in dark & light mode
Designed for long chart study sessions, not flashy screenshots.
✅ 5. Safe Repaint Logic (Transparent by Design)
Uses ZigZag logic intentionally
No fake “non-repainting” claims
Ideal for analysis, research & planning
What you see is structurally correct
This indicator is for thinking traders, not signal chasers.
⚙️ Best Settings (Recommended)
🔹 Intraday Trading
Timeframe: 5m / 15m
Depth: 8–10
Deviation: 3–5
Backstep: 2
🔹 Swing Trading (Most Popular)
Timeframe: Daily
Depth: 12–15
Deviation: 5
Backstep: 2
🔹 Long-Term / Investing
Timeframe: Weekly
Depth: 15–20
Deviation: 5–8
Backstep: 3
💡 Tip:
Lower depth = more swings
Higher depth = cleaner, major cycles
📈 How to Use Zig Zag ++ SG (Practically)
🔹 Trend Strength
HH (3+) + HL (2–3)
→ Strong, healthy trend
🔹 Exhaustion Warning
HH (4+)
→ Risk of distribution or slowdown
🔹 Pullback Quality
HL −3% to −7%
→ Strong stock
HL −12% to −20%
→ Weak hands / fragile trend
🔹 Reversal Confirmation
LH followed by LL (2+)
→ Trend change likely
🧪 Who Is This Indicator For?
✅ Swing traders
✅ Positional traders
✅ Long-term investors
✅ Market structure students
✅ Stock researchers
✅ Anyone tired of noisy indicators
❌ Not for:
People wanting instant buy/sell arrows
Scalpers chasing 1-minute signals
“Magic indicator” seekers
💎 Why This Is Worth Purchasing
Built with Pine Script v6 best practices
Solves real market questions
Helps avoid:
Buying late
Selling early
Holding weak stocks too long
Encourages process-driven trading
One-time learning tool you’ll use for years
Most traders lose money not because of entries —
but because they misread structure and cycles.
Zig Zag ++ SG fixes that.

Minervini Ultimate +VCPMinervini Ultimate Suite (SEPA Dashboard)
This indicator implements Mark Minervini's "Trend Template" criteria combined with a Volatility Contraction Pattern (VCP) detector and a custom Relative Strength rating. It is designed to help traders visualize the technical health of a stock based on stage analysis concepts.
This indicator serves as a complete Control System (Dashboard) for Mark Minervini's SEPA trading strategy. Instead of manually checking five different metrics on every chart, this indicator performs the mathematical calculations and presents the "bottom line" in a single, organized table.
1. What This Indicator Does
The goal is to ensure you never enter a trade blindly. It verifies the stock against Minervini's strict requirements:
Trend: Is the stock in a healthy Stage 2 Uptrend?
Relative Strength: Is it stronger than the general market?
Buy Risk: Is it the right time to buy, or is the price extended?
Pressure: Are institutions accumulating or distributing?
VCP: Is there a breakout opportunity (volatility contraction) right now?
2. Key Benefits
Time-Saving: Instead of drawing lines and calculating percentages manually, you get immediate visual feedback (Green/Red).
Discipline: The indicator will flag "Extended" (Red) if you attempt to buy a stock that has run up too much, saving you from late entries and unnecessary losses.
Precision Timing: The VCP feature (Blue Dots) helps you identify the "calm before the storm"—the exact moment volatility contracts, which often precedes a major breakout.
3. Indicator Parameters & Features
A. Minervini Pressure (Buying vs. Selling)
What it checks: Money flow over the last 20 days.
Calculation: Sums up volume on "Up Days" (Green) versus volume on "Down Days" (Red).
Meaning:
🟢 Buying: More money is entering than leaving. A sign of institutional accumulation.
🔴 Selling: Selling pressure dominates. The price may be rising, but without strong volume backing.
B. Buy Risk (Price Extension)
What it checks: The distance of the current price from the 50-Day Moving Average. Minervini strictly warns against "chasing" stocks.
Signals:
🟢 Low Risk: Price is within 0% – 15% of the 50MA. This is the ideal "Buy Zone".
🟡 Caution: Price is 15% – 25% away. Buy with increased caution.
🔴 Extended: Price is >25% from the MA. Do not buy. The probability of a pullback is high.
⚪ Broken: Price is below the 50MA. The short-term trend is damaged.
C. TPR - Trend Template (Trend Power Rating)
What it checks: Is the stock in a Stage 2 Uptrend?
Strict Rules (All must be true for a PASS):
Price > 50MA > 150MA > 200MA.
The 200MA is trending UP (positive slope).
Price is near the 52-Week High (within 25%).
Price is above the 52-Week Low (at least 25%).
Meaning:
🟢 PASSED: Technically healthy and ready to move.
🔴 FAILED: The trend structure is broken (e.g., MAs are entangled).
D. RPR Score (Relative Performance Rating)
What it checks: How strong the stock is compared to the general market (S&P 500 / SPY).
Calculation: Weighted performance over 3, 6, 9, and 12 months vs. the SPY. The score ranges from 1 to 99.
Meaning:
🟢 80-99: Market Leader. These are the stocks Minervini targets.
🟡 70-80: Good, but not elite.
⚪ Below 70: Laggard (weaker than the market).
E. VCP Action (Volatility Contraction Pattern)
What it checks: Monitors price tightness. It calculates the range between the highest close and lowest close over the last 5 days.
Meaning:
🔵 SQUEEZE (Blue Text + Blue Dot on Chart): The price range has contracted to less than 2.5%.
Why it matters: When a stock stops moving wildly and trades in a tight range ("Flat Line"), it indicates supply has dried up. A high-volume breakout often follows immediately.

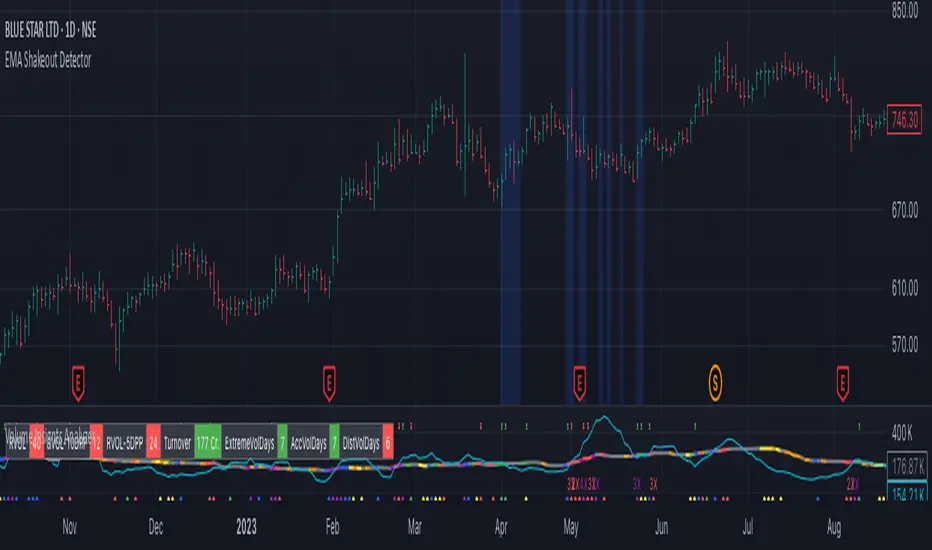
EMA Shakeout DetectorEMA Shakeout & Reclaim Zones
Description:
This Pine Script helps traders quickly identify potential shakeout entries based on price action and volume dynamics. Shakeouts often signal strong accumulation, where institutions drive the stock below a key moving average before reclaiming it, creating an opportunity for traders to enter at favorable prices.
How It Works:
1. Volume Surge Filtering:
a. Computes the 51-day Simple Moving Average (SMA) of volume.
b. Identifies days where volume surged 2x above the 51-day average.
c. Filters stocks that had at least two such high-volume days in the last 21 trading days (configurable).
2. Stock Selection Criteria:
a. The stock must be within 25% of its 52-week high.
b. It should have rallied at least 30% from its 52-week low.
Shakeout Conditions:
1. The stock must be trading above the 51-day EMA before the shakeout.
2. A sudden price drop of more than 10% occurs, pushing the stock below the 51-day EMA.
3. A key index (e.g., Nifty 50, S&P 500) must be trading above its 10-day EMA, ensuring overall market strength.
Visualization:
Shakeout zones are highlighted in blue, making it easier to spot potential accumulation areas and study price & volume action in more detail.
This script is ideal for traders looking to identify institutional shakeouts and gain an edge by recognizing high-probability reversal setups.
ADR Checker - Breakouts📈 ADR Checker – Breakouts
Gain the edge by knowing when a stock has already made its move.
🚀 What It Does:
The ADR Checker - Breakouts is a powerful yet simple visual tool that helps traders instantly assess whether a stock has already exceeded its Average Daily Range (ADR) for the day — a critical piece of information for momentum traders, swing traders, and especially those following breakout, VCP, or CANSLIM strategies.
Using a customizable on-screen table that always stays in view (regardless of zoom or chart scaling), this script shows:
✅ Average ADR% – 20-day average range, calculated in %.
📊 Today’s Move – how much the stock has moved today.
🔥 % of Avg ADR – today's move relative to its historical average, with live color feedback:
🟥 Over 100% (Overextended – danger!)
🟧 70-100% (Caution zone)
🟩 Below 70% (Room to move)
💡 Why It Matters:
One of the most overlooked mistakes by breakout traders is entering a trade after the move has already happened. If a stock has already moved more than its typical daily range, the odds of further continuation sharply decrease, while the risk of pullback or chop increases.
With this tool, you can:
🚫 Avoid chasing extended breakouts
🎯 Time entries before the real move
⚠️ Quickly assess risk/reward potential intraday
🧠 Example Use Case:
Imagine you're watching a classic VCP setup or flat base breakout. The stock breaks out on volume—but when you check this indicator, you see:
Today’s Move: 7.2%
Avg ADR: 5.3%
% of ADR: 135% 🟥
This tells you the stock is already well beyond its average daily range. While it may continue higher, odds now favor a consolidation, shakeout, or pullback. This is your cue to wait for a better entry or pass entirely.
On the flip side, if the breakout just started and the % of ADR is still under 50%, you have confirmation that there’s room to run — giving you more confidence to enter early.
⚙️ Fully Customizable:
Choose position on screen (top/bottom left/right)
Customize text color, background, and size
🔧 Install This Tool and:
✅ Stop chasing extended moves
✅ Add discipline to your entries
✅ Improve your breakout win rate
Perfect for VCP, CANSLIM, and BREAKOUT traders who want a clean, edge-enhancing visual guide.

Earning, Sales, and PriceThis Pine Script indicator is designed to visualize and analyze the growth of Earnings Per Share (EPS) and Sales for a given stock over specified time periods. With a user-friendly interface, it allows traders and investors to monitor key financial metrics, helping them make informed decisions based on company performance.
The script presents earnings, sales, and price growth in a clear tabular format directly on the price chart. It features two distinct tables: one for annual data and another for quarterly metrics. For each financial metric, the script calculates and displays growth figures by comparing the current results with either the previous quarter's numbers or the previous year's figures. Additionally, it showcases the stock price along with the corresponding growth between these two data points, providing a comprehensive view of the stock's performance over time.
How to Use:
Typically, growth stocks will rally for a few quarters. However, after significant rallies, the stock needs rest. During this period, the stock will either consolidate or slide down slowly to take support at the key moving average. Importantly, during this time, sales and earnings may continue to grow while the stock is still consolidating.
Typically, after the stock consolidates significantly—even when sales and earnings numbers are increasing—the stock will finally start the next leg of the rally just before the next earnings date or immediately after the earnings report.
For this purpose, the script shows the EPS and sales growth. Additionally, the script displays the price when the previous earnings were declared along with the price growth. This data can be used to find patterns in the stock's behavior. Utilize this indicator to analyze growth patterns and make informed trading decisions based on historical performance and upcoming earnings expectations.
Key Metrics Analyzed:
Earnings Per Share (EPS): Monitors the diluted earnings per share to evaluate company profitability.
Total Revenue: Analyzes sales performance, providing insights into overall revenue generation.
Price Growth: Tracks changes in stock price alongside EPS and sales for comprehensive performance assessment.
Usage:
Ideal for investors and traders looking to evaluate company growth potential and make data-driven decisions.
Use in conjunction with other technical analysis tools for a holistic approach to stock analysis.

Swing Trend AnalysisIntroducing the Swing Trend Analyzer: A Powerful Tool for Swing and Positional Trading
The Swing Trend Analyzer is a cutting-edge indicator designed to enhance your swing and positional trading by providing precise entry points based on volatility contraction patterns and other key technical signals. This versatile tool is packed with features that cater to traders of all timeframes, offering flexibility, clarity, and actionable insights.
Key Features:
1. Adaptive Moving Averages:
The Swing Trend Analyzer offers multiple moving averages tailored to the timeframe you are trading on. On the daily chart, you can select up to four different moving average lengths, while all other timeframes provide three moving averages. This flexibility allows you to fine-tune your analysis according to your trading strategy. Disabling a moving average is as simple as setting its value to zero, making it easy to customize the indicator to your needs.
2. Dynamic Moving Average Colors Based on Relative Strength:
This feature allows you to compare the performance of the current ticker against a major index or any symbol of your choice. The moving average will change color based on whether the ticker is outperforming or underperforming the selected index over the chosen period. For example, on a daily chart, if the 21-day moving average turns blue, it indicates that the ticker has outperformed the selected index over the last 21 days. This visual cue helps you quickly identify relative strength, a key factor in successful swing trading.
3. Visual Identification of Price Contractions:
The Swing Trend Analyzer changes the color of price bars to white (on a dark theme) or black (on a light theme) when a contraction in price is detected. Price contractions are highlighted when either of the following conditions is met: a) the current bar is an inside bar, or b) the price range of the current bar is less than the 14-period Average Daily Range (ADR). This feature makes it easier to spot price contractions across all timeframes, which is crucial for timing entries in swing trading.
4. Overhead Supply Detection with Automated Resistance Lines:
The indicator intelligently detects the presence of overhead supply and draws a single resistance line to avoid clutter on the chart. As price breaches the resistance line, the old line is automatically deleted, and a new resistance line is drawn at the appropriate level. This helps you focus on the most relevant resistance levels, reducing noise and improving decision-making.
5. Buyable Gap Up Marker: The indicator highlights bars in blue when a candle opens with a gap that remains unfilled. These bars are potential Buyable Gap Up (BGU) candidates, signaling opportunities for long-side entries.
6. Comprehensive Swing Trading Information Table:
The indicator includes a detailed table that provides essential data for swing trading:
a. Sector and Industry Information: Understand the sector and industry of the ticker to identify stocks within strong sectors.
b. Key Moving Averages Distances (10MA, 21MA, 50MA, 200MA): Quickly assess how far the current price is from key moving averages. The color coding indicates whether the price is near or far from these averages, offering vital visual cues.
c. Price Range Analysis: Compare the current bar's price range with the previous bar's range to spot contraction patterns.
d. ADR (20, 10, 5): Displays the Average Daily Range over the last 20, 10, and 5 periods, crucial for identifying contraction patterns. On the weekly chart, the ADR continues to provide daily chart information.
e. 52-Week High/Low Data: Shows how close the stock is to its 52-week high or low, with color coding to highlight proximity, aiding in the identification of potential breakout or breakdown candidates.
f. 3-Month Price Gain: See the price gain over the last three months, which helps identify stocks with recent momentum.
7. Pocket Pivot Detection with Visual Markers:
Pocket pivots are a powerful bullish signal, especially relevant for swing trading. Pocket pivots are crucial for swing trading and are effective across all timeframes. The indicator marks pocket pivots with circular markers below the price bar:
a. 10-Day Pocket Pivot: Identified when the volume exceeds the maximum selling volume of the last 10 days. These are marked with a blue circle.
b. 5-Day Pocket Pivot: Identified when the volume exceeds the maximum selling volume of the last 5 days. These are marked with a green circle.
The Swing Trend Analyzer is designed to provide traders with the tools they need to succeed in swing and positional trading. Whether you're looking for precise entry points, analyzing relative strength, or identifying key price contractions, this indicator has you covered. Experience the power of advanced technical analysis with the Swing Trend Analyzer and take your trading to the next level.

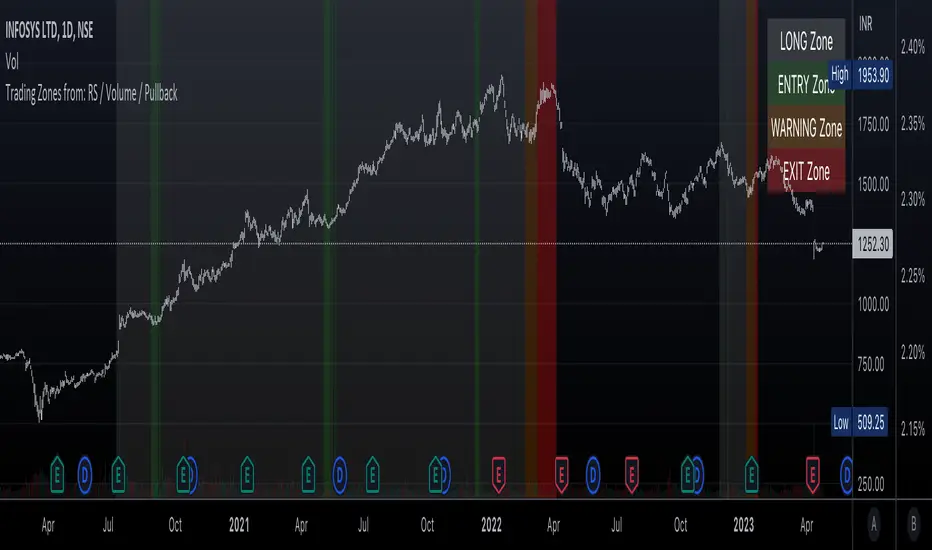
Trading Zones based on RS / Volume / PullbackThis is an Indicator which identifies different Trading Zones on the chart.
This should be Primarily used for Long Trades.
Trading Zones: and the Reasoning behind them
Long Zone -> One can do a Potential Entry (Buy) when this Zone is identified, but one could also wait for 'Entry Zone' (explained next) for a better Risk/Reward Trade.
Long Zones are identified with the help of Relative Strength and by an Intermediate Top in price.
Entry Zone -> This can be a better Risk/Reward zone to enter positions within the Long Zone.
Entry Zone is identified by a Pullback in Price & Volume contraction after the Long Zone is activated
Warning Zone -> One needs to be careful in this zone, no need to panic, Script will now try to find an Exit when Price Retraces towards Highs.
Warning Zone identifies weakness in the Price using Relative Strength of the current Stock (w.r.t. the Reference Symbol configured) and the severity of Pullback in Price.
Exit Zone -> are found only after transitioning to Warning Zone, this is a Zone which helps in minimising losses after a trade has gone into losses. Exit Zone is identified by making sure a local peak forms in Warning Zone. However, there are instances when Exit Zone detection can get prolonged when a local price peak is not formed soon enough. So one needs to be careful and use other strategies for exit.
------------------------------------------------------------------------------------
What is different in this Script:
The Script uses Relative Strength in combination with Pullback in Price from Highs in a Novel way.
Over-trading is avoided by ignoring Sideways price movements, using Relative Strength.
Only Trending Upward movement is detected and traded.
How to use this Indicator:
Use these 'Trading Zones' only as a reference so it can minimise your time in screening stocks.
Preferred Settings for using the Indicator:
Stick to 1-Day candles
Keep Relative Symbol as "Nifty" for Indian Stocks.
For US stocks, we can use "SPX" as the Relative Symbol.
//----------------
FEW EXAMPLES:
//----------------
ASIANPAINT
TATAMOTORS
TITAN
ITC
DIVISLAB
MARUTI
---------------------------------------------
Feedback is welcome.
Pivot Pattern Boundaries [cajole]
This script automatically detects horizontal support / resistance levels based on user-programmable criteria.
For example, you can detect boundaries with >3 touches within 200 days, allowing a tolerance of 1/4*ATR.
"Touches" are defined from pivots on the chart. The best way to search for larger/smaller patterns is to increase/decrease the pivot size.*
Future versions will allow "exceptions (i.e. keep drawing the horizontal line even if it is breached once or twice).
*TradingView's Pine script defines a Pivot as the highest point in a group. So, entering "2" means that a day's high needs to be above 2 days before and after (xxYxx) to be considered a high pivot.
This script can be an aid in drawing multiple patterns with horizontal boundaries (rectangles, triangles, head and shoulders, cup & handles, VCPs). I have intentionally avoided trying to code detection of the "other side" of these patterns, as that is where the craft of charting becomes an art.
