RVOL Relative Volume - IntradayHello All,
Relative Volume is one of the most important indicators and Traders should check it while trading/analyzing. it is used to identify whether the volume flows are increasing or decreasing. Relative volume measures current volume in relation to the “usual” volume for this time of the day. What is considered “usual"? For that, we have to use a historical baseline known as the average daily volume. That means how much volume a security does on a daily basis over a defined period. (This scripts runs on the time frames greater or equal 1 minute and less than 1 day)
The common definition for real-time relative volume is: Current volume for this time of day / Average volume for this time of day. It does not mean taking the volume (for example) from 10:30 am to 10:45 am and comparing it to what it does from 10:30 am to 10:45 am every day. What it truly means is to compare cumulative volumes. Therefore, this is the precise definition of real-time relative volume:
Current cumulative volume up to this time of day / Average cumulative volume up to this time of day
What should we understand while checking RVOL;
- Relative volume tell us if volume flows are increasing or decreasing
- A high relative volume tells us that there is increased trading activity in a security today
- Increased volume flows often accompany higher volatility i.e. a significant price move
Let see an example:
P.S. if you want to get more info about RVOL/Relative Volume then you can search it on the net. While developing the script this was used as reference, you can also check it for more info.
Enjoy!
Volumepriceanalysis

Isolated PivotsThis script identifies potential price reversals at pivot high/low points using sets of 3 candles.
Pivot High: The middle candle must have a higher high and a higher low than the two outer candles.
Pivot Low: The middle candle must have a lower low and a lower high than the two outer candles.
Potential usage: When a market is moving higher in an uptrend, if a pivot low is identified then that might be a sign of price weakness.

Volume Zones Multi-Timeframe OverlayAt its core, this indicator is a variation of my other indicator, Welkin Advanced Volume Overlay (for VSA )
This version is based on the power of multi-timeframe analysis. The basic functionality is simple: Plot lines from the high and low of candles formed during periods of high volume and fill the space between them. The volume levels for deciding what counts as "high volume" are based on standard deviations of the volume's SMA , and the higher the volume , the brighter the zone. i.e., a volume zone set by a volume level that is 4 standard deviations higher than average will be more "filled in" and less transparent than a volume zone from a 2 standard deviation candle.
These zones tend to act as areas of congestion, and the "ceilings" and "floors" of the zones as support and resistance . Overlapping zones tend to indicate strength and are likely to require more effort to get through. The more timeframes that agree with each other, the stronger the zone, ceiling, or floor.
By default, these zones are drawn based on the chart's timeframe and 1 timeframe higher, automatically set based on some "standard" values:
1m -> 5m
5m -> 15m
10m -> 30m
15m -> 60m
30m -> 60m
60m -> 1d
1d -> 1w
Finally, both the base timeframe and the higher timeframe are customizable; this is intended to make it easy to "double" up copies of the indicator to fit even more timeframes on the chart, creating a sort of heatmap for volume price analysis.
An example of three copies of the indicator, showing volume zones from 6 different timeframes.

Baekdoo baselineHi forks,
I'm trader Baekdoosan who trading Equity from South Korea. This Baekdoo baseline will give you the idea of big whale's approximate average price. The idea behind this indicator is to combine volume and price. Here's one of the equation.
...
HT4=highest(volume, 250)
NewH4=valuewhen(volume>HT4 , (open+close+low+high+close)/5, 1)
result4=ema(NewH4, 20)
...
As you can see it will update when highest volume is updated by certain period of time. At that update will be the price of the close weighted price. and I put shift value of 20 (offset of input value) due to putting time theorem of Ichimoku Balance Table. 20 days means for 1 month of market day.
Why this idea work? It is mainly for the support / resistance. Resistance is made for lots of individual's buy. When the price goes down, they are tend to hold. As time goes by price getting high to their average price, then they are selling it with small profit or the same price or with small loss. So resistance is made by lots of individuals. And supports are made by small number of big whales. If we see the volume only, then we cannot differentiate easily for lots of individuals and small number of big whales. But lower price's large volume will most probably be the whale where higher price's large volume will most probably tons of individuals.
hope this will help your trading on equity as well as crypto. I didn't try it on futures. Best of luck all of you. Gazua~!

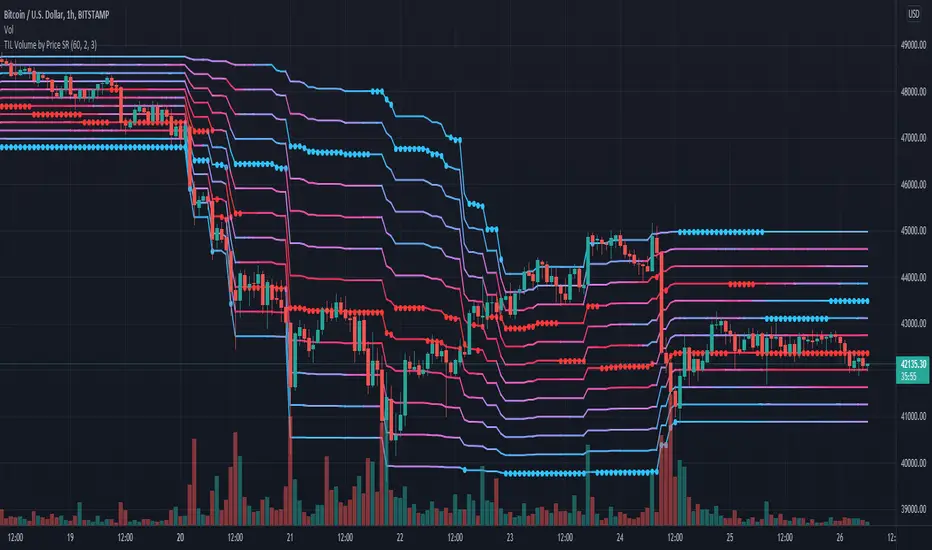
TIL Volume by Price SRTrading Indicator Lab's Volume by Price SR is a volume-based indicator for TradingView that reveals the strongest (and weakest) support and resistance levels in the chart among 12 price zones within a given period.
How It Works
The Volume by Price indicator uses a spectrum of blue to red colors to differentiate the strength of the volume within a price range for each bar. Think of it as a running volume profile with 12 price zones.
For each bar, the indicator calculates the rank of each price zone from the one that has the least number of volume to the highest within a given length of bars. Price zones that have less volume count are assigned colors that are closer to blue while price zones that have higher volume appear red. The indicator also marks the highest and lowest price levels in the rank with a red and blue dot which correspond to the same color code. The indicator repeats this in the next bar up to the last until it creates a stream of 12 lines that visually represent the gradual shift of volume strength in the price axis.
How to Use
The Volume by Price SR indicator is simple and can be used primarily to gauge support and resistance. Red lines represent price levels where there is a history of higher volume within the period, which also act as good support/resistance levels where price is more likely to be tested or bounce off.
As it can also be seen as a running volume profile indicator, the red and blue dots in each bar can be considered as high volume nodes (HVN) and low volume nodes (LVN) respectively. Though the calculation of the volume profile is continuous, the HVN and LVN dots can often appear consecutively or in a series within a single price level. The price tends to linger around or test lines that has the red dot (HVN). Meanwhile price rarely cross lines with the blue dot (LVN) or not spend as much time in these areas compared to other levels.
The height of the 12 price zones is determined by the difference between the highest high and lowest low of the period which can be useful in visualizing the chart's dynamic price range.
Inputs
- Length - sets the length of the period the indicator calculates for each bar
- Line Thickness - sets the thickness of the 12 lines all at once
- Dot Size - sets the size of the HVN and LVN dots
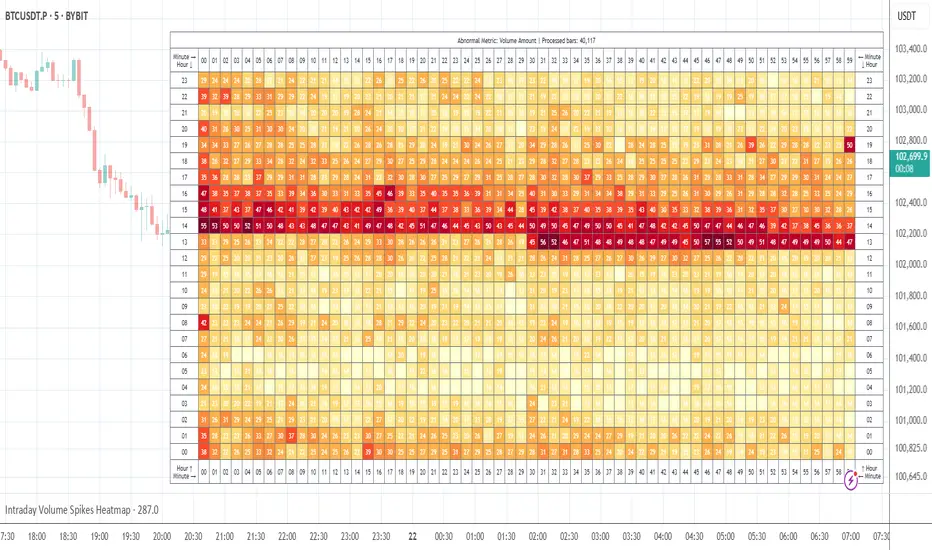
Intraday Volume Spikes HeatmapA tool to identify and visualize abnormal volume clusters. Intended for intraday charts with volume data available. Works out of the box without a need for setting up 100500 parameters.
Features:
Customizable table
4 modes
17 color palettes including Viridis, Inferno, Magma and Plasma available
Example: Viridis palette
Example: Inferno palette
Footprint
What is it?
The classic Market Footprint chart for realtime bars (; at least the closest I could get it to anyway).
The tool has 3 modes, which display different volume data for the traded prices of each bar: (1) Up/Down Volume Footprint: At-price Up Volume and At-price Down Volume ; (2) Total Volume Footprint: Total volume transacted at each price; and, (3) Delta Volume Footprint: Difference between At-price Up Volume and At-price Down Volume . You can choose which mode you want from Settings. Each at-price value is color-coded based on its strength/weakness.
Maximum at-price volume for a bar can be chosen to be displayed in a separate color. This will serve (and be shown) as the VPOC ( Volume Point of Control). Note: This is not technically precise as VPOC is a slightly different concept. (But should be the same for most candles).
Below the bars (or above, depending on how you configure it), are displayed the following:(1) Net Delta Volume for the bar; (2) Total Volume for the bar; (3) Cumulative Delta Volume for bars plotted up till this point (i.e., from the time the tool started collecting realtime data); (4) Buy Volume for the bar as a percentage of the total volume for the bar; and, (5) Sell Volume for the bar as a percentage of the total volume for the bar. Each value here is color-coded as well.
In addition, a custom candle option has been provided. These are ON by default and displays 'thinner' candles for, arguably, good readability with Footprint in Up/Down Volume Mode. With custom candles, Tradingview's default candles will be rendered redundant and can be disabled. If you wish to switch to Tradingview's candles, it is recommended that you use either hollow candle mode or bar mode to view the footprint properly. (Filled-body candles will hide the values). Note that with the Footprint chart in either "Total Volume" or "Delta Volume" mode, you are better off using Tradingview's hollow candles or bars.
Almost all labels/colors etc. are configurable to suit your aesthetics.
All data are ONLY AVAILABLE FOR REAL-TIME BARS. The longer you keep a chart open with the study enabled, the more data it collects and displays, and the better your analysis can potentially be. Note that the data gets reset every time (a) any of the options is changed, (b) the market is switched, (c) the browser is refreshed, or (d) the script is reloaded
DATA ISN'T STORED. I.e., every time a new symbol is loaded, the previous symbol's data is lost. So if you intend to monitor a symbol closely, you would need to keep it loaded all the time (and without tinkering with any of the Settings in between).
Who is it for?
For ultra short term traders who are used to looking at short term auction orderflow (and price action) to catch buy/sell anomalies and accurate trade entries
For traders looking to get into footprint chart reading and who wish to give it a go and learn before investing in expensive platforms/tools.
For traders (, irrespective of their method of trading,) who wish to understand what is happening under the hood when a certain price action unfolds.
Who is in control, who got trapped, what does liquidity or the lack thereof look like, etc.
Mode 2: Total Volume Footprint. This also shows how Tradingvoew's hollow candles can be used with the tool.
Mode 3: Delta Volume Footprint

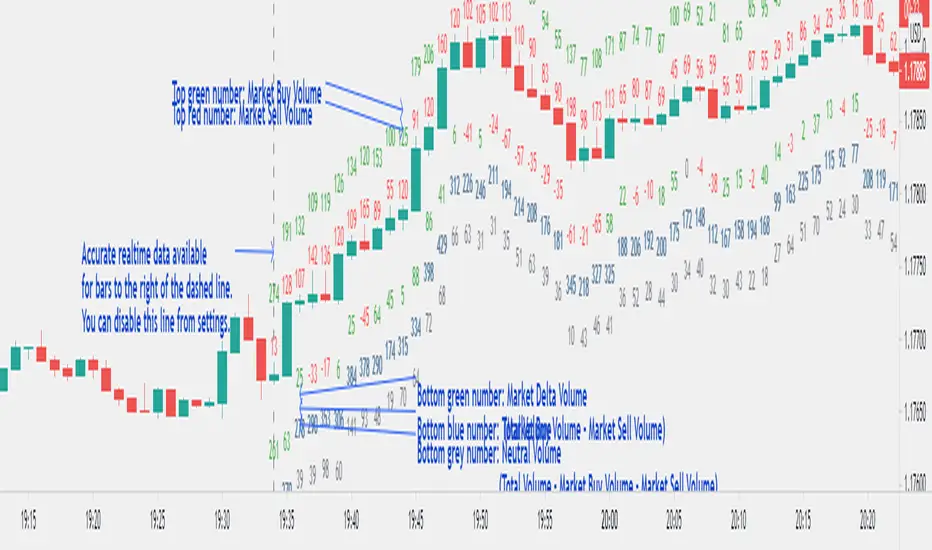
Realtime Volume Bars w Market Buy/Sell/Neutral split & Mkt Delta
What is it?
A tool that shows Real-time Volume bars split into 3 components: (1) Market Buy Volume - i.e., the volume that got transacted on upticks; (2) Market Sell Volume - i.e., the volume that got transacted on downticks;
and, (3) Neutral Volume - i.e., the volume that got transacted without a change in price. (This feature can be turned off if you want normal volume bars).
Market delta (i.e., Market Buy Volume - Market Sell Volume) is also displayed above each volume bar. (On by default; can be switched off from Settings)
The split and Market Delta data are ONLY AVAILABLE FOR REAL-TIME BARS. Historical bars are shown just like regular ones. The dotted line marks the start of real-time data (i.e., the bar from which the indicator started collecting and displaying data). You will see accurate data for bars to the right of this line. The longer you keep a chart open with the study enabled, the more data it collects and displays, and the better your analysis can potentially be.
Note that the data gets reset every time any of the options is changed, the market is switched, the browser is refreshed, or the script is reloaded
DATA ISN'T STORED. I.e., every time a new symbol is loaded, the previous symbol's data is lost. So if you intend to monitor a symbol, you would need to keep it loaded all the time.
Who is it for?
For traders who are used to analyzing buy/sell activity using market buy/sell volume and market delta information
Although you can use this independently as well, use it in conjunction with "Market Delta Volume for Realtime Bars" indicator to get a better visual representation of the numbers.

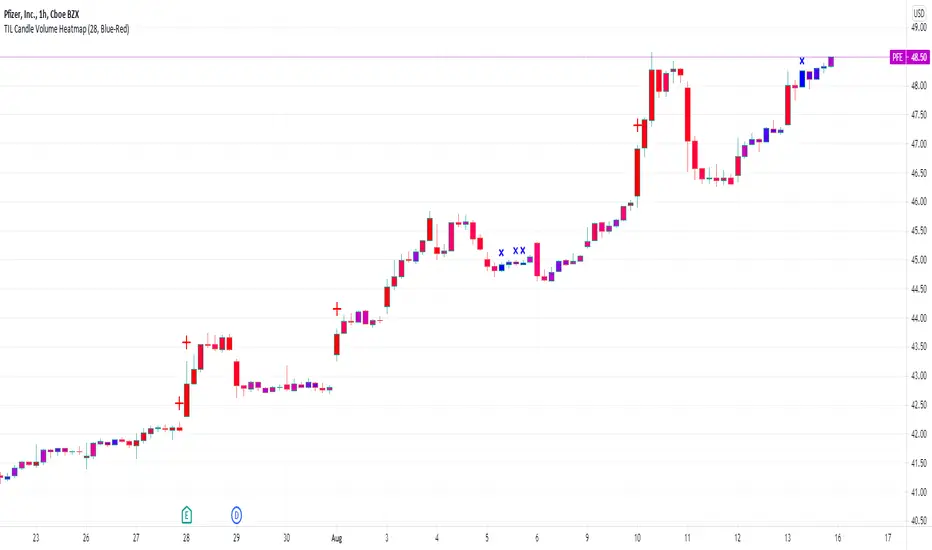
TIL Candle Volume HeatmapTrading Indicator Lab’s Candle Volume Heatmap for TradingView merges volume with price by applying gradient colors in the bars. It can also detect bars that have the most volume and the least volume.
Gradient Coloring
When applied to a chart, the Candle Volume Heatmap indicator applies colors to each bar which may vary according to its number of volume. The chart becomes a heatmap where you can easily spot which parts of the chart that are “hottest” or the bars that had the greatest number of volume and the “coldest” or ones that had the least volume. The indicator uses colors that transitions from BLUE to RED where shades closer to blue are “cold” (low volume) and those that are more in the shade of red are considered “hot” (high volume).
- Blue candlesticks – has low volume
- Red candlesticks – has high volume
High and Low Volume Bars
In addition to bar color changes, the Candle Volume Heatmap indicator also marks bars that have the lowest and highest volume within a certain length. Low and high-volume bars are marked as follows.
- – Low volume bars are marked with a small cross above them signifying a very low volume. Please note that this symbol always appears in new bars which are only starting to accumulate volume.
- – High volume bars are marked with a large plus sign above them signifying a very high volume. These bars along with other red-colored bars are the ones that should be monitored most.
Uses
Identifying low and high-volume bars can be useful in determining whether there is weight or “force” behind the price action that occurs in each bar. High volume bars can be used to validate candlestick reversal patterns and confirm breakouts in support and resistance levels.
Available Alert Conditions
- High Volume – triggers when a high-volume bar (marked with a plus sign) is detected
- Low Volume – triggers when a low-volume bar (marked with a cross sign) is detected
Inputs
- Length – sets the number of bars the indicator analyzes at each execution.
- Color Gradient – sets the color set for applying the heatmap on the chart candlesticks. Choices available are Blue-Red (good for light mode) and Yellow-Red (good for dark mode). Red color always signifies the highest concentration of volume.
- Apply Heatmap Colors – applies the color gradient on the chart candlesticks to indicate the amount of volume in each one
- Display Markers Below – moves the position of the high volume (plus) and low volume (cross) markers below the candlestick
Market Delta Volume for Realtime BarsWhat is it?
Market Delta Volume Tool for real-time bars
A market delta tool that shows, (1) the volume that got transacted on upticks - or the market buy volume; (2) the volume that got transacted on downticks - or the market sell volume (3) the market delta volume (i.e., market buy volume - market sell volume); (4) the total volume (market buy volume + market sell volume + neutral volume); and (4) the volume that got transacted without a change in price - or the neutral volume (total volume = market buy volume + market sell volume + neutral volume)
NOTE: THIS WORKS ONLY ON REAL-TIME BARS, NOT ON HISTORICAL BARS! The dotted line marks the start of real-time data (i.e., the bar from which the indicator started collecting and displaying data). You will see accurate data only for bars to the right of this line.
The longer you keep a chart open with the study enabled, the more data it collects and displays and the better your analysis can potentially be.
Note that the data gets reset every time any of the options is changed, the market is switched, the browser is refreshed, or the script is reloaded.
DATA ISN'T STORED. I.e., every time a new symbol is loaded/or the same symbol is reloaded, data gets refreshed.
Who is it for?
For traders who are used to analyzing buy/sell activity using market delta information. Especially, short-term trader/scalpers who are used to keeping the same chart open through the trading session.
Also for traders to see and study how anomalies in volume can give clues to buyer/seller absorption, initiative buying/selling etc.
Can be used to better understand VSA as well, although not necessary.
Essentially, this gives real-time delta volume information; use it however you see fit.
SVA - Simple Volume Analyzer, by BlueJayBird [bjb] ENGLISH & SPANISH
------------------------------------- ENSLIGH
The idea was initially inspired in the concepts shared by @LazyBear on his indicator "Better Volume Indicator" (). But I found it somewhat complicated and dull. So I came up with this.
Concept:
It changes the color of volume bars based on surrounding volume changes.
Volume changes are plotted as volume MAs lines in the volume pane.
Whenever the volume is higher than these MAs, the bar changes color.
For this reason, the bar color change is RELATIVE TO the surroundings, because the color change depends on how far the MA has been extended due to sudden (or not) changes in the volume.
BAR COLORS:
Weak Green and Red: Low volume. The calm before or after the storm.
Normal Green and Red: Mid volume. Still low volume, you may get bored.
Yellow: High volume. Players are playing hard and harder.
White: Ultra-High Volume. The elephants stepped in.
NOTES:
SVA works better at lower timeframes. Though as far as I can tell, it works pretty well as far as 1D timeframe.
------------------------------------- SPANISH
La idea estuvo inicialmente inspirada en los conceptos expuestos por @LazyBear en su indicador "Better Volume Indicator" (). Pero lo encontré un poco complicado y falto de claridad. Así que me inventé este.
Conceptp:
Cambia el color de las barras basándose en los últimos cambios de volumen.
Los cambios de volumen son ploteados como lineas de medias móviles (MAs, es decir "Moving Averages") en la sección del volumen (chart pane).
En cualquier momento que el volumen es mayor que estos MAs, el color de las barras cambia.
Por esta razon, el cambio de color de las barras es RELATIVO a lo que está sucediendo alrededor, ya que el cambio de color depende de qué tan lejos el MA se haya extendido por causa de los últimos cambios (o no) de volumen.
BAR COLORS:
Verde y rojo apagados: Volumen bajo (Low Volume). La calma antes de la tormenta.
Verde y rojo normales: Volumen medio (Mid volume). Volumen todavía bajo. Es posible que te aburras.
Amarillo: Volumen alto (High Volume). Los jugadores están jugando duro.
Blanco: Volumen ultra-alto (Ultra-High Volume). Los elefantes entran a la cancha.
NOTAS:
SVA funciona mejor en temporalidades menores. Pero por lo que he visto, funciona bien hasta la temporalidad de 1D.

Welkin Advanced Volume Study (for VSA)This is a translation of Welkin's Advanced Volume Study Indicator originally written for ThinkOrSwim. This version is simpler than Welkin's and attempts to streamline that basic functionality for beginners to Volume Spread Analysis.
This can be used to replace the built-in volume bar with a more advanced version that is designed to facilitate Volume Spread Analysis. The basic idea is to clearly call out areas of high and low volume that help a trader determine where to "Smart Money" may be attempting to move the market. Volume is an incredible powerful tool for the retail trader; learn how to use it.
Grey bar are Below Average volume .
Blue bars are Average Volume , from a 20sma of volume .
Orange bars are 2-sigma (or 2 standard deviations) above average.
Magenta bars are 3-sigma (3 standard deviations) above average.
The plotted lines represent these levels.
Yellow bars have relatively higher volume compared to the previous bar.
The study can also apply these same colors to the price candles themselves, as well as showing buying and selling pressure of the volume bars.

Volume Play This is going to be my first published indicator on Trading View. Thanks for TradingView for providing us this great platform And thanks for all of those who helps me to built this indicator and share there ideas.I cannot mention everyone name here believe me that list going to be huge.Everyone’s idea and help is much appreciated.This is how our TradingView community is growing day by day with kindness and knowledge. Every time I take so much from community in form knowledge that every time somewhere I feel that I also need to do something for community and finally day arrived .A gift from my side to community.A gift of indicator-VOLUME PLAY
This volume based indicator has High Relative Volume bar Background, Low Relative Volume bar background ,Volume Labels of Buying volume, Selling volume and Total volume count with percentage, Highest Volume in Percentage and Highest 5x volume count and 10x volume count of bar.Plus I have did column scaling to take Down pan input so you can switch pane or add in existing pane without any major problem And all this works on any time frame. Isn’t it good idea?
This indicator displays the volume of each session in a similar manner of the default volume indicator.However it add on the last bar Green and Red bar colours. Green means buying is more than selling and Red means selling is more than buying.On top of Some bar If number appears That means that’s volume is highest multiple volume of 5 and if number appears with label means highest multiple volume of 10.So simple without label volume counts means 5x and with label means 10x.
Now some of bars has background colour of Mint green , Pastel red and White.That’s highlight high relative volume bars with a highly buying activity range in Green and high relative volume bars with a highly selling activity range in Red And white background is low relative volume for that timeframe bar.
I am kind of person who don’t keep show indicator value enable all time.So it’s come in mind why not plot this values without enabling it.So I decided to show this values of buying, selling and total volumes on top near middle pane.Interesting thing is that I made a label with the help of pine script Table feature.Thanks a lot to Pine Team to add this new great feature! It’s great alternative for labels feature.Because of this feature I am able to locate buying, selling and total volume at right place where in most of scenario it will adjust.
Please note that all values are estimate.It’s not accurate.I show volumes in K,M form.Plus with volume I also try to show Buying And Selling volume in percentage form to get rough idea about what’s going on in instrument.Idea is to get better view of volume by splitting it into Buying , Selling and Total volume.This allows you to see are the bulls or bears in-control in relation to the overall Volume.
By default this indicator overlay is false but you can move this indicator pane to existing upper or lower pane.It will help to save space as well.If combine with two indicator at same pane then it will create two value scale at right side.So you will not loose any indicators values.By default I used 50% of vertical space in indicator scale factor.
I tried to make this indicator as accurate as inbuilt volume indicator with added extra feature.The main aim of indicator to get Idea of volume role in that symbol with that specific timeframe.Result might not be accurate but I expect somewhat nearby to accurate.
Kept source code open purposely for learners of pine script. Please avoid misuse or selling of this indicator.Remember Sharing Is Caring. If someone has suggestions or any addition then please comment below.Wishing you all abundance of health, wealth, and prosperity.
After all its all about VOLUME PLAY.
Disclaimer:-This indicator is not meant for buy or sell signals.This post and the script don’t provide any financial advice. This indicator/code IS NOT intended to be a formal investment advice or recommendation by the author, nor should be construed as such. Users will be fully responsible by their use regarding their own trading vehicles/assets.

Comparison Chart with Relative Volume Gradient CandlesThis indicator provides a way to use Relative Volume Gradient Paintbars on an alternate/comparison symbol while still looking at your main charted symbol. For instance, this allows you to plot the ES1! or SPY or QQQ above/below your charted symbol, and see its current Relative Volume signal, and compare that to the your currently-charted individual stock symbol, etc., and while keeping the candles from both symbols all lined up perfectly. It also provides 4 different custom MAs which can be applied to the comparison symbol.
The idea here is that you can potentially use my other indicator, Relative Volume Gradient Paintbars, on the primary symbol to evaluate that chart, while using this particular indicator to quickly analyze the same Relative Volume data on a comparison market symbol such as the SPY or QQQ without having to switch charted symbols. You can also quickly compare price action and location relative to familiar moving averages to quickly gauge relative strength of the stock vs. the market symbol.

Applied Volume Spread Analysis [VSA and VPA]Tried to work over Volume Spread Analysis concepts
The Script Helps one figure out the analysis of Price Volume as per the Tom William's book "Mastering the Markets"
with some of my modifications to find out volumetric level of judgement,
You can see The notifications of a pattern on the chart,
Also gray and black lines which you see are the volumetric derived price action levels!
Some definitions
Up Thrusts
Up-thrusts are designed to catch stops and to mislead as many traders as possible. They are normally seen after there has been weakness in the background. The market makers know that the market is weak, so the price is marked up to catch stops, encourage traders to go long in a weak market, AND panic traders that are already Short into covering their very good position
upthrust bar at high volume is a sure sign of weakness. One may even seriously consider ending the Longs AND be ready to reverse. Also note that when A wide spreaddown-bar that appears immediately after any up-thrust, tends to confirm the weakness (the market makers are locking in traders into poor positions). With the appearance of an upthrust you should certainly be paying attention to your trade AND your stops. On many upthrusts you will find that the market will 'test' almost immediately. A wide spread down bar following a Upthrust Bar.This confirms weakness. The Smart Money is locking in Traders into poor positions.
Strength Bar
The stock has been in a down Trend. An upbar with higher Volume closing near the High is a sign of strength returning. The downtrend is likely to reverse soon. when the volume is very much above average. This makes this indication more stronger.
Pseudo Up Thrust
A pseudo Upthrust. This normally appears after an Up Bar with above average volume. This looks like an upthrust bar closing down near the Low. But the Volume is normally Lower than average. this is a sign of weakness.If the Volume is High then weakness increases. Smart Money is trying to trap the retailers into bad position. A downbar after a pseudo Upthrust Confirms weakness. If the volume is above average the weakness is increased.
Low Volume Test applied
The previous bar was a successful Test of supply. The current bar is a upbar with higher volume. This confirms strength
Trend Change
The stock has been moving up on high volume. The current bar is a Downbar with high volume. Indicates weakness and probably end of the up move
Effort Up
Effort to Rise bar. This normally found in the beginning of a Markup Phase and is bullish sign.These may be found at the top of an Upmove as the Smart money makes a last effort to move the price to the maximum
Effort Down
Effort to Fall bar. This normally found in the beginning of a Markdown phase.
No Supply Bar
No Supply. A no supply bar indicates supply has been removed and the Smart money can markup the price. It is better to wait for confirmation
Stopping Volume
This will be an downbar during a bearish period closing towards the Top accompanied by High volume. A stopping Volume normally indicates that smart money is absorbing the supply which is a Indication that they are Bullishon the MArket.Hence we Can expect a reversal in the down trend.
No Demand Bar
Any up bar which closes in the middle OR Low, especially if the Volume has fallen off, is a potential sign of weakness. Things to Look Out for: if the market is still strong, you will normally see signs of strength in the next few bars, which will most probably show itself as a Down bar with a narrow spread, closing in the middle OR High. * Down bar on Low Volume.
How can you get Access
Just private message me!
Will be happy to help, use comment box for constructive comments only

VR_BullriderVR Bullrider is indicator to help traders and investors to do volume price analysis.
Darker color green meaning volume is PADU
Light color green meaning volume is ok
Blue color = volume is not strong
X mark is to show volume is starting to moving up
Semoga manfaat semua, share share Volume Indicator ni supaya korang lebih mahir baca volume sebelum buat keputusan untuk entry sesuatu counter tu.

Earned ProEarned Pro - is result of many trials, problems and mistakes. This script includes everything I know about price behavior and this is truly maximum that can be squeezed out from broker data. So, what kind of data does the script provide? Earned Pro divides volume of current bar into several parts, clearly indicating how much of this volume was involved in the trading process and in which form. Earned Pro shows difference between trading process and balanced position when desire to buy is equal to desire to sell.
Settings:
1) Buying current sales - so light green color in standard settings indicates about predominance of purchases from those players who were selling directly in current candle. So, it turns out that this indicator tells us that only those contracts are bought that are sold right here in this bar.
2) Buying old sales – dark green color in standard settings indicates about predominance of purchases from those players who were selling in the past (NOT in this candle) so that mean this volume was satisfied. It’s very important to know? How you think? 😉
3) Selling current buys - sale of contracts purchased in current candle. It's simple - this is predominance of sales to those purchases that are made in current candle.
4) Selling old buys – sale of contracts that was purchased in the past. Important? Of course, because you know what exactly happens.
How to use this information? I explain. So, what kind of picture can be:
1) Bull candle and “Buying old sales” bigger that another. It means market satisfied old sales (short position) by selling to user who want to buy in this candle (trader close short – return his debt). Its short signal.
2) Bull candle and “Buying current sales” bigger that another. It means market satisfied current sales it’s NOT trend exhausting its only clear sold. And of course, we can’t interpret this kind of bull candle like growth is over. Its like traders purchase and exchange lets this process go - interested in growth.
3) Bear candle and “Buying old sales” bigger that another. It means market invest in this point and price took bull potential. For example, it can be purchasing from traders who close they shorts what was open in the past. Its bulls signal. Just like traders think that downward trend will over.
4) Bear candle and “Buying current sales” bigger that another. It means market don’t want to stop downward trend and sold is more active than current purchasing.
5) Bull candle and “Selling old buys” very strong short signal because it satisfies of purchases that was doing in the past.
6) Bull candle and “Selling current buys” trade continue on fuel element - It means market don’t want to stop upward trend and buys is more active than current sells.
7) Bear candle and “Selling old buys” – traders close they longs and exchange purchase it its just like example number 1 but in reverse.
8) Bear candle and “Selling current buys” – It means market satisfied current buys it’s NOT trend exhausting its only clear purchase. And of course, we can’t interpret this kind of bear candle like downward is over. It’s like traders sell and exchange lets this process go - interested in downward.
You must understand that Earned Pro showing predominance volume (it means indicated volume of this process is greater than rest of volume - rest of volume is balanced by vector of forces).
Its paid script. Want to rent – write private.
Multi Time Frame Effective Volume ProfileWHAT DOES THIS INDICATOR DO?
It is a well-known fact that volume often precedes price. As such, if you can spot an increased volume early on, you can take a position before the majority joins the trend. The purpose of this indicator is to show the tactical moves of the insiders and the big players before they become obvious to everyone. Similarly, you should more easily be able to identify trend exhaustion and look to close your position.
This volume indicator is largely inspired by Pascal Willain's concept of Effective Volume described in his book "Value in Time" , which is an improvement over Larry Williams' accumulation/distribution formula. The more robust formula takes into account two very important factors:
1) the gaps that are an inevitable part of almost all securities;
2) the closing price in relation to the spread, which indicates the bull/bear strength;
I have slightly modified Pascal Willain's formula for Effective Volume and introduced a few additional features, which I believe make the indicator easier to use and understand.
HOW DOES THE INDICATOR WORK?
1. Volume Bar Deconstruction
The first significant part of this indicator is that it deconstructs the volume bar of your current trading session into one-minute volume bars, separates the significant volume, and then reconstructs the bar again. As a result, you get a new bar, in which only the significant volume is counted. Not only this, but you also get a more comprehensive view of the relationship between buying and selling that occurred on the smaller time frame.
In the screenshot below you can see that although the bears were stronger, the bulls met them with almost identical force, which resulted in absorbing the supply in 1 and then in 2 the demand drove the price up. In a traditional volume bar chart (which is also plotted), you only see the total traded volume in either red or green depending on the closing of the bar. As you would probably agree, this does not reveal the whole story.
Accumulation/distribution by large players and funds is done with great precision, which is hard to catch intraday and nearly impossible on a daily time frame. However, large orders are hard to conceal on the 1-min chart since any unusual volume sticks out like a sore thumb. The whole idea here is for you to get a comprehensive view of what's going on in the small time frame, reveal any hard to spot transactions, and then make an informed decision on your trading time frame.
To ease your analysis even further, the indicator shows you minor volume as a percent of the major volume . Since your current time frame volume bar is a sum of all buying and selling volume from a smaller time frame, you get to see a more complete picture of the buying and selling that occurred. For example, you have a total volume of 150 BTC in a single 1h volume bar, out of which 100 BTC is in selling volume and 50 BTC is in buying volume. What you will see as parameters are this: 50 (buying volume), 100 (selling volume), 50 (minor volume as a percent of the big volume, since 50/100 = 0.5 = 50%). The higher the percentage, the more even the powers between buying and selling are.
2. Volume Trend
Building upon the first feature of the indicator, you can also choose a cumulative volume trend line. It is constructed by evaluating the type of the significant volume - adding it up if the bar closes positive (green) and subtracting it if the bar closes negative (red). The evaluation is once again done on a 1-min time frame by default, but you can change that along with the count lookback period in settings.
3. Bull / Bear Equilibrium
Based upon the volume bars, Bull/Bear Equilibrium shows you the difference between buying and selling pressure under the form of a smoothed histogram. It is particularly useful not only for spotting trends early in the beginning, but also when those trends start reaching a point of exhaustion. You can then move your Stop Loss accordingly, close part of your position to preserve profits, or even look for a good entry position in the opposite direction.
HOW MUCH DOES THE INDICATOR COST ?
As much as I would like to offer it for free (as some of my other ones), a great deal of work, trading logic, and testing have gone into creating this indicator. More than a few hundred iterations and a few dozen branches were required to reach the end result which is a precise combination of usefulness, simplicity, and practicality. Furthermore, this indicator will continue to be updated and user-requested features that improve its performance will be added.
Disclaimer: The purpose of all indicators is to indicate potential setups, which may lead to profitable results. No indicator is perfect and certainly, no indicator has a 100% success rate. They are subject to flaws, wrongful interpretation, bugs, etc. This indicator makes no exception. It must be used with a sound money management plan that puts the main emphasis on protecting your capital. Please, do not rely solely on any single indicator to take trading decisions instead of you. Indicators are storytellers, not fortune tellers . They help you see the bigger picture, not the future.
To find out more about how to gain access to this indicator, please use the provided information below or just message me. Thank you for your time.

Simple PVT Strength Spotter™TradeChartist Simple PVT Strength Spotter is a modified version of Price Volume Trend visualised using Relative Strength and helps spot price trends using visually engaging and appealing PVT Strength Oscillator plot and background. The Bull and the Bear background fills are highly useful for traders who like to visually understand areas of entry/exit based on PVT Strength and Oscillator Highs and Lows help spot Bull and Bear Divergences.
===================================================================================================================
What does Simple PVT Strength Spotter do?
Plots PVT Strength with visually engaging colours for Bull and Bear zones (Green and Red).
Plots PVT Strength coloured bars on main chart based on user preferred Upper and Lower PVT Strength bands (Default - 5/-5).
Plots PVT Strength based on EMA smoothing (1 for Regular PVT Strength without smoothing).
Plots Heikin Ashi PVT Strength if enabled from indicator settings.
Plots PVT Strength highs of Bull Zone and PVT Strength lows of Bear Zone. Helps visually spot divergences.
===================================================================================================================
Note:
Default Settings:
7 period PVT Strength using 5 EMA Smoothing.
For Heikin Ashi PVT Strength on normal bars, enable ᴜsᴇ ʜᴇɪᴋɪɴ ᴀsʜɪ PVT Sᴛʀᴇɴɢᴛʜ .
Works only on symbols that have Volume data.
===================================================================================================================

[blackcat] L1 Stock Volume AnalyzerLevel: 1
Background
The basic volume analysis is that buyers are in control when the price is increased. The purchase volume takes place at the offer price and represents the lowest advertised price at which sellers sell their shares. When someone buys shares at the current asking price, it shows that someone wants the shares and is included in the purchase volume metric.
Function
L1 Stock Volume Analyzer plot colorful volume candles with different meanings: red for red price bars, green for green price bars, yellow for active buying volume, fuchsia for active selling volume, navy for high active buying volume turn over rate, and white for high active selling volume turn over rate.
Key Signal
VOLUME SIGNAL:
activbuying ---> active buying volume
activselling ---> active selling volume
abtor ---> high active buying turn over rate
astor ---> high active selling turn over rate
PRICE SIGNAL:
cd ---> price covergence and divergence
positioning ---> price positioning
callthshots ---> call the shorts price signal
Pros and Cons
Pros:
1. extract volume detailed information to judge price trend together
2. price convergence and divergence help to identify long and short entry points
Cons:
1. price convergence and divergence visually works well only for <= 8H time frame
2. this indicator only works for stock trading pairs
Remarks
In order to put price and volume in a unified scale, this indicator is scaled. This scaling is not suitable for all markets. At present, it has only been optimized in the stock exchange market.
Readme
In real life, I am a prolific inventor. I have successfully applied for more than 60 international and regional patents in the past 12 years. But in the past two years or so, I have tried to transfer my creativity to the development of trading strategies. Tradingview is the ideal platform for me. I am selecting and contributing some of the hundreds of scripts to publish in Tradingview community. Welcome everyone to interact with me to discuss these interesting pine scripts.
The scripts posted are categorized into 5 levels according to my efforts or manhours put into these works.
Level 1 : interesting script snippets or distinctive improvement from classic indicators or strategy. Level 1 scripts can usually appear in more complex indicators as a function module or element.
Level 2 : composite indicator/strategy. By selecting or combining several independent or dependent functions or sub indicators in proper way, the composite script exhibits a resonance phenomenon which can filter out noise or fake trading signal to enhance trading confidence level.
Level 3 : comprehensive indicator/strategy. They are simple trading systems based on my strategies. They are commonly containing several or all of entry signal, close signal, stop loss, take profit, re-entry, risk management, and position sizing techniques. Even some interesting fundamental and mass psychological aspects are incorporated.
Level 4 : script snippets or functions that do not disclose source code. Interesting element that can reveal market laws and work as raw material for indicators and strategies. If you find Level 1~2 scripts are helpful, Level 4 is a private version that took me far more efforts to develop.
Level 5 : indicator/strategy that do not disclose source code. private version of Level 3 script with my accumulated script processing skills or a large number of custom functions. I had a private function library built in past two years. Level 5 scripts use many of them to achieve private trading strategy.

Freedom of MovementFreedom of Movement Indicator
---------------------------------------------------------
In “Evidence-Based Support & Resistance” article, author Melvin Dickover introduces two new indicators to help traders note support and resistance areas by identifying supply and demand pools. Here you can find the support-resistance technical indicator called "Freedom of Movement".
The indicator takes into account price-volume behavior in order to detect points where movement of price is suddenly restricted, the possible supply and demand pools. These points are also marked by Defended Price Lines (DPLs).
DPLs are horizontal lines that run across the chart at levels defined by following conditions:
* Overlapping bars: If the indicator spike (i.e., indicator is above 2.0 or a custom value) corresponds to a price bar overlapping the previous one, the previous close can be used as the DPL value.
* Very large bars: If the indicator spike corresponds to a price bar of a large size, use its close price as the DPL value.
* Gapping bars: If the indicator spike corresponds to a price bar gapping from the previous bar, the DPL value will depend on the gap size. Small gaps can be ignored: the author suggests using the previous close as the DPL value. When the gap is big, the close of the latter bar is used instead.
* Clustering spikes: If the indicator spikes come in clusters, use the extreme close or open price of the bar corresponding to the last or next to last spike in cluster.
DPLs can be used as support and resistance levels. In order confirm and refine them, FoM (Freedom of Movement) is used along with the Relative Volume Indicator (RVI), which you can find here:
Clustering spikes provide the strongest DPLs while isolated spikes can be used to confirm and refine those provided by the RVI. Coincidence of spikes of the two indicator can be considered a sign of greater strength of the DPL.
More info:
S&C magazine, April 2014.

Average High Traded Volume (Nodes) - Levels/Zones (Expo)Average High Traded Volume (Nodes) - (Expo) automatically identifies and displays High Traded Volume Nodes.
Levels/Zones are displayed where there has been a significant level of trading activity and when there has been both high supply and demand. These levels can leave clues for future price behavior and act as support/resistance zones.
The indicator can be used standalone or as a part of your current trading strategy.
Real-time
No repainting
Works on any market if volume data is provided
HOW TO USE
1. Use the indicator to identify High Traded Volume Nodes.
2. Use the indicator to identify support/resistance zones.
3. Use the indicator to confirm the existence, or a continuation, of a trend or a trend reversal.
INDICATOR IN ACTION
4-hour chart
I hope you find this indicator useful , and please comment or contact me if you like the script or have any questions/suggestions for future improvements. Thanks!
I will continually work on this indicator, so please share your experience and feedback as it will enable me to make even better improvements. Thanks to everyone that has already contacted me regarding my scripts. Your feedback is valuable for future developments!
ACCESS THE INDICATOR
• Contact me on TradingView or use the links below
-----------------
Disclaimer
Copyright by Zeiierman.
The information contained in my scripts/indicators/ideas does not constitute financial advice or a solicitation to buy or sell any securities of any type. I will not accept liability for any loss or damage, including without limitation any loss of profit, which may arise directly or indirectly from the use of or reliance on such information.
All investments involve risk, and the past performance of a security, industry, sector, market, financial product, trading strategy, or individual’s trading does not guarantee future results or returns. Investors are fully responsible for any investment decisions they make. Such decisions should be based solely on an evaluation of their financial circumstances, investment objectives, risk tolerance, and liquidity needs.
My scripts/indicators/ideas are only for educational purposes!

Volume Spread Analysis Indicators [Volume Trader]This indicator is based on Volume and Price spread analysis developed by tom williams.
It shows following indicators based on price range and volume data
Bearish Indicators
1. Buying climax
2. End of Rising Market
3. Upthrust
4. Smart selling
5. No Demand
6. VDD
Bullish Indicators
1. Selling Climax
2. End of falling
3. Stop Volume
4. Reverse Upthrust
5. Shakeout
6. VDU
6. No supply
