נפח מחיר ממוצע משוקלל (VWAP)
אינדיקטורים, אסטרטגיות וספריות
The script searches for max values of last three days and then calculates average of those values
Plots VWAP and MVWAP for intraday trading. Useful to avoid whipsaws Market structure is important to take any trades Avoid taking trades close to support and resistance
Indicador personalizado com 6 EMAs + VWAP. Recomendo utilização do tema escuro e EMAs 50, 100 e 200.
There are a number of VWAP indicators out there, but it's difficult to find VWAP calculations that take the entire week into account. This helps with analyzing longer-term trends on daily and intraday charts. As with all VWAP indicators, this one is also more sensitive to price starting at the open of trading at the beginning of the week.
3-in-one indicator, for swing and intra-day trading, which includes Simple Moving Average (SMA) Exponential Moving Average (EMA) Volume-Weighted Average Price (VWAP)
Volume Profile Free Ultra SLI by RagingRocketBull 2019 Version 1.0 This indicator calculates Volume Profile for a given range and shows it as a histogram consisting of 100 horizontal bars. This is basically the MAX SLI version with +50 more Pinescript v4 line objects added as levels. It can also show Point of Control (POC), Developing POC, Value Area/VWAP StdDev...
The script has traditional VWAP for two different timeframes along with an option to anchor them to a particular bar. VWAP bands are also included in the script. The bands and VWAP act as hidden support/resistance for the scrip and are useful for intraday trading.
Uses donchian points to anchor VWAPs (start a new VWAP interval). The defaults are set up for a 1H chart, with lookback periods of 1 day, 2 days, 1 week, 2 weeks and 4 weeks for the anchor points. Green : upper donchian AVWAPs, Red : lower donchian AVWAPS, thin/1day to thickest/4 week. Option to test whether a new point should be formed from a high or low...
Anchor vwap to begin at a certain time. Uses hlc3 for vwap calculations.
Quick and dirty mod of this script in order to fit my needs. Added one custom session More user friendly (Enable/disable through inputs menu)
SMEF Scalper 2.0 by shaslund. Trying to mix some humour into technical trading. Kudos to Douglas Adams for his great books. Please take some time to read them. I believe all traders have been SMEF'd now and then... For the uninitiated: SMEF = 'Spontaneous Massive Existence Failure'. Methology: I am combining a TEMA and a volume-weighted average to predict...
Volume Profile Free MAX SLI by RagingRocketBull 2019 Version 1.0 All available Volume Profile Free MAX SLI versions are listed below (They are very similar and I don't want to publish them as separate indicators): ver 1.0: style columns implementation ver 2.0: style histogram implementation ver 3.0: style line implementation This indicator calculates Volume...
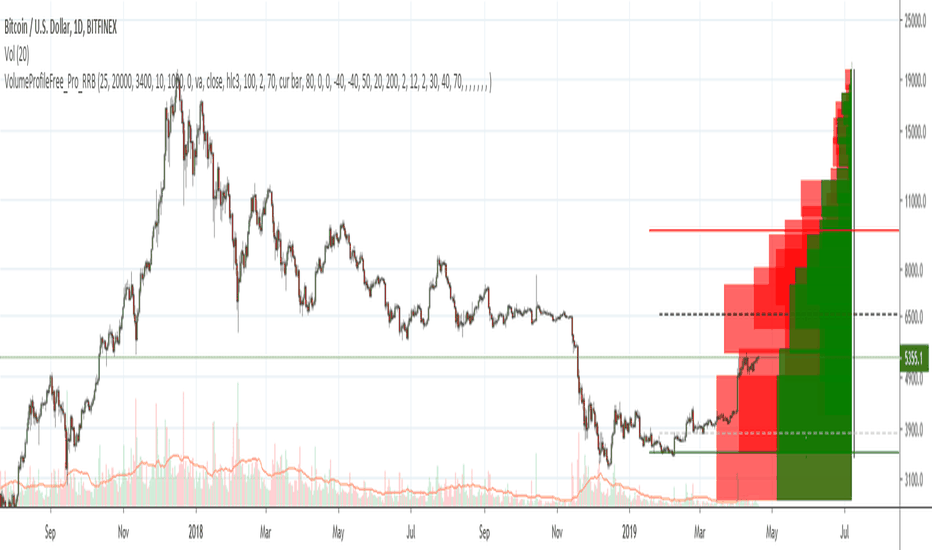
Volume Profile Free Pro by RagingRocketBull 2019 Version 1.0 All available Volume Profile Free Pro versions are listed below (They are very similar and I don't want to publish them as separate indicators): ver 1.0: style columns implementation ver 2.0: style histogram implementation ver 3.0: style line implementation This indicator calculates Volume Profile...
Shows the price of BTC on multiple exchanges, helps to see which is leading in price and if the current price is above or below average. For use on COINBASE:BTCUSD unless you customize it To use on other platforms (Bitfinex, BitMEX, etc) go to options and enable "Show Coinbase" then hide whatever exchange you're currently on. To disable exchanges, uncheck them...
This indicator will show the 5Min intraday VWAP onto any other timeframe. I like to see where the 5min VWAP is while on the 1Min chart for example.


