Zero-Lag ATR Trend [BackQuant]Zero-Lag ATR Trend
Overview
Zero-Lag ATR Trend is a volatility-adaptive trend-following overlay designed to identify directional market regimes with minimal delay while preserving structural clarity. The indicator combines a zero-lag moving average framework with a zero-lag volatility model to produce a trailing trend line that reacts quickly to meaningful price changes without becoming unstable or overly sensitive.
Unlike conventional ATR-based trend tools that rely on lagging averages and delayed volatility estimates, this indicator applies zero-lag logic to both the trend centerline and the volatility calculation. The result is a trend structure that aligns more closely with real-time price action while still maintaining the discipline required for trend continuation trading.
Core design philosophy
The core idea behind Zero-Lag ATR Trend is simple:
Reduce signal delay without sacrificing trend integrity.
Adapt dynamically to changing volatility regimes.
Provide a single, clean structure that defines trend direction, continuation, and invalidation.
Instead of stacking multiple indicators, the script builds a complete trend framework from two tightly integrated components: a zero-lag trend spine and a zero-lag ATR trailing mechanism.
Zero-lag trend spine
The trend spine is constructed using a zero-lag moving average (ZLMA). This is achieved by applying a corrective step to a traditional moving average, effectively compensating for smoothing delay.
Conceptually, the process works as follows:
A base moving average is calculated from the selected price source.
That moving average is then passed through a zero-lag correction.
The correction pulls the line closer to current price without introducing noise.
This produces a trend line that reacts faster than standard EMA, SMA, or HMA signals, particularly during early trend acceleration phases. Multiple moving-average types can be used inside the zero-lag framework, allowing traders to fine-tune responsiveness based on asset behavior and timeframe.
Zero-lag volatility model
Volatility is measured using True Range, but instead of applying classic ATR smoothing, the indicator uses a zero-lag smoothing pass on the True Range itself.
This approach offers several advantages:
Volatility expands more quickly during impulse moves.
Volatility contracts faster during consolidations.
Band width adjusts in near real-time to changing conditions.
The smoothed zero-lag ATR is multiplied by a user-defined factor to create adaptive upper and lower boundaries around the trend spine. These boundaries define how much counter-movement price is allowed before the trend structure is invalidated.
Volatility-aware trailing structure
The trailing output is the defining feature of the indicator. It behaves as a one-directional trailing structure:
In bullish conditions, the trailing line can only move upward.
In bearish conditions, the trailing line can only move downward.
Minor pullbacks inside the volatility envelope do not flip the trend.
This logic prevents the indicator from reacting to shallow retracements and focuses instead on structural trend changes. Because the trailing behavior is volatility-scaled, the indicator remains stable during high volatility while still responding promptly during regime shifts.
Trend flips and regime transitions
Trend direction is determined by changes in the trailing structure itself rather than raw price crosses. A trend flip occurs only when price movement is strong enough, relative to current volatility, to force the trailing line to reverse direction.
This means:
Bullish flips represent genuine transitions into upward regimes.
Bearish flips represent genuine transitions into downward regimes.
Sideways noise is largely filtered out.
As a result, the indicator is well suited for identifying medium-to-long trend phases rather than short-term oscillations.
Visual structure and chart clarity
The visual design is intentionally minimal and functional:
The main trailing line is color-coded by trend direction.
An optional ribbon or cloud reinforces directional bias.
Optional candle coloring aligns price bars with the active trend.
These elements allow traders to assess trend state instantly without interpreting multiple signals or overlays.
How to use for trend following
Trend bias
Maintain a bullish bias while price holds above the trailing line.
Maintain a bearish bias while price holds below the trailing line.
Entries
Trend flips can be used as initial directional entries.
Pullbacks toward the trailing line often act as continuation opportunities.
Momentum confirmation can be layered on top for additional confluence.
Trend management
The trailing line naturally functions as a dynamic stop reference.
As long as price respects the trailing structure, the trend remains valid.
A flip in direction signals a full regime transition rather than a minor correction.
Why zero-lag matters for trend trading
Traditional trend indicators often react late, especially during fast expansions, resulting in delayed entries and early exits. By reducing lag in both the trend calculation and the volatility model, Zero-Lag ATR Trend aims to capture a larger portion of directional moves while maintaining consistency and discipline.
This makes it particularly effective for momentum-based trend following, breakout continuation strategies, and traders who prioritize staying aligned with dominant market structure rather than predicting reversals.
Summary
Zero-Lag ATR Trend is a complete trend-following framework built around responsiveness, adaptability, and clarity. Its zero-lag architecture allows it to respond earlier to meaningful price changes, while its volatility-aware trailing logic ensures that trends are only invalidated when structure truly breaks. The result is a clean, intuitive tool that supports disciplined trend participation across assets and timeframes.
Zlma

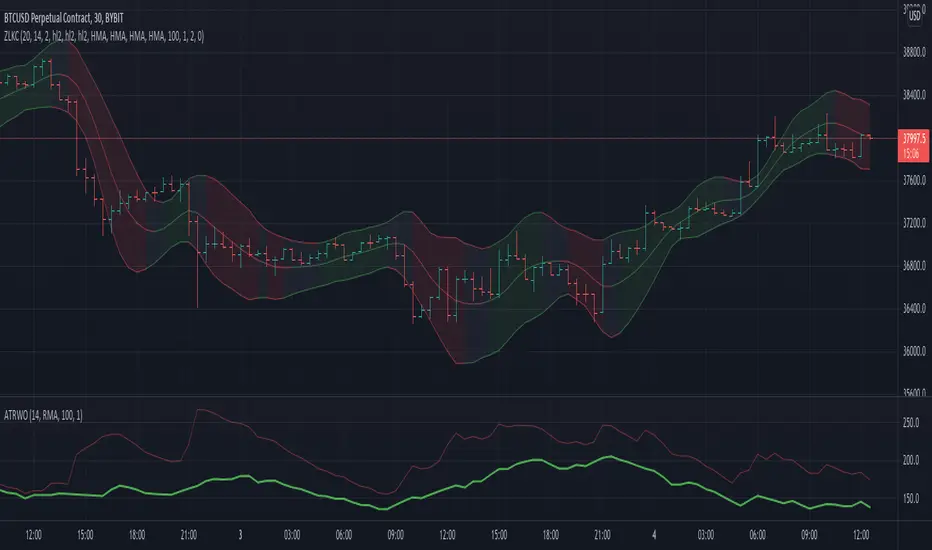
ZLMA Keltner ChannelThe ZLMA Keltner Channel uses a Zero-Lag Moving Average (ZLMA) as the centerline with ATR-based bands to track trends and volatility.
The ZLMA’s reduced lag enhances responsiveness for breakouts and reversals, i.e. it's more sensitive to pivots and trend reversals.
Unlike Bollinger Bands, which use standard deviation and are more sensitive to price spikes, this uses ATR for smoother volatility measurement.
Background:
Built on John Ehlers’ lag-reduction techniques, this indicator adapts the classic Keltner Channel for dynamic markets. It excels in trending (low-entropy) markets for breakouts and range-bound (high-entropy) markets for reversals.
How to Read:
ZLMA (Blue): Tracks price trends. Above = bullish, below = bearish.
Upper Band (Green): ZLMA + (Multiplier × ATR). Cross above signals breakout or overbought.
Lower Band (Red): ZLMA - (Multiplier × ATR). Cross below signals breakout or oversold.
Channel Fill (Gray): Shows volatility. Narrow = low volatility, wide = high volatility.
Signals (Optional): Enable to show “Buy” (green) on upper band crossovers, “Sell” (red) on lower band crossunders.
Strategies: Trade breakouts in trending markets, reversals in ranges, or use bands as trailing stops.
Settings:
ZLMA Period (20): Adjusts centerline responsiveness.
ATR Period (20): Sets volatility period.
Multiplier (2.0): Controls band width.
If you are still confused between the ZLMA Keltner Channels and Bollinger Bands:
Keltner Channel (ZLMA): Uses ATR for bands, which smooths volatility and is less reactive to sudden price spikes. The ZLMA centerline reduces lag for faster trend detection.
Bollinger Bands: Uses standard deviation for bands, making them more sensitive to price volatility and prone to wider swings in high-entropy markets. Typically uses an SMA centerline, which lags more than ZLMA.

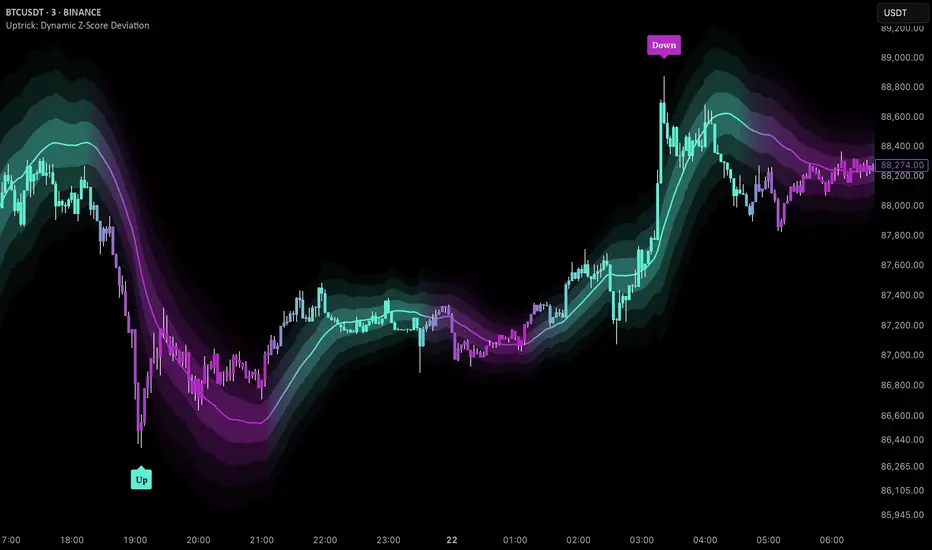
Uptrick: Dynamic Z-Score DeviationOverview
Uptrick: Dynamic Z‑Score Deviation is a trading indicator built in Pine Script that combines statistical filters and adaptive smoothing to highlight potential reversal points in price action. It combines a hybrid moving average, dual Z‑Score analysis on both price and RSI, and visual enhancements like slope‑based coloring, ATR‑based shadow bands, and dynamically scaled reversal signals.
Introduction
Statistical indicators like Z‑Scores measure how far a value deviates from its average relative to the typical variation (standard deviation). Standard deviation quantifies how dispersed a set of values is around its mean. A Z‑Score of +2 indicates a value two standard deviations above the mean, while -2 is two below. Traders use Z‑Scores to spot unusually high or low readings that may signal overbought or oversold conditions.
Moving averages smooth out price data to reveal trends. The Arnaud Legoux Moving Average (ALMA) reduces lag and noise through weighted averaging. A Zero‑Lag EMA (approximated here using a time‑shifted EMA) seeks to further minimize delay in following price. The RSI (Relative Strength Index) is a momentum oscillator that measures recent gains against losses over a set period.
ATR (Average True Range) gauges market volatility by averaging the range between high and low over a lookback period. Shadow bands built using ATR give a visual mood of volatility around a central trend line. Together, these tools inform a dynamic but statistically grounded view of market extremes.
Purpose
The main goal of this indicator is to help traders spot short‑term reversal opportunities on lower timeframes. By requiring both price and momentum (RSI) to exhibit statistically significant deviations from their norms, it filters out weak setups and focuses on higher‑probability mean‑reversion zones. Reversal signals appear when price deviates far enough from its hybrid moving average and RSI deviates similarly in the same direction. This makes it suitable for discretionary traders seeking clean entry cues in volatile environments.
Originality and Uniqueness
Uptrick: Dynamic Z‑Score Deviation distinguishes itself from standard reversal or mean‑reversion tools by combining several elements into a single framework:
A composite moving average (ALMA + Zero‑Lag EMA) for a smooth yet responsive baseline
Dual Z‑Score filters on price and RSI rather than relying on a single measure
Adaptive visual elements, including slope‑aware coloring, multi‑layer ATR shadows, and signal sizing based on combined Z‑Score magnitude
Most indicators focus on one aspect—price envelopes or RSI thresholds—whereas Uptrick: Dynamic Z‑Score Deviation requires both layers to align before signaling. Its visual design aids quick interpretation without overwhelming the chart.
Why these indicators were merged
Every component in Uptrick: Dynamic Z‑Score Deviation has a purpose:
• ALMA: provides a smooth moving average with reduced lag and fewer false crossovers than a simple SMA or EMA.
• Zero‑Lag EMA (ZLMA approximation): further reduces the delay relative to price by applying a time shift to EMA inputs. This keeps the composite MA closer to current price action.
• RSI and its EMA filter: RSI measures momentum. Applying an EMA filter on RSI smooths out false spikes and confirms genuine overbought or oversold momentum.
• Dual Z‑Scores: computing Z‑Scores on both the distance between price and the composite MA, and on smoothed RSI, ensures that signals only fire when both price and momentum are unusually stretched.
• ATR bands: using ATR‑based shadow layers visualizes volatility around the MA, guiding traders on potential support and resistance zones.
At the end, these pieces merge into a single indicator that detects statistically significant mean reversions while staying adaptive to real‑time volatility and momentum.
Calculations
1. Compute ALMA over the chosen MA length, offset, and sigma.
2. Approximate ZLMA by applying EMA to twice the price minus the price shifted by the MA length.
3. Calculate the composite moving average as the average of ALMA and ZLMA.
4. Compute raw RSI and smooth it with ALMA. Apply an EMA filter to raw RSI to reduce noise.
5. For both price and smoothed RSI, calculate the mean and standard deviation over the Z‑Score lookback period.
6. Compute Z‑Scores:
• z_price = (current price − composite MA mean) / standard deviation of price deviations
• z_rsi = (smoothed RSI − mean RSI) / standard deviation of RSI
7. Determine reversal conditions: both Z‑Scores exceed their thresholds in the same direction, RSI EMA is in oversold/overbought zones (below 40 or above 60), and price movement confirms directionality.
8. Compute signal strength as the sum of the absolute Z‑Scores, then classify into weak, medium, or strong.
9. Calculate ATR over the chosen period and multiply by layer multipliers to form shadow widths.
10.Derive slope over the chosen slope length and color the MA line and bars based on direction, optionally smoothing color transitions via EMA on RGB channels.
How this indicator actually works
1. The script begins by smoothing price data with ALMA and approximating a zero‑lag EMA, then averaging them for the main MA.
2. RSI is calculated, then smoothed and filtered.
3. Using a rolling window, the script computes statistical measures for both price deviations and RSI.
4. Z‑Scores tell how far current values lie from their recent norms.
5. When both Z‑Scores cross configured thresholds and momentum conditions align, reversal signals are flagged.
6. Signals are drawn with size and color reflecting strength.
7. The MA is plotted with dynamic coloring; ATR shadows are layered beneath to show volatility envelopes.
8. Bars can be colored to match MA slope, reinforcing trend context.
9. Alert conditions allow automated notifications when signals occur.
Inputs
Main Length: Main MA Length. Sets the period for ALMA and ZLMA.
RSI Length: RSI Length. Determines the lookback for momentum calculations.
Z-Score Lookback: Z‑Score Lookback. Window for mean and standard deviation computations.
Price Z-Score Threshold: Price Z‑Score Threshold. Minimum deviation required for price.
RSI Z-Score threshold: RSI Z‑Score Threshold. Minimum deviation required for momentum.
RSI EMA Filter Length: RSI EMA Filter Length. Smooths raw RSI readings.
ALMA Offset: Controls ALMA’s focal point in the window.
ALMA Sigma: Adjusts ALMA’s smoothing strength.
Show Reversal Signals : Toggle to display reversal signal markers.
Slope Sensitivity: Length for slope calculation. Higher values smooth slope changes.
Use Bar Coloring: Enables coloring of price bars based on MA slope.
Show MA Shadow: Toggle for ATR‑based shadow bands.
Shadow Layer Count: Number of shadow layers (1–4).
Base Shadow ATR Multiplier: Multiplier for ATR when sizing the first band.
Smooth Color Transitions (boolean): Smooths RGB transitions for line and shadows, if enabled.
ATR Length for Shadow: ATR Period for computing volatility bands.
Use Dynamic Signal Size: Toggles dynamic scaling of reversal symbols.
Features
Moving average smoothing: a hybrid of ALMA and Zero‑Lag EMA that balances responsiveness and noise reduction.
Slope coloring: MA line and optionally price bars change color based on trend direction; color transitions can be smoothed for visual continuity.
ATR shadow layers: translucent bands around the MA show volatility envelopes; up to four concentric layers help gauge distance from normal price swings.
Dual Z‑Score filters: price and momentum must both deviate beyond thresholds to trigger signals, reducing false positives.
Dynamic signal sizing: reversal markers scale in size based on the combined Z‑Score magnitude, making stronger signals more prominent.
Adaptive visuals: optional smoothing of color channels creates gradient effects on lines and fills for a polished look.
Alert conditions: built‑in buy and sell alerts notify traders when reversal setups emerge.
Conclusion
Uptrick: Dynamic Z‑Score Deviation delivers a structured way to identify short‑term reversal opportunities by fusing statistical rigor with adaptive smoothing and clear visual cues. It guides traders through multiple confirmation layers—hybrid moving average, dual Z‑Score analysis, momentum filtering, and volatility envelopes—while keeping the chart clean and informative.
Disclaimer
This indicator is provided for informational and educational purposes only and does not constitute financial advice. Trading carries risk and may not be suitable for all participants. Past performance is not indicative of future results. Always do your own analysis and risk management before making trading decisions.
Uptrick: FRAMA Matrix RSIUptrick: FRAMA Matrix RSI
Introduction
The Uptrick: FRAMA Matrix RSI is a momentum-based indicator that integrates the Relative Strength Index (RSI) with the Fractal Adaptive Moving Average (FRAMA). By applying FRAMA's adaptive smoothing to RSI—and further refining it with a Zero-Lag Moving Average (ZLMA)—this script creates a refined and reliable momentum oscillator. The indicator now includes enhanced divergence detection, potential reversal signals, customizable buy/sell signal options, an internal stats table, and a fully customizable bar coloring system for an enhanced visual trading experience.
Why Combine RSI with FRAMA
Traditional RSI is a well-known momentum indicator but has several limitations. It is highly sensitive to price fluctuations, often generating false signals in choppy or volatile markets. FRAMA, in contrast, adapts dynamically to price changes by adjusting its smoothing factor based on market conditions.
By integrating FRAMA into RSI calculations, this indicator reduces noise while preserving RSI's ability to track momentum, adapts to volatility by reducing lag in trending markets and smoothing out choppiness in ranging conditions, enhances trend-following capability for more reliable momentum shifts, and refines overbought and oversold signals by adjusting to the current market structure.
With the new enhancements, such as a manual alpha input, noise filtering, divergence detection, and multiple buy/sell signal options, the indicator offers even greater flexibility and precision for traders. This combination improves the standard RSI by making it more adaptive and responsive to market changes.
Originality
This indicator is unique because it applies FRAMA's adaptive smoothing technique to RSI, creating a dynamic momentum oscillator that adjusts to different market conditions. Many traditional RSI-based indicators either use fixed smoothing methods like exponential moving averages or employ basic RSI calculations without adjusting for volatility.
This script stands out by integrating several elements, including the fractal dimension-based smoothing of FRAMA to reduce noise while retaining responsiveness, the use of Zero-Lag Moving Average smoothing to enhance trend sensitivity and reduce lag, divergence detection to highlight mismatches between price action and RSI momentum, a noise filter and manual alpha option to prevent minor fluctuations from generating false signals, customizable buy/sell signal options that let traders choose between ZLMA-based or FRAMA RSI-based signals, an internal stats table displaying real-time FRAMA calculations such as fractal dimension and the adaptive alpha factor, and a fully customizable bar coloring system to visually distinguish bullish, bearish, and neutral conditions.
Features
Adaptive FRAMA RSI
The indicator applies FRAMA to RSI values, making the momentum oscillator adaptive to volatility while filtering out noise. Unlike a traditional RSI that reacts equally to all price movements, FRAMA RSI adjusts its smoothing factor based on market structure, making it more effective for identifying true momentum shifts.
Zero-Lag Moving Average (ZLMA)
A smoothing technique that minimizes lag while preserving the responsiveness of price movements. It is applied to the FRAMA RSI to further refine signals and ensure smoother trend detection.
Bullish and Bearish Threshold Crossovers
This system compares FRAMA RSI to a user-defined threshold (default is 50). When FRAMA RSI moves above the threshold, it indicates bullish momentum, while movement below signals bearish conditions. The enhanced noise filter ensures that only significant moves trigger signals.
Noise Filter and Manual Alpha
A new noise filter input prevents tiny fluctuations from triggering false signals. In addition, a manual alpha option allows traders to override the automatically computed smoothing factor with a custom value, providing extra control over the indicator’s sensitivity.
Divergence Detection
The indicator identifies divergence patterns by comparing FRAMA RSI pivots to price action. Bullish divergence occurs when price makes a lower low while FRAMA RSI makes a higher low, and bearish divergence occurs when price makes a higher high while FRAMA RSI makes a lower high. These signals can help traders anticipate potential reversals.
Reversal Signals
Labels appear on the chart when FRAMA RSI confirms classic RSI overbought (70) or oversold (30) conditions, providing visual cues for potential trend reversals.
Buy and Sell Signal Options
Traders can now choose between two signal-generation methods. ZLMA-based signals trigger when the ZLMA of FRAMA RSI crosses key overbought (70) or oversold (30) levels, while FRAMA RSI-based signals trigger when FRAMA RSI itself crosses these levels. This added flexibility allows users to tailor the indicator to their preferred trading style.
ZLMA:
FRAMA:
Customizable Alerts
Alerts notify traders when FRAMA RSI crosses key levels, divergence signals occur, reversal conditions are met, or buy/sell signals trigger. This ensures that important trading events are not missed.
Fully Customizable Bar Coloring System
Users can color bars based on different conditions, enhancing visual clarity. Bar coloring modes include: FRAMA RSI threshold (bars change color based on whether FRAMA RSI is above or below the threshold), ZLMA crossover (bars change when ZLMA crosses overbought or oversold levels), buy/sell signals (bars change when official signals trigger), divergence (bars highlight when bullish or bearish divergence is detected), and reversals (bars indicate when RSI reaches overbought or oversold conditions confirmed by FRAMA RSI). The system also remembers the last applied bar color, ensuring a smooth visual transition.
Input Parameters and Features
Core Inputs
RSI Length (default: 14) defines the period for RSI calculations.
FRAMA Lookback (default: 16) determines the length for the FRAMA smoothing function.
RSI Bull Threshold (default: 50) sets the level above which the market is considered bullish and below which it is bearish.
Noise Filter (default: 1.0) ensures that small fluctuations do not trigger false bullish or bearish signals.
Additional Features
Show Bull and Bear Alerts (default: true) enables notifications when FRAMA RSI crosses the threshold.
Enable Divergence Detection (default: false) highlights bullish and bearish divergences based on price and FRAMA RSI pivots.
Show Potential Reversal Signals (default: false) identifies overbought (70) and oversold (30) levels as possible trend reversal points.
Buy and Sell Signal Option (default: ZLMA) allows traders to choose between ZLMA-based signals or FRAMA RSI-based signals for trade entry.
ZLMA Enhancements
ZLMA Length (default: 14) determines the period for the Zero-Lag Moving Average applied to FRAMA RSI.
Visualization Options
Show Internal Stats Table (default: false) displays real-time FRAMA calculations, including fractal dimension and the adaptive alpha smoothing factor.
Show Threshold FRAMA Signals (default: false) plots buy and sell labels when FRAMA RSI crosses the threshold level.
How It Works
FRAMA Calculation
FRAMA dynamically adjusts smoothing based on the price fractal dimension. The alpha smoothing factor is derived from the fractal dimension or can be set manually to maintain responsiveness.
RSI with FRAMA Smoothing
RSI is calculated using the user-defined lookback period. FRAMA is then applied to the RSI to make it more adaptive to volatility. Optionally, ZLMA is applied to further refine the signals and reduce lag.
Bullish and Bearish Threshold Crosses
A bullish condition occurs when FRAMA RSI crosses above the threshold, while a bearish condition occurs when it falls below. The noise filter ensures that only significant trend shifts generate signals.
Buy and Sell Signal Options
Traders can choose between ZLMA crossovers or FRAMA RSI crossovers as the basis for buy and sell signals, offering flexibility in trade entry timing.
Divergence Detection
The indicator identifies divergences where price action and FRAMA RSI momentum do not align, potentially signaling upcoming reversals.
Reversal Signal Labels
When classic RSI overbought or oversold levels are confirmed by FRAMA RSI conditions, reversal labels are added on the chart to highlight potential exhaustion points.
Bar Coloring System
Bars are dynamically colored based on various conditions such as RSI thresholds, ZLMA crossovers, buy/sell signals, divergence, and reversals, allowing traders to quickly interpret market sentiment.
Alerts and Internal Stats
Customizable alerts notify traders of key events, and an optional internal stats table displays real-time calculations (fractal dimension, alpha value, and RSI values) to help users understand the underlying dynamics of the indicator.
Summary
The Uptrick: FRAMA Matrix RSI offers an enhanced approach to momentum analysis by combining RSI with adaptive FRAMA smoothing and additional layers of signal refinement. The indicator now includes adaptive RSI smoothing to reduce noise and improve responsiveness, Zero-Lag Moving Average filtering to minimize lag, divergence and reversal detection to identify potential turning points, customizable buy/sell signal options that let traders choose between different signal methodologies, a fully customizable bar coloring system to visually distinguish market conditions, and an internal stats table for real-time insight into FRAMA calculation parameters.
Whether used for trend confirmation, divergence detection, or momentum-based strategies, this indicator provides a powerful and adaptive approach to trading.
Disclaimer
This script is for informational and educational purposes only. Trading involves risk, and past performance does not guarantee future results. Always conduct proper research and consult with a financial advisor before making trading decisions.

Nonlinear Regression, Zero-lag Moving Average [Loxx]Nonlinear Regression and Zero-lag Moving Average
Technical indicators are widely used in financial markets to analyze price data and make informed trading decisions. This indicator presents an implementation of two popular indicators: Nonlinear Regression and Zero-lag Moving Average (ZLMA). Let's explore the functioning of these indicators and discuss their significance in technical analysis.
Nonlinear Regression
The Nonlinear Regression indicator aims to fit a nonlinear curve to a given set of data points. It calculates the best-fit curve by minimizing the sum of squared errors between the actual data points and the predicted values on the curve. The curve is determined by solving a system of equations derived from the data points.
We define a function "nonLinearRegression" that takes two parameters: "src" (the input data series) and "per" (the period over which the regression is calculated). It calculates the coefficients of the nonlinear curve using the least squares method and returns the predicted value for the current period. The nonlinear regression curve provides insights into the overall trend and potential reversals in the price data.
Zero-lag Moving Average (ZLMA)
Moving averages are widely used to smoothen price data and identify trend directions. However, traditional moving averages introduce a lag due to the inclusion of past data. The Zero-lag Moving Average (ZLMA) overcomes this lag by dynamically adjusting the weights of past values, resulting in a more responsive moving average.
We create a function named "zlma" that calculates the ZLMA. It takes two parameters: "src" (the input data series) and "per" (the period over which the ZLMA is calculated). The ZLMA is computed by first calculating a weighted moving average (LWMA) using a linearly decreasing weight scheme. The LWMA is then used to calculate the ZLMA by applying the same weight scheme again. The ZLMA provides a smoother representation of the price data while reducing lag.
Combining Nonlinear Regression and ZLMA
The ZLMA is applied to the input data series using the function "zlma(src, zlmaper)". The ZLMA values are then passed as input to the "nonLinearRegression" function, along with the specified period for nonlinear regression. The output of the nonlinear regression is stored in the variable "out".
To enhance the visual representation of the indicator, colors are assigned based on the relationship between the nonlinear regression value and a signal value (sig) calculated from the previous period's nonlinear regression value. If the current "out" value is greater than the previous "sig" value, the color is set to green; otherwise, it is set to red.
The indicator also includes optional features such as coloring the bars based on the indicator's values and displaying signals for potential long and short positions. The signals are generated based on the crossover and crossunder of the "out" and "sig" values.
Wrapping Up
This indicator combines two important concepts: Nonlinear Regression and Zero-lag Moving Average indicators, which are valuable tools for technical analysis in financial markets. These indicators help traders identify trends, potential reversals, and generate trading signals. By combining the nonlinear regression curve with the zero-lag moving average, this indicator provides a comprehensive view of the price dynamics. Traders can customize the indicator's settings and use it in conjunction with other analysis techniques to make well-informed trading decisions.

RedK DIY ZLMA: Customizable Zero-Lag MA (Educational / Utility)This script is more of an educational / utility piece rather than a fully-fledged indicator - It provides an easy way to customize and produce a zero-lag Moving average that can then be used in various scenarios
What is DIY_ZLMA?
------------------------
The DIY ZLMA is for fans and enthusiasts of researching Moving Averages (like me) - the script enables the user to play around with one of the common approaches used to reduce lag in moving averages - which was explained in this old post below
Suggested uses of the DIY_ZLMA
---------------------------------------
* The Zero-lag approach here applies 3 moving average passes to a source data series - I'll refer to these 3 passes as Base MA Pass , De-lagging Pass, and Smoothing Pass - these "passes" can be customized from the indicator settings in terms of MA Length and type. The first pass allows the choice of a "source", and the second pass allows additional fine tuning by playing around with the magnification factor. The 3rd pass (smoothing) is optional and can be skipped altogether when needed. (as noted in the script, HMA and TEMA, which are very common low-lag MA's use slightly different approach in the calculation than the one used here .. so we can't get an equivalent of either of these MA's with the customization of DIY_ZLMA parameters)
* After the user experiments with the various settings for the 3 passes, and finds a "preferred combination", the script not only plots the resulting My_ZLMA - it also produces the "1-line Pine script formula" that the user can then use in any other script, maybe to smoothen some data series, or to combine with other types of moving averages to create multi-MA cross-over trading signals... and so on.
* The DIY_ZLMA can also be added to another indicator as a signal line using the Indicator-on-Indicator feature of TradingView (review this post for step-by-step -->
)
* the script also showcases couple of recent (and very neat) Pine features: the use of User-defined Types (UDT) and User-defined Methods - which are awesome and a lot of fun to work with :)
Since this is more of a utility piece, I added as many comments as possible to the script to explain the way it works - so it's more valuable if someone finds it by searching the "Add Indicator" feature in TradingView charts
Please feel free to play around with this new toy :) and share comments and feedback below if you find this useful. I truly hope you do.

Zero Lag Detrended Price Oscillator (ZL DPO)This indicator attempts to create a zero lag Detrended price oscillator using 2 different scripts. I actually really like the results so far. I hope you all find it useful too.
Green>Red = long
Red>Green = short
The lines on the example chart are some of the signals that the indicator gave on default settings.
The greens are wins, reds are outright losses, and blues are "scratch" trades(signal for other side before hitting stop loss).
All of the signals tested were using NNFX money management to see if they are wins or losses(1.5x atr for SL and 1 Atr for TP).

RedK Dual-Color Zero-Lag Moving Average (RedK ZLMA v1)Here's my Dual-color Zero-Lag Moving Average indicator - with alerts - as a separate study
This is published in response to couple of requests i received. Please refer to previous posts on TA Basics on creating zero-lag MAs for more background.
This version adds couple of extras
---------------------------------------------
- the ability to choose the price being used (close vs hl2, hlc3..etc)
- ability to change resolution
the example chart below on the right uses a weekly resolution for the ZLMA on top of a daily chart - the left chart shows the same view but with the ZLMA resolution set to "same as chart"
- Alerts-enabled for when trend change is detected
- optional smoothing - keep the smoothing low (3 or 4) else it introduces lagging again
i hope some will find this useful
- the code is light and can easily be integrated into other indicators of your own - or you can add this ZLMA to your charts in combination with other MA's you use to easily identify trends and swings.
let me know your feedback.
Good luck!

TA Basics: Evolving our Zero Lag Moving Average.In the previous Zero-Lag MA post, we introduced the "mirroring" technique and the associated calculation.
In this post, we will see how we can use the same technique, with a slight variation, to evolve our zero lag moving average line, add more "smoothness" and still maintaining the low lag and fast response to data series changes.
to use the "mirroring" technique, we need to use 2 MA lines with varying speeds - this is essential to produce the delta between the lines, that can then be mirrored around the fast line to produce the final line. in the first example, we used a Simple MA (slow) and a Weighted MA (fast) of the same length to achieve that.
here we introduce a different way of doing that. we will use a Weighted MA of the length (slow) and another Weighted MA of half the length (fast) -- the difference in "speed" between these 2 lines should produce the delta we need, we mirror it around the fast line, and we get our desired Zero-lag line. Check!
then while we're at it, why don't we introduce an additional smoothing just to ensure the new line is not too "broken" and jumpy .. and flows smoothly across the data series. but what length should we use for smoothing?
smoothing length should be enough to make an actual smoothing effect, but not too large else it will introduce lagging on its own. how about 3? usually 3 or 4 are good values for smoothing. A brilliant idea here is to use a number related to the same input length of the original line, which can always be relatively small -- the square root (integer portion) of that original length - and in that case, the user will only need to enter 1 input for the moving average, just the length - everything will be calculated from there. Check again!
I commented the code if you like to follow the simplified build-up of the formula, now that the concept is explained.
the (more complex-looking) 1-line, condensed form of that formula to use is (alert: watch out for the ()'s -- they're tricky :) )
----------------------------------------------
ZLMA_Line = wma((2*wma(close,int(length/2)) - wma(close,length)), int(sqrt(length)))
------------------------------------------
the one thing i do not like about this technique, is that we introduce the use of the half length MA. i do not like to build indicators that make decisions like this on behalf of the trader - the trader wants to analyze the data for a specific length, and we should continue to stick to that consistently across the moving average (or whatever indicator) calculation. I would always be caution about "hardcoding" some optional values (in this case 0.5 * length) within the indicator itself - others may not mind that.
Now to a nice surprise for the patient folks who got so far in this post - Congratulations, we have just discovered the concept and the formula behind the famous Hull Moving Average .. the big thing here is, we just had the opportunity to learn how to create the whole thing ourselves from the ground up step by step, and had fun doing it (I hope!)
-- these posts are meant to provide those who are new to the world of technical analysis and want to learn how and why to build their own technical indicators. i hope some of you find them useful and interesting, and i wish you the best of luck.

Zero Lag Keltner ChannelsThis is Keltner Channelz (KC) with Zero Lag Moving Average (ZLMA as base). It is smoother and has less lag than the original (EMA/SMA) variant.
It also can be used as a trend indicator and trend confirmation indicator. The upper and lower bands are green if it is an up trend, and red if a down trend. If both have the same color it is a stronger trend.