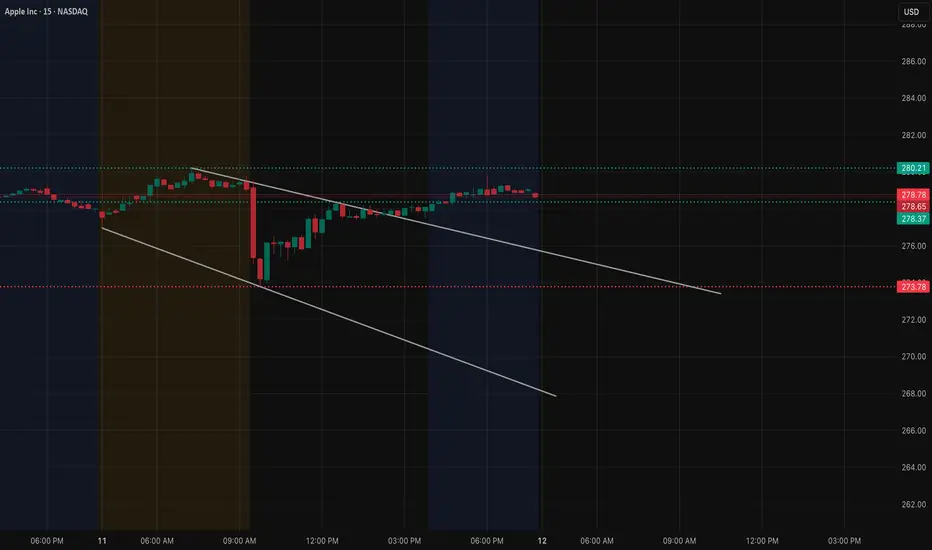
AAPL has been sliding inside a downward channel on the 15-minute timeframe ever since the sharp selloff earlier in the session. Price continues to respect the channel structure, making lower highs while holding the lower boundary as support. The most recent rally pushed AAPL back toward the mid-channel zone, but buyers have not yet shown the strength needed to break the descending trendline.
The 278.5–279 zone is the pivotal resistance. Each attempt to push above this area fades quickly, showing that sellers are defending it. Until AAPL can break this level and close above the upper channel boundary, the broader structure remains bearish.
On the downside, the lower boundary of the channel aligns with 273.5–274, which acted as the main support zone earlier in the day. If AAPL loses 276, momentum can pull price back toward this support. A breakdown below 273.5 would confirm continuation inside the descending channel.
The options landscape (GEX) aligns closely with these turning points.

The 280 level — just above the descending trendline — shows up as the strongest positive gamma resistance. When price approaches these higher gamma regions, dealer hedging tends to absorb volatility and slow the move. This explains why AAPL continues to struggle moving above the mid-channel zone and why every test into 279–280 has stalled.
Above that, the next major gamma concentrations appear around 282.5 and 285. For AAPL to reach these zones, it would need to break out of the channel structure, reclaim 279–280, and establish support. If that happens, hedging dynamics shift and upward volatility becomes more likely.
On the downside, negative gamma pockets sit around 275 and again at 273.5. These zones match the lower boundaries of the channel. If price falls below 276, dealer hedging can begin to amplify volatility instead of containing it, allowing AAPL to accelerate toward 275 and potentially 273.5.
When price structure and GEX positioning point to the same inflection points, the roadmap becomes clear:
• Holding below the descending trendline keeps the bearish structure in control
• Breaking and holding above 279–280 shifts momentum upward toward 282.5
• Dropping below 276 opens room for a retest of 275 • Losing 275 exposes the channel support around 273.5
AAPL has been coiling between resistance at the mid-channel and support near the lower boundary. Dec 12 will likely be decided by which side gives first.
This analysis is for educational purposes only and not financial advice.
The 278.5–279 zone is the pivotal resistance. Each attempt to push above this area fades quickly, showing that sellers are defending it. Until AAPL can break this level and close above the upper channel boundary, the broader structure remains bearish.
On the downside, the lower boundary of the channel aligns with 273.5–274, which acted as the main support zone earlier in the day. If AAPL loses 276, momentum can pull price back toward this support. A breakdown below 273.5 would confirm continuation inside the descending channel.
The options landscape (GEX) aligns closely with these turning points.
The 280 level — just above the descending trendline — shows up as the strongest positive gamma resistance. When price approaches these higher gamma regions, dealer hedging tends to absorb volatility and slow the move. This explains why AAPL continues to struggle moving above the mid-channel zone and why every test into 279–280 has stalled.
Above that, the next major gamma concentrations appear around 282.5 and 285. For AAPL to reach these zones, it would need to break out of the channel structure, reclaim 279–280, and establish support. If that happens, hedging dynamics shift and upward volatility becomes more likely.
On the downside, negative gamma pockets sit around 275 and again at 273.5. These zones match the lower boundaries of the channel. If price falls below 276, dealer hedging can begin to amplify volatility instead of containing it, allowing AAPL to accelerate toward 275 and potentially 273.5.
When price structure and GEX positioning point to the same inflection points, the roadmap becomes clear:
• Holding below the descending trendline keeps the bearish structure in control
• Breaking and holding above 279–280 shifts momentum upward toward 282.5
• Dropping below 276 opens room for a retest of 275 • Losing 275 exposes the channel support around 273.5
AAPL has been coiling between resistance at the mid-channel and support near the lower boundary. Dec 12 will likely be decided by which side gives first.
This analysis is for educational purposes only and not financial advice.
כתב ויתור
המידע והפרסומים אינם מיועדים להיות, ואינם מהווים, ייעוץ או המלצה פיננסית, השקעתית, מסחרית או מכל סוג אחר המסופקת או מאושרת על ידי TradingView. קרא עוד ב־תנאי השימוש.
כתב ויתור
המידע והפרסומים אינם מיועדים להיות, ואינם מהווים, ייעוץ או המלצה פיננסית, השקעתית, מסחרית או מכל סוג אחר המסופקת או מאושרת על ידי TradingView. קרא עוד ב־תנאי השימוש.