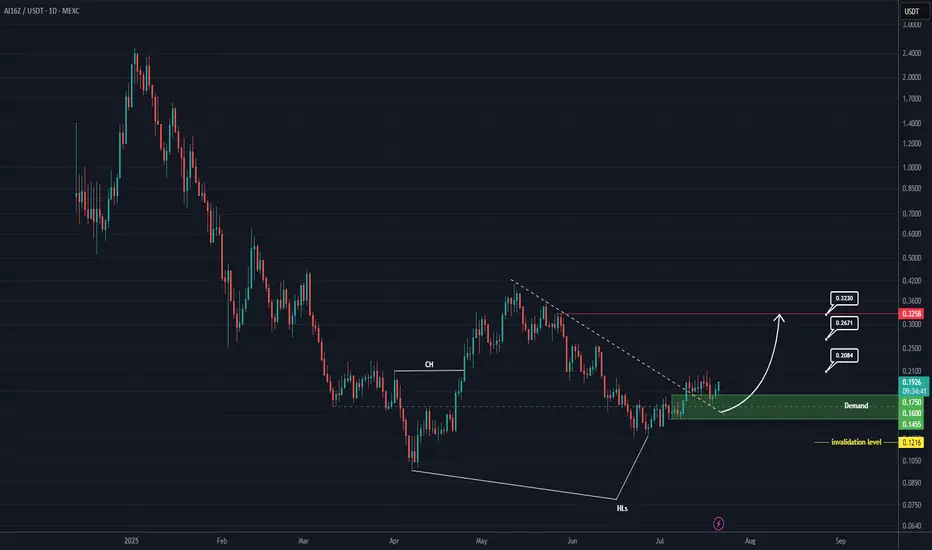
Given the bullish CH, the breakout of the trendline, and the formation of a support zone, it appears that this token is aiming to move toward the targets marked on the chart.
Additionally, a double bottom pattern is visible at the lows, and higher lows have been recorded for this asset.
A daily candle closing below the invalidation level would invalidate this analysis.
For risk management, please don't forget stop loss and capital management
When we reach the first target, save some profit and then change the stop to entry
Comment if you have any questions
Thank You
🔆To succeed in trading, just enter our Telegram channel:
Free membership: t.me/Behdark_EN
🔷Our Telegram channel has daily spot and futures signals 👉 t.me/Behdark_EN
💎 Exclusive signals are only shared on our Telegram channel
Free membership: t.me/Behdark_EN
🔷Our Telegram channel has daily spot and futures signals 👉 t.me/Behdark_EN
💎 Exclusive signals are only shared on our Telegram channel
כתב ויתור
המידע והפרסומים אינם אמורים להיות, ואינם מהווים, עצות פיננסיות, השקעות, מסחר או סוגים אחרים של עצות או המלצות שסופקו או מאושרים על ידי TradingView. קרא עוד בתנאים וההגבלות.