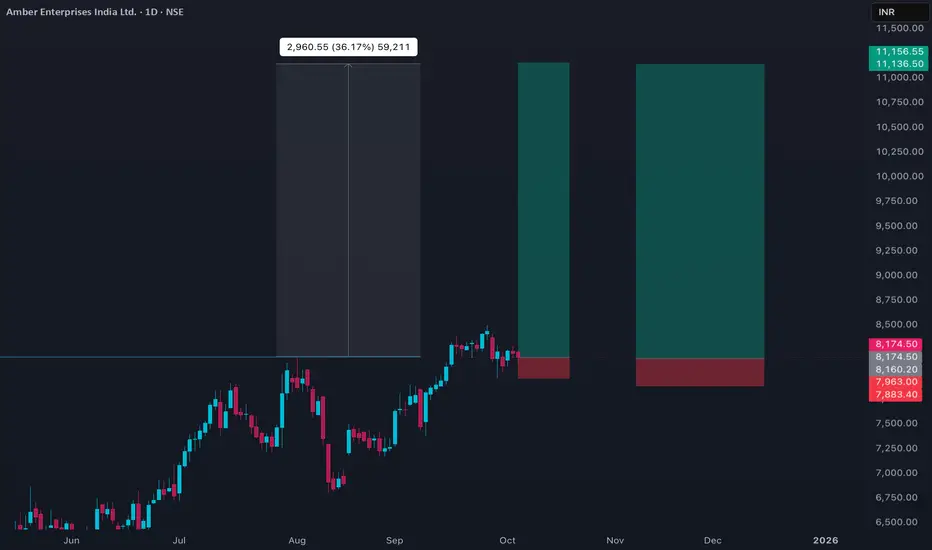
Amber Enterprises India (AMBER) detailed price analysis as on October 7, 2025:
- The stock is trading near ₹8,172 to ₹8,175 levels on BSE and NSE with a slight decline of about 0.49% compared to the previous close.
- The day’s trading range was between ₹8,054.6 (day low) and ₹8,240.5 (day high) on BSE, and ₹8,081 to ₹8,243.5 on NSE.
- The stock opened around ₹8,214 and showed mild intraday volatility within this range.
- The 50-day moving average is near ₹7,720 and the 200-day moving average near ₹6,930, indicating a strong uptrend in the medium to long term.
- The Price-to-Earnings (P/E) ratio remains high at about 101, reflecting rich valuation.
- The stock showed moderate volume compared to average, signaling steady participation but no strong directional bias today.
- Long-term fundamentals remain solid with consistent revenue and earnings growth.
- Resistance is near the recent highs around ₹8,490, with support levels near ₹7,700 to ₹7,900.
- The overall price behavior suggests consolidation with a slight bearish tilt on the day, but medium-term bullish momentum stays intact.
This analysis captures the current sideways-to-slightly-negative price action within a broader uptrend context for AMBER on this date.
כתב ויתור
המידע והפרסומים אינם אמורים להיות, ואינם מהווים, עצות פיננסיות, השקעות, מסחר או סוגים אחרים של עצות או המלצות שסופקו או מאושרים על ידי TradingView. קרא עוד בתנאים וההגבלות.
כתב ויתור
המידע והפרסומים אינם אמורים להיות, ואינם מהווים, עצות פיננסיות, השקעות, מסחר או סוגים אחרים של עצות או המלצות שסופקו או מאושרים על ידי TradingView. קרא עוד בתנאים וההגבלות.