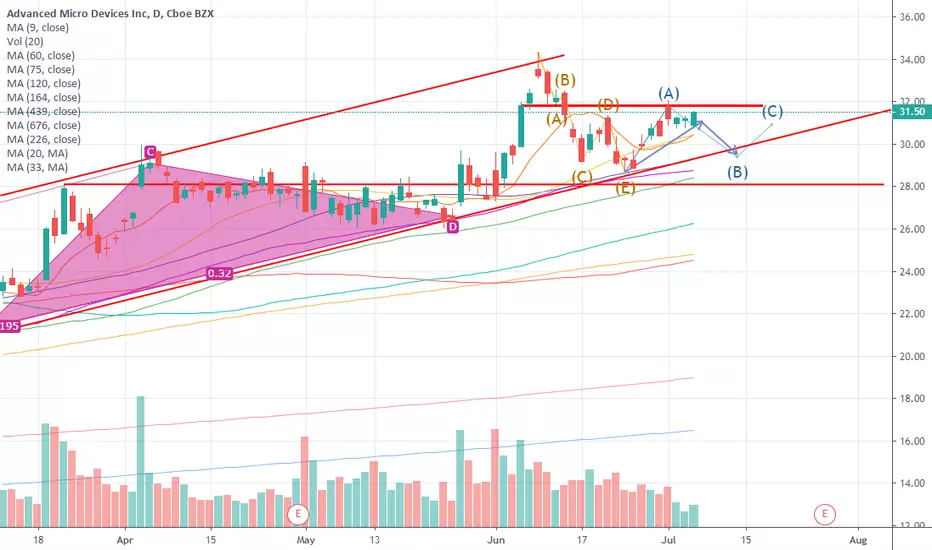
05-JUL
Price trend forecast timing analysis based on pretiming algorithm of Supply-Demand(S&D) strength.
Investing position: In Falling section of high risk & low profit
S&D strength Trend: In the midst of a rebounding trend of upward direction box pattern price flow marked by limited falls and upward fluctuations.
Downward trend coming soon.
Today's S&D strength Flow: Supply-Demand(S&D) strength flow appropriate to the current trend.
read more: pretiming.com/search?q=amd
D+1 Candlestick Color forecast: RED Candlestick
%D+1 Range forecast: 2.9% (HIGH) ~ 0.8% (LOW), 0.5% (CLOSE)
%AVG in case of rising: 3.1% (HIGH) ~ -1.0% (LOW), 1.7% (CLOSE)
%AVG in case of falling: 1.7% (HIGH) ~ -2.6% (LOW), -2.0% (CLOSE)
הערה
08-JULPrice trend forecast timing analysis based on pretiming algorithm of Supply-Demand(S&D) strength.
Investing position: In Falling section of high risk & low profit so far. But it would be in rising section tomorrow
S&D strength Trend: In the midst of a rebounding trend of upward direction box pattern price flow marked by limited falls and upward fluctuations.
Today's S&D strength Flow: Supply-Demand(S&D) strength flow appropriate to the current trend.
read more: pretiming.com/search?q=amd
D+1 Candlestick Color forecast: RED Candlestick
%D+1 Range forecast: 2.1% (HIGH) ~ 0.6% (LOW), 0.9% (CLOSE)
%AVG in case of rising: 3.1% (HIGH) ~ -1.0% (LOW), 1.7% (CLOSE)
%AVG in case of falling: 1.7% (HIGH) ~ -2.5% (LOW), -2.0% (CLOSE)
כתב ויתור
המידע והפרסומים אינם אמורים להיות, ואינם מהווים, עצות פיננסיות, השקעות, מסחר או סוגים אחרים של עצות או המלצות שסופקו או מאושרים על ידי TradingView. קרא עוד בתנאים וההגבלות.
כתב ויתור
המידע והפרסומים אינם אמורים להיות, ואינם מהווים, עצות פיננסיות, השקעות, מסחר או סוגים אחרים של עצות או המלצות שסופקו או מאושרים על ידי TradingView. קרא עוד בתנאים וההגבלות.