Detailed Market Structure Breakdown
4-Hour Chart (Macro Trend)
Structure: The Bank Nifty is in a confirmed bullish bounce phase. The index has decisively broken out of the steep descending channel and closed strongly above the key 55,400 level. This action signals a powerful Break of Structure (BOS), establishing a new leg up from the 54,250 demand zone.
Key Levels:
Major Supply (Resistance): 55,800 - 56,000. This remains the key overhead supply zone from the September highs (Order Block).
Major Demand (Support): 54,250 - 54,400. This is the key reversal low. The immediate short-term support is 54,800 - 55,000.
Outlook: The medium-term bias has shifted to strongly bullish. The consolidation is complete, and the index is now targeting the 56,000 zone.
1-Hour Chart (Intermediate View)
Structure: The 1H chart shows a clear Break of Structure (BOS) on the upside, as the price broke the descending trendline and key horizontal resistance. The index is now trading within a clear ascending channel, making higher highs and higher lows.
Key Levels:
Immediate Resistance: 55,800.
Immediate Support: 55,400 - 55,500 (This area was a major point of contention and is now expected to act as support).
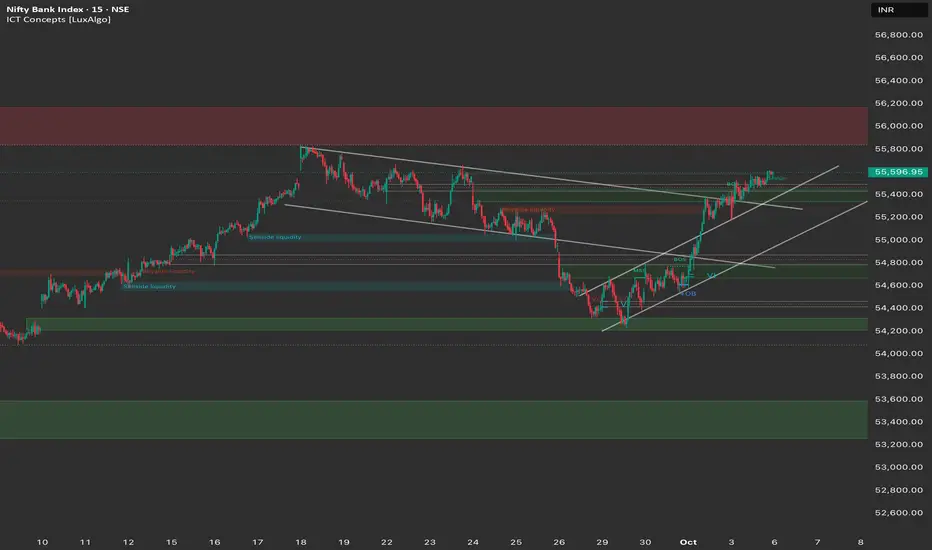
15-Minute Chart (Intraday View)
Structure: The 15M chart shows strong bullish momentum, with the price breaking out of a triangular consolidation pattern. The price has successfully reclaimed key liquidity levels and is poised for continuation.
Key Levels:
Intraday Supply: 55,800.
Intraday Demand: 55,400.
Outlook: Strongly Bullish.
📈 Trade Plan (Monday, 6th October)
Market Outlook: The Bank Nifty is in a powerful bullish phase, showing relative strength compared to Nifty. The primary strategy will be to buy on dips or buy on continuation.
Bullish Scenario (Primary Plan)
Justification: The confirmed reversal, breakout from the descending channel, and strong close near the day's high all point to a move toward the major supply zone.
Entry: Long entry on a decisive break and 15-minute candle close above 55,800. Alternatively, look for a dip entry near 55,400 (the recent breakout level).
Stop Loss (SL): Place a stop loss below 55,200 (below the immediate FVG/swing low).
Targets:
T1: 56,000 (Psychological resistance/Order Block).
T2: 56,200 (Extension target).
T3: 56,500 (Upper resistance).
Bearish Scenario (Counter-Trend Plan)
Justification: This high-risk, counter-trend plan only becomes valid if the rally fails dramatically at the open.
Trigger: A decisive break and 1-hour candle close below 55,100.
Entry: Short entry below 55,100.
Stop Loss (SL): Above 55,400.
Targets:
T1: 54,800 (Minor support/FVG).
T2: 54,400 (Key reversal support).
Key Levels for Observation:
Immediate Decision Point: 55,500 - 55,800 zone.
Bullish Confirmation: A break and sustained move above 55,800.
Bearish Warning: A move below 55,200 suggests a reversal failure and consolidation.
Line in the Sand: 55,000. Below this level, the short-term bias shifts back to neutral-to-bearish.
4-Hour Chart (Macro Trend)
Structure: The Bank Nifty is in a confirmed bullish bounce phase. The index has decisively broken out of the steep descending channel and closed strongly above the key 55,400 level. This action signals a powerful Break of Structure (BOS), establishing a new leg up from the 54,250 demand zone.
Key Levels:
Major Supply (Resistance): 55,800 - 56,000. This remains the key overhead supply zone from the September highs (Order Block).
Major Demand (Support): 54,250 - 54,400. This is the key reversal low. The immediate short-term support is 54,800 - 55,000.
Outlook: The medium-term bias has shifted to strongly bullish. The consolidation is complete, and the index is now targeting the 56,000 zone.
1-Hour Chart (Intermediate View)
Structure: The 1H chart shows a clear Break of Structure (BOS) on the upside, as the price broke the descending trendline and key horizontal resistance. The index is now trading within a clear ascending channel, making higher highs and higher lows.
Key Levels:
Immediate Resistance: 55,800.
Immediate Support: 55,400 - 55,500 (This area was a major point of contention and is now expected to act as support).
15-Minute Chart (Intraday View)
Structure: The 15M chart shows strong bullish momentum, with the price breaking out of a triangular consolidation pattern. The price has successfully reclaimed key liquidity levels and is poised for continuation.
Key Levels:
Intraday Supply: 55,800.
Intraday Demand: 55,400.
Outlook: Strongly Bullish.
📈 Trade Plan (Monday, 6th October)
Market Outlook: The Bank Nifty is in a powerful bullish phase, showing relative strength compared to Nifty. The primary strategy will be to buy on dips or buy on continuation.
Bullish Scenario (Primary Plan)
Justification: The confirmed reversal, breakout from the descending channel, and strong close near the day's high all point to a move toward the major supply zone.
Entry: Long entry on a decisive break and 15-minute candle close above 55,800. Alternatively, look for a dip entry near 55,400 (the recent breakout level).
Stop Loss (SL): Place a stop loss below 55,200 (below the immediate FVG/swing low).
Targets:
T1: 56,000 (Psychological resistance/Order Block).
T2: 56,200 (Extension target).
T3: 56,500 (Upper resistance).
Bearish Scenario (Counter-Trend Plan)
Justification: This high-risk, counter-trend plan only becomes valid if the rally fails dramatically at the open.
Trigger: A decisive break and 1-hour candle close below 55,100.
Entry: Short entry below 55,100.
Stop Loss (SL): Above 55,400.
Targets:
T1: 54,800 (Minor support/FVG).
T2: 54,400 (Key reversal support).
Key Levels for Observation:
Immediate Decision Point: 55,500 - 55,800 zone.
Bullish Confirmation: A break and sustained move above 55,800.
Bearish Warning: A move below 55,200 suggests a reversal failure and consolidation.
Line in the Sand: 55,000. Below this level, the short-term bias shifts back to neutral-to-bearish.
כתב ויתור
המידע והפרסומים אינם אמורים להיות, ואינם מהווים, עצות פיננסיות, השקעות, מסחר או סוגים אחרים של עצות או המלצות שסופקו או מאושרים על ידי TradingView. קרא עוד בתנאים וההגבלות.
כתב ויתור
המידע והפרסומים אינם אמורים להיות, ואינם מהווים, עצות פיננסיות, השקעות, מסחר או סוגים אחרים של עצות או המלצות שסופקו או מאושרים על ידי TradingView. קרא עוד בתנאים וההגבלות.