Detailed Market Structure Breakdown
4-Hour Chart (Macro Trend)
Structure: The Bank Nifty is in a Strong Bullish Momentum phase. The aggressive selling seen last week (the large red candle on the 4H chart) has been completely negated by the sharp recovery and the successful defense of the 57,400 area. The price is trading within a steep ascending channel, having established a clear structure of higher highs and higher lows.
Key Levels:
Major Supply (Resistance): 58,577 - 58,700 (The All-Time High zone). This area is the immediate and most critical overhead hurdle. A decisive breakout above this level is needed to target 59,000.
Major Demand (Support): 57,800 - 58,000. This area, which includes the lower channel trendline and the strong momentum starting point, is the must-hold zone for the short-term uptrend.
Outlook: The short-term bias is Strongly Bullish. The market is poised to challenge the All-Time High, possibly today.
1-Hour Chart (Intermediate View)
Structure: The 1H chart shows consolidation near the upper boundary of the ascending channel. The close was strong, indicating buyer conviction remains high. The index is forming a bullish flag/pennant continuation pattern right below the ATH zone.
Key Levels:
Immediate Resistance: 58,577 (All-Time High).
Immediate Support: 58,100 (Recent swing low/lower channel boundary).
15-Minute Chart (Intraday View)
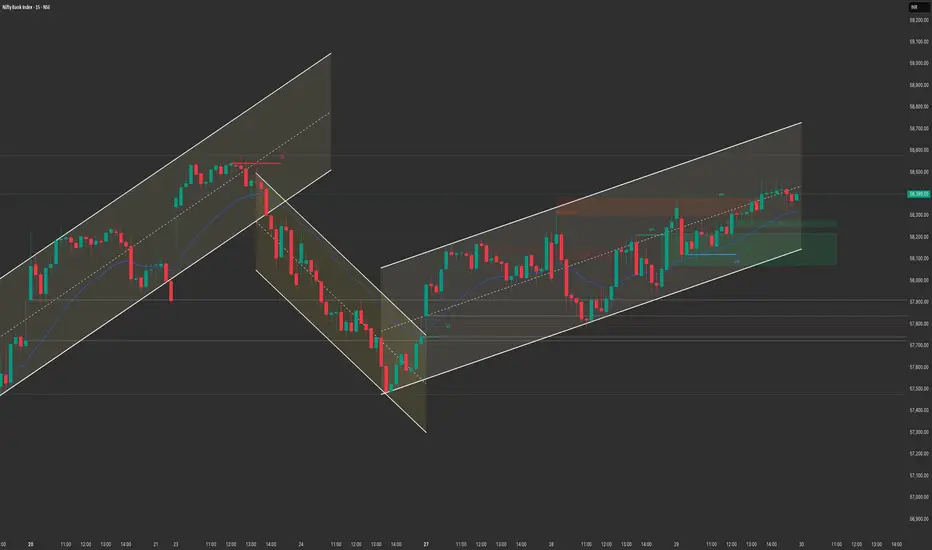
Structure: The 15M chart confirms the tight bullish consolidation. The price is trading above its key moving averages and within a tight, ascending channel. The structure is ideal for a momentum breakout.
Key Levels:
Intraday Supply: 58,500 - 58,577.
Intraday Demand: 58,200.
Outlook: Aggressively Bullish.
📈 Structure Analysis & Trade Plan: 30th October
Market Outlook: Bank Nifty is displaying extreme bullish momentum and is positioned right at the All-Time High resistance. The US Fed decision is a key global event today, which may introduce significant volatility. The primary strategy is to buy the breakout.
Bullish Scenario (Primary Plan: Breakout/Continuation)
Justification: The strong V-shaped recovery and the tight consolidation right below the ATH strongly favor a breakout.
Entry: Long entry on a decisive break and 15-minute candle close above 58,600 (breaking the ATH). Alternatively, look for a dip entry near 58,100 - 58,200 (the lower channel trendline/consolidation support).
Stop Loss (SL): Place a stop loss below 57,900 (below the main channel support).
Targets:
T1: 59,000 (Psychological target).
T2: 59,300 (Extension target).
Bearish Scenario (Counter-Trend/Reversal)
Justification: High-risk. Only valid if the Fed decision is hawkish, causing a sharp rejection from the ATH zone.
Trigger: A sustained break and 1-hour close back below 57,800.
Entry: Short entry below 57,800.
Stop Loss (SL): Above 58,200.
Targets:
T1: 57,500 (Previous swing low).
T2: 57,300 (Major FVG support).
Key Levels for Observation:
Immediate Decision Point: 58,300 - 58,600 zone.
Bullish Confirmation: Sustained trade above 58,600.
Bearish Warning: A move below 57,800.
Line in the Sand: 57,800.
Crucial Event: US Federal Reserve policy meeting outcome (post-market hours, will affect volatility).
4-Hour Chart (Macro Trend)
Structure: The Bank Nifty is in a Strong Bullish Momentum phase. The aggressive selling seen last week (the large red candle on the 4H chart) has been completely negated by the sharp recovery and the successful defense of the 57,400 area. The price is trading within a steep ascending channel, having established a clear structure of higher highs and higher lows.
Key Levels:
Major Supply (Resistance): 58,577 - 58,700 (The All-Time High zone). This area is the immediate and most critical overhead hurdle. A decisive breakout above this level is needed to target 59,000.
Major Demand (Support): 57,800 - 58,000. This area, which includes the lower channel trendline and the strong momentum starting point, is the must-hold zone for the short-term uptrend.
Outlook: The short-term bias is Strongly Bullish. The market is poised to challenge the All-Time High, possibly today.
1-Hour Chart (Intermediate View)
Structure: The 1H chart shows consolidation near the upper boundary of the ascending channel. The close was strong, indicating buyer conviction remains high. The index is forming a bullish flag/pennant continuation pattern right below the ATH zone.
Key Levels:
Immediate Resistance: 58,577 (All-Time High).
Immediate Support: 58,100 (Recent swing low/lower channel boundary).
15-Minute Chart (Intraday View)
Structure: The 15M chart confirms the tight bullish consolidation. The price is trading above its key moving averages and within a tight, ascending channel. The structure is ideal for a momentum breakout.
Key Levels:
Intraday Supply: 58,500 - 58,577.
Intraday Demand: 58,200.
Outlook: Aggressively Bullish.
📈 Structure Analysis & Trade Plan: 30th October
Market Outlook: Bank Nifty is displaying extreme bullish momentum and is positioned right at the All-Time High resistance. The US Fed decision is a key global event today, which may introduce significant volatility. The primary strategy is to buy the breakout.
Bullish Scenario (Primary Plan: Breakout/Continuation)
Justification: The strong V-shaped recovery and the tight consolidation right below the ATH strongly favor a breakout.
Entry: Long entry on a decisive break and 15-minute candle close above 58,600 (breaking the ATH). Alternatively, look for a dip entry near 58,100 - 58,200 (the lower channel trendline/consolidation support).
Stop Loss (SL): Place a stop loss below 57,900 (below the main channel support).
Targets:
T1: 59,000 (Psychological target).
T2: 59,300 (Extension target).
Bearish Scenario (Counter-Trend/Reversal)
Justification: High-risk. Only valid if the Fed decision is hawkish, causing a sharp rejection from the ATH zone.
Trigger: A sustained break and 1-hour close back below 57,800.
Entry: Short entry below 57,800.
Stop Loss (SL): Above 58,200.
Targets:
T1: 57,500 (Previous swing low).
T2: 57,300 (Major FVG support).
Key Levels for Observation:
Immediate Decision Point: 58,300 - 58,600 zone.
Bullish Confirmation: Sustained trade above 58,600.
Bearish Warning: A move below 57,800.
Line in the Sand: 57,800.
Crucial Event: US Federal Reserve policy meeting outcome (post-market hours, will affect volatility).
כתב ויתור
המידע והפרסומים אינם מיועדים להיות, ואינם מהווים, ייעוץ או המלצה פיננסית, השקעתית, מסחרית או מכל סוג אחר המסופקת או מאושרת על ידי TradingView. קרא עוד ב־תנאי השימוש.
כתב ויתור
המידע והפרסומים אינם מיועדים להיות, ואינם מהווים, ייעוץ או המלצה פיננסית, השקעתית, מסחרית או מכל סוג אחר המסופקת או מאושרת על ידי TradingView. קרא עוד ב־תנאי השימוש.