🔎 Market Structure Analysis
4H Chart
Price is still trading inside a descending channel.
The recent rally into the 81,500–81,800 supply/FVG zone was rejected sharply.
Current structure shows a lower high forming, which aligns with the overall bearish channel.
Key support sits at 80,600–80,800, and if broken, deeper liquidity around 80,200–80,400 may be targeted.
1H Chart
Short-term push attempted to break the supply at 81,300–81,500 but failed.
Structure has shifted with a BOS (Break of Structure) confirming bearish intent.
There is a small FVG around 81,100–81,200, which may act as supply on any retest.
Demand is stacked between 80,600–80,800.
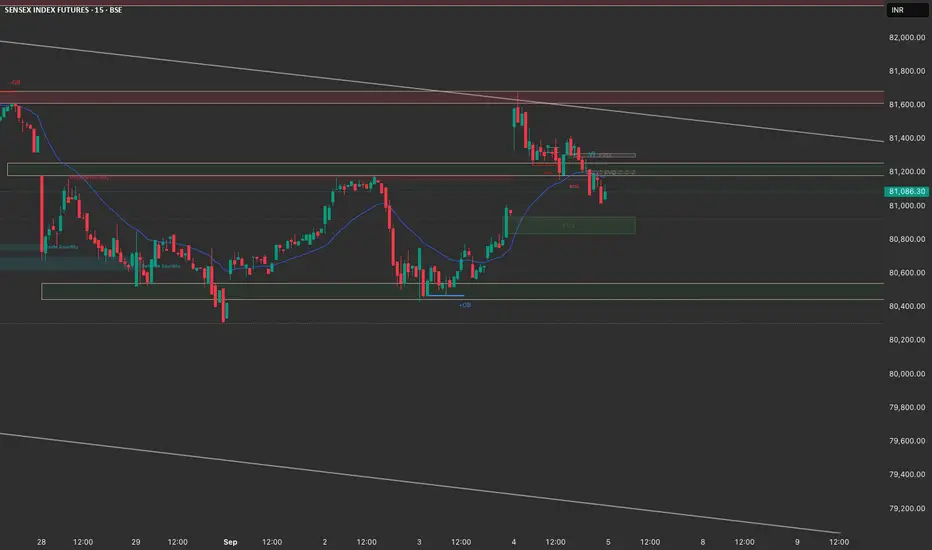
15M Chart
Clear rejection candle after liquidity grab above 81,300.
Multiple bearish BOS confirm intraday control with lower highs and lower lows.
Micro-FVG and OB formed between 81,100–81,200 could serve as sell-on-rally zones.
📊 Trade Plan for 5th September
Primary Bias: Bearish (Sell-on-Rise)
Short Entry Zone 1 (Aggressive): 81,100–81,200 (FVG/OB retest).
Short Entry Zone 2 (Safe): 81,300–81,500 (liquidity + strong supply).
Targets:
T1: 80,800
T2: 80,600
T3: 80,200
Stop Loss: Above 81,500 (conservative) or 81,650 (swing high).
Alternative Scenario (Bullish Reversal if support holds)
If price sustains above 81,300 with volume, structure will shift bullish.
Long Entry: Retest of 81,100–81,200.
Targets:
T1: 81,500
T2: 81,800
Stop Loss: Below 80,900.
✅ Summary:
Bias: Bearish → short rallies into 81,100–81,500 zones.
Key Support: 80,600–80,800 (watch if broken or defended).
Invalidation: Clean breakout above 81,500.
4H Chart
Price is still trading inside a descending channel.
The recent rally into the 81,500–81,800 supply/FVG zone was rejected sharply.
Current structure shows a lower high forming, which aligns with the overall bearish channel.
Key support sits at 80,600–80,800, and if broken, deeper liquidity around 80,200–80,400 may be targeted.
1H Chart
Short-term push attempted to break the supply at 81,300–81,500 but failed.
Structure has shifted with a BOS (Break of Structure) confirming bearish intent.
There is a small FVG around 81,100–81,200, which may act as supply on any retest.
Demand is stacked between 80,600–80,800.
15M Chart
Clear rejection candle after liquidity grab above 81,300.
Multiple bearish BOS confirm intraday control with lower highs and lower lows.
Micro-FVG and OB formed between 81,100–81,200 could serve as sell-on-rally zones.
📊 Trade Plan for 5th September
Primary Bias: Bearish (Sell-on-Rise)
Short Entry Zone 1 (Aggressive): 81,100–81,200 (FVG/OB retest).
Short Entry Zone 2 (Safe): 81,300–81,500 (liquidity + strong supply).
Targets:
T1: 80,800
T2: 80,600
T3: 80,200
Stop Loss: Above 81,500 (conservative) or 81,650 (swing high).
Alternative Scenario (Bullish Reversal if support holds)
If price sustains above 81,300 with volume, structure will shift bullish.
Long Entry: Retest of 81,100–81,200.
Targets:
T1: 81,500
T2: 81,800
Stop Loss: Below 80,900.
✅ Summary:
Bias: Bearish → short rallies into 81,100–81,500 zones.
Key Support: 80,600–80,800 (watch if broken or defended).
Invalidation: Clean breakout above 81,500.
כתב ויתור
המידע והפרסומים אינם אמורים להיות, ואינם מהווים, עצות פיננסיות, השקעות, מסחר או סוגים אחרים של עצות או המלצות שסופקו או מאושרים על ידי TradingView. קרא עוד בתנאים וההגבלות.
כתב ויתור
המידע והפרסומים אינם אמורים להיות, ואינם מהווים, עצות פיננסיות, השקעות, מסחר או סוגים אחרים של עצות או המלצות שסופקו או מאושרים על ידי TradingView. קרא עוד בתנאים וההגבלות.