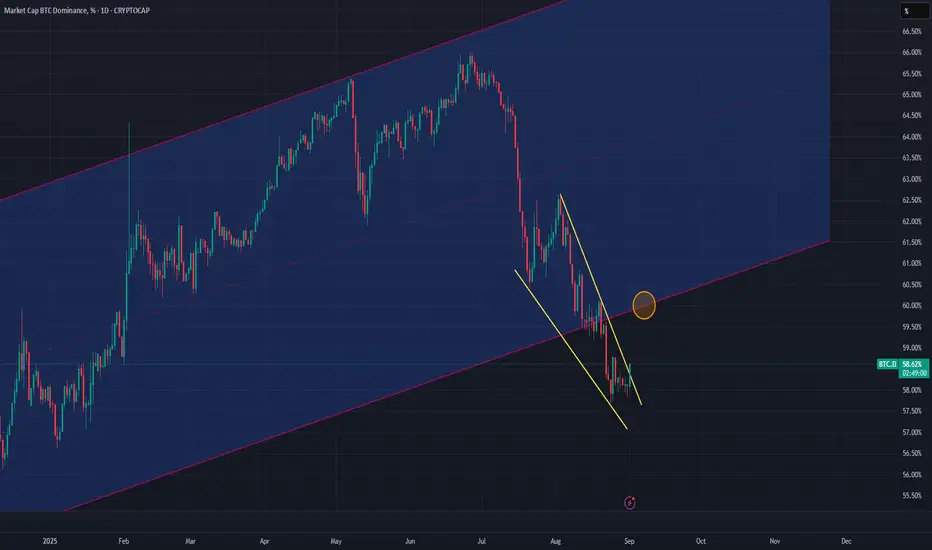
BTC Dominance (BTC.D) chart broke out of a long term parallel channel in late Aug 2025. Chart was forming a wedge pattern which has now broke out towards upside.
Chart is expected to retrace up to bottom trendline of the parallel channel (from where it initial broke out) around 60%.
This in turns means that we should expect some bearish price movements across all alt coins.
Once BTC.D chart hits 60%, it will continue its downward trend.
Chart is expected to retrace up to bottom trendline of the parallel channel (from where it initial broke out) around 60%.
This in turns means that we should expect some bearish price movements across all alt coins.
Once BTC.D chart hits 60%, it will continue its downward trend.
כתב ויתור
המידע והפרסומים אינם אמורים להיות, ואינם מהווים, עצות פיננסיות, השקעות, מסחר או סוגים אחרים של עצות או המלצות שסופקו או מאושרים על ידי TradingView. קרא עוד בתנאים וההגבלות.
כתב ויתור
המידע והפרסומים אינם אמורים להיות, ואינם מהווים, עצות פיננסיות, השקעות, מסחר או סוגים אחרים של עצות או המלצות שסופקו או מאושרים על ידי TradingView. קרא עוד בתנאים וההגבלות.