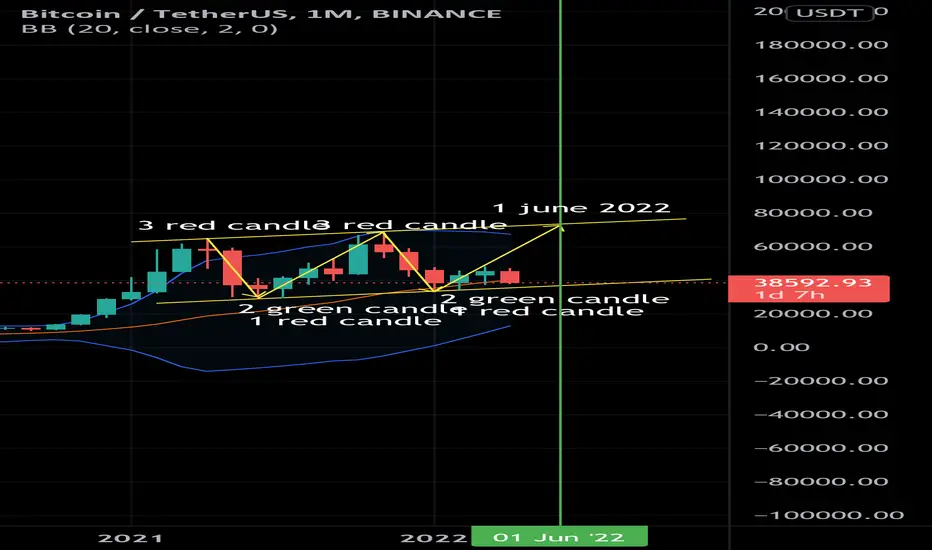
If we look at bitcoin monthly chart, we can clearly see it similar pattern and candlestick.
With 3 red bearish candle, following by 2 green candle, and 1 red candle.
If the history will repeat itself, then we will see massive pump in May and probably reach bitcoin altimehigh at the first june 2022
What do you think?
With 3 red bearish candle, following by 2 green candle, and 1 red candle.
If the history will repeat itself, then we will see massive pump in May and probably reach bitcoin altimehigh at the first june 2022
What do you think?
כתב ויתור
המידע והפרסומים אינם מיועדים להיות, ואינם מהווים, ייעוץ או המלצה פיננסית, השקעתית, מסחרית או מכל סוג אחר המסופקת או מאושרת על ידי TradingView. קרא עוד ב־תנאי השימוש.
כתב ויתור
המידע והפרסומים אינם מיועדים להיות, ואינם מהווים, ייעוץ או המלצה פיננסית, השקעתית, מסחרית או מכל סוג אחר המסופקת או מאושרת על ידי TradingView. קרא עוד ב־תנאי השימוש.