Bitcoin All Time High Drawdown - Bottom nowhere in sight?
We revisit the Bitcoin All Time High Drawdown chart originally published in March 2023.
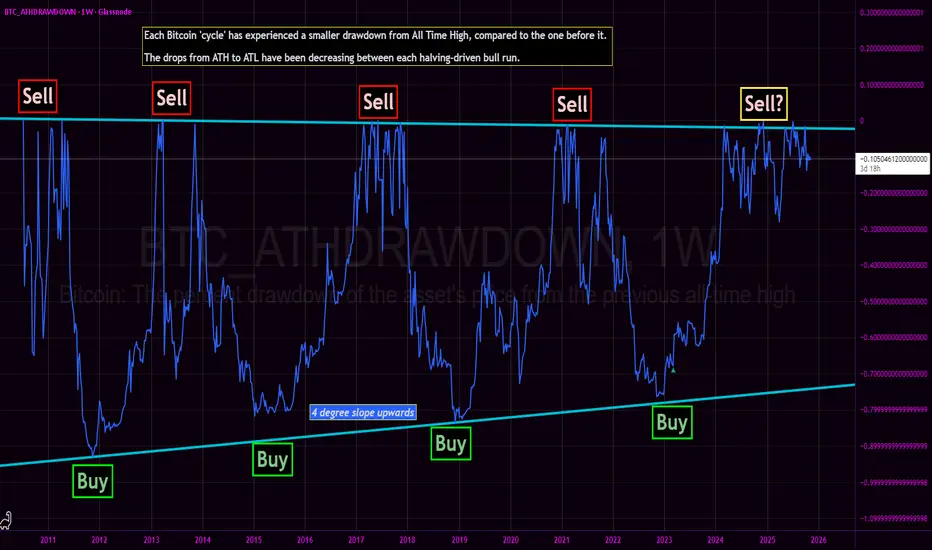
The core thesis of the BTC_ATHDRAWDOWN chart remains intact: each subsequent market cycle has exhibited a diminishing drawdown from its prior All-Time High, with generational cycle bottoms resting squarely on a discernible upward-sloping diagonal support (the 'Buy' line). The 2022-2023 bear market bottomed perfectly on this structural trendline, confirming the '4 degree slope upwards' trend.
Current Cycle Progress: The Sawtooth Fractal
Following the decisive breakthrough of the 2021 All-Time High, price action has entered an unprecedented and structurally complex phase. We are currently witnessing a prolonged high-frequency sawtooth waveform of continuous All-Time Highs.
This action represents the longest sawtooth fractal near ATH of any cycle prior.
This is a stark deviation from the swift, parabolic ascents that characterized previous blow-off tops:
Contrasting the 2017 Pattern: The 2017 bull run culminated in a sharp, almost vertical run-up to $20,000, immediately followed by a steep and rapid crash. That was a classic V-top.
The 2024/2025 Pattern: Instead of a quick V-top, the market is engaged in an extended, messy distribution/consolidation phase right at the very peak. The continuous setting of new, marginal ATHs followed by sharp, shallow pullbacks creates a dense, high-frequency signal in the ATH Drawdown chart.
This structural evolution—a prolonged struggle to hold and marginally exceed previous peaks—suggests that the market is either building a much larger, more resilient base for an extended super-cycle, or undergoing a slow, drawn-out distribution that fundamentally alters the historical BTC cycle cadence.
This is not financial advice, and presented merely as conjectural musing.
The degen in me sees the degen in you.
פרסומים קשורים
כתב ויתור
המידע והפרסומים אינם אמורים להיות, ואינם מהווים, עצות פיננסיות, השקעות, מסחר או סוגים אחרים של עצות או המלצות שסופקו או מאושרים על ידי TradingView. קרא עוד בתנאים וההגבלות.
The degen in me sees the degen in you.
פרסומים קשורים
כתב ויתור
המידע והפרסומים אינם אמורים להיות, ואינם מהווים, עצות פיננסיות, השקעות, מסחר או סוגים אחרים של עצות או המלצות שסופקו או מאושרים על ידי TradingView. קרא עוד בתנאים וההגבלות.