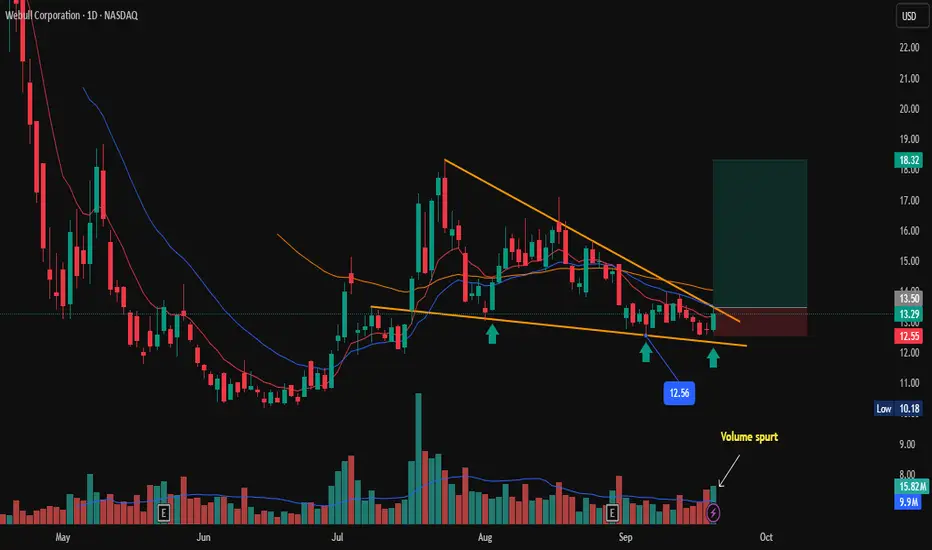
Webbull Corporation shows signs of a potential long opportunity after forming a Bullish reversal pattern (falling wedge) on the daily chart. Price respecting a trendline, and Volume spurt on last trading session. signaling Bullish momentum. hinting at a possible uptrend initiation.
Key Levels to Watch:
Immediate support at $12.56 (immediate low)
Trade Plan:
Enter long above $13.50 on confirmation of bullish candle close.
Stop loss above $12.60 to limit risk.
Target $18.00 as per falling wedge rule, or trail stop as price moves above.
Disclaimer: Risk management is crucial. so keep position sizing appropriate. This analysis is intended for educational purposes and not financial advice.
עסקה פעילה
Trade active SL @ costכתב ויתור
המידע והפרסומים אינם אמורים להיות, ואינם מהווים, עצות פיננסיות, השקעות, מסחר או סוגים אחרים של עצות או המלצות שסופקו או מאושרים על ידי TradingView. קרא עוד בתנאים וההגבלות.
כתב ויתור
המידע והפרסומים אינם אמורים להיות, ואינם מהווים, עצות פיננסיות, השקעות, מסחר או סוגים אחרים של עצות או המלצות שסופקו או מאושרים על ידי TradingView. קרא עוד בתנאים וההגבלות.