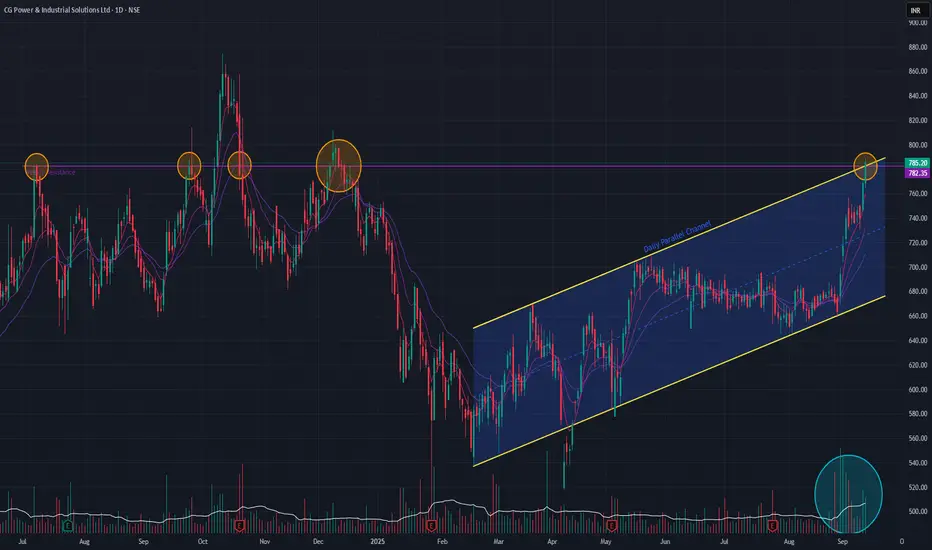
CG Power has been consolidating below a major horizontal resistance line established in July 2024, which has so far prevented new all-time highs. Following a downtrend that began in October 2024, the stock has been trading within a well-defined parallel channel.
Today's price action is particularly bullish, as the stock is attempting a breakout from a confluence of resistance: the top of the parallel channel and the long-term horizontal trendline.
This significant move is supported by two key technical indicators:
A sustained breakout above this confluence would be a strong signal that the uptrend is resuming.
Today's price action is particularly bullish, as the stock is attempting a breakout from a confluence of resistance: the top of the parallel channel and the long-term horizontal trendline.
This significant move is supported by two key technical indicators:
- The short-term EMAs are in a Positive Crossover (PCO) state.
- An SMA Golden Cross occurred just a few days ago.
A sustained breakout above this confluence would be a strong signal that the uptrend is resuming.
Disclaimer: This analysis is my personal view & for educational purposes only. They shall not be construed as trade or investment advice. Before making any financial decision, it is imperative that you consult with a qualified financial professional.
כתב ויתור
המידע והפרסומים אינם מיועדים להיות, ואינם מהווים, ייעוץ או המלצה פיננסית, השקעתית, מסחרית או מכל סוג אחר המסופקת או מאושרת על ידי TradingView. קרא עוד ב־תנאי השימוש.