🚩CPB | Long Setup | Defensive Staples Mean-Reversion off 52-Week Support | Sep 15, 2025
🔹 Thesis Summary
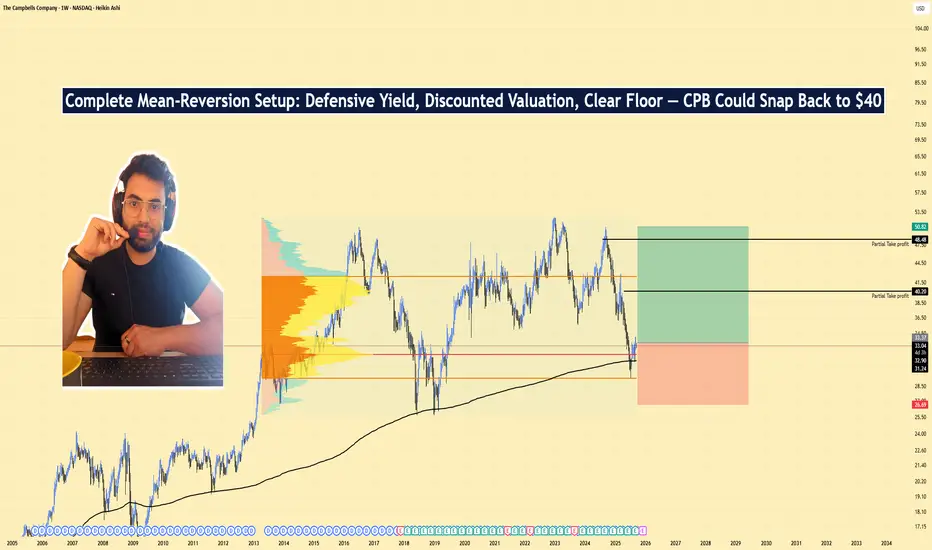
Campbell’s (CPB) is basing just above its 52-week low with a 4.7% dividend and a discounted forward multiple. A modest earnings reset appears priced in; a staples rotation plus cost discipline can drive mean-reversion toward mid-30s/upper-30s.
🔹 Trade Setup
Bias: Long
Entry Zone: $31.20–$32.10 (staggered bids toward the 52-week floor at $30.41)
Stop Loss: $26 (clear break of the 52-week floor)
Take-Profits:
TP1: $40
TP2: $50
Max Target: $50.00 (mean-reversion band)
🔹 Narrative & Context
Structure: Price has carved a multi-month base around $30–33 after a persistent 1Y drawdown. Defensive bid plus dividend support favors accumulation near the lower third of the 52-week range ($30.41–$51.56). Beta = 0.26, fitting a low-vol rotation backdrop.
🔹 Catalysts: Upcoming Q1 FY26 report early Dec; watch gross-margin commentary (inputs/tariffs), elasticity in Snacks/Meals, and Sovos integration run-rate.
Ownership: ~35% insider and ~65% institutional ownership underpins stability and alignment.
Dividend: 4.69% indicated yield provides carry while the base resolves.
🔹 Valuation & Context (Pro Metrics, Framed Simply)
Forward P/E = 12.45× vs peer set ~13–16× (GIS 12.99×, HRL 15.9×, KHC 9.7×, MDLZ 18.6×) → Slight discount to staples ex-value outliers → Market pricing in weak near-term EPS → Supports a mean-reversion long.
P/FCF = 13.9× → FCF Yield ≈ 7.2% (mid-pack vs GIS ~8.7%, KHC ~11.4%, MDLZ ~3.6%) → Solid cash coverage of dividend and reinvestment → Helps defend the base.
Growth: EPS This Y −15.5% (reset) vs Next Y +5.2% → Near-term trough dynamics with modest rebound potential → A small beat/guide raise could unlock multiple expansion.
Risk: Beta 0.26 and ESG risk score ~27 (medium) → Low market-beta but operational execution still matters → Suits a defensive sleeve.
🔹 Contrarian Angle (Your Edge)
Street sits at “Hold/Reduce” with ~mid-$34 targets. The market priced in the FY26 reset; however, a low-teens forward P/E, a 7% FCF yield, and base-building above $30 set a floor. If gross margins surprise on mix/sourcing, CPB can re-rate toward 14–15×, implying $38–$40 without heroic growth assumptions.
🔹 Risks (Balanced)
Further input-cost/tariff pressure compressing gross margin.
Volume share loss to private label/“better-for-you” categories.
Integration slippage on Sovos or incremental promo spend to defend shelf space.
🔹 Macro Considerations
Staples leadership typically improves during risk-off or rising-volatility regimes; monitor XLP/SPY relative strength.
Rates/inflation path drives grocery pricing power and promo cadence.
Track category scans (soup/snacks/sauces) for elasticity and private-label encroachment into FY26.
🔹 Bottom Line
CPB screens slightly cheap on forward earnings with durable cash flow and dividend carry. The $30–33 base offers a defined-risk entry for a mean-reversion long into year-end and early 2026. Execution on costs and stable volumes are the swing factors.
🔹 Forward Path
⚠️ Disclaimer: This is not financial advice. Always do your own research. Charts and visuals may include AI enhancements.
🔹 Footnote
Forward P/E: Price divided by expected earnings over the next 12 months. Lower = cheaper relative to profits.
P/FCF (Price-to-Free-Cash-Flow): Price vs. the cash left after investments. A measure of efficiency.
FCF Yield: Free cash flow per share ÷ price per share. Higher = more cash returned for each dollar invested.
ROE (Return on Equity): Net income ÷ shareholder equity. Shows management efficiency with investor capital.
ROIC (Return on Invested Capital): Net income ÷ all invested capital (equity + debt). A purer profitability gauge.
Debt/Equity: Debt divided by equity. <1 usually means balance sheet is conservative.
R:R (Risk-to-Reward): Ratio of expected upside vs. downside. 3:1 = you risk $1 to make $3.
🔹 Thesis Summary
Campbell’s (CPB) is basing just above its 52-week low with a 4.7% dividend and a discounted forward multiple. A modest earnings reset appears priced in; a staples rotation plus cost discipline can drive mean-reversion toward mid-30s/upper-30s.
🔹 Trade Setup
Bias: Long
Entry Zone: $31.20–$32.10 (staggered bids toward the 52-week floor at $30.41)
Stop Loss: $26 (clear break of the 52-week floor)
Take-Profits:
TP1: $40
TP2: $50
Max Target: $50.00 (mean-reversion band)
🔹 Narrative & Context
Structure: Price has carved a multi-month base around $30–33 after a persistent 1Y drawdown. Defensive bid plus dividend support favors accumulation near the lower third of the 52-week range ($30.41–$51.56). Beta = 0.26, fitting a low-vol rotation backdrop.
🔹 Catalysts: Upcoming Q1 FY26 report early Dec; watch gross-margin commentary (inputs/tariffs), elasticity in Snacks/Meals, and Sovos integration run-rate.
Ownership: ~35% insider and ~65% institutional ownership underpins stability and alignment.
Dividend: 4.69% indicated yield provides carry while the base resolves.
🔹 Valuation & Context (Pro Metrics, Framed Simply)
Forward P/E = 12.45× vs peer set ~13–16× (GIS 12.99×, HRL 15.9×, KHC 9.7×, MDLZ 18.6×) → Slight discount to staples ex-value outliers → Market pricing in weak near-term EPS → Supports a mean-reversion long.
P/FCF = 13.9× → FCF Yield ≈ 7.2% (mid-pack vs GIS ~8.7%, KHC ~11.4%, MDLZ ~3.6%) → Solid cash coverage of dividend and reinvestment → Helps defend the base.
Growth: EPS This Y −15.5% (reset) vs Next Y +5.2% → Near-term trough dynamics with modest rebound potential → A small beat/guide raise could unlock multiple expansion.
Risk: Beta 0.26 and ESG risk score ~27 (medium) → Low market-beta but operational execution still matters → Suits a defensive sleeve.
🔹 Contrarian Angle (Your Edge)
Street sits at “Hold/Reduce” with ~mid-$34 targets. The market priced in the FY26 reset; however, a low-teens forward P/E, a 7% FCF yield, and base-building above $30 set a floor. If gross margins surprise on mix/sourcing, CPB can re-rate toward 14–15×, implying $38–$40 without heroic growth assumptions.
🔹 Risks (Balanced)
Further input-cost/tariff pressure compressing gross margin.
Volume share loss to private label/“better-for-you” categories.
Integration slippage on Sovos or incremental promo spend to defend shelf space.
🔹 Macro Considerations
Staples leadership typically improves during risk-off or rising-volatility regimes; monitor XLP/SPY relative strength.
Rates/inflation path drives grocery pricing power and promo cadence.
Track category scans (soup/snacks/sauces) for elasticity and private-label encroachment into FY26.
🔹 Bottom Line
CPB screens slightly cheap on forward earnings with durable cash flow and dividend carry. The $30–33 base offers a defined-risk entry for a mean-reversion long into year-end and early 2026. Execution on costs and stable volumes are the swing factors.
🔹 Forward Path
If this post gains traction (10+ likes), I’ll publish:
A weekly-chart update with level-by-level triggers,
Post-earnings read-through on margins/mix, and
A peer-relative valuation refresh (GIS, KHC, HRL, MDLZ).
Like & Follow for structured ideas, not signals. I post high-conviction setups here before broader narratives play out.
⚠️ Disclaimer: This is not financial advice. Always do your own research. Charts and visuals may include AI enhancements.
🔹 Footnote
Forward P/E: Price divided by expected earnings over the next 12 months. Lower = cheaper relative to profits.
P/FCF (Price-to-Free-Cash-Flow): Price vs. the cash left after investments. A measure of efficiency.
FCF Yield: Free cash flow per share ÷ price per share. Higher = more cash returned for each dollar invested.
ROE (Return on Equity): Net income ÷ shareholder equity. Shows management efficiency with investor capital.
ROIC (Return on Invested Capital): Net income ÷ all invested capital (equity + debt). A purer profitability gauge.
Debt/Equity: Debt divided by equity. <1 usually means balance sheet is conservative.
R:R (Risk-to-Reward): Ratio of expected upside vs. downside. 3:1 = you risk $1 to make $3.
2 Ways I Help Serious Traders Win | Real Trades. Ruthless Edge.
1️⃣ Fix Your Trading Fast – My 4-step:
sentientinstitutes.com/
2️⃣ Get My Weekly Recap and Setup Drops here:
t.me/TradeSimple_with_Mo
P.S. Mentor MO❤️
1️⃣ Fix Your Trading Fast – My 4-step:
sentientinstitutes.com/
2️⃣ Get My Weekly Recap and Setup Drops here:
t.me/TradeSimple_with_Mo
P.S. Mentor MO❤️
כתב ויתור
המידע והפרסומים אינם אמורים להיות, ואינם מהווים, עצות פיננסיות, השקעות, מסחר או סוגים אחרים של עצות או המלצות שסופקו או מאושרים על ידי TradingView. קרא עוד בתנאים וההגבלות.