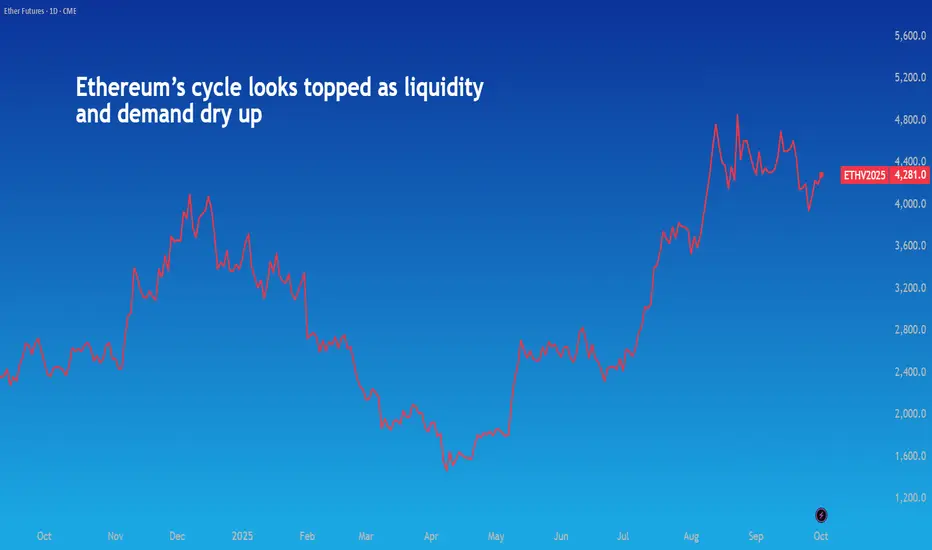
Crypto bull markets tend to follow a script: Bitcoin outperforms Ethereum, the latter catches up along with altcoins, eventually ending its bull rally after hitting an all-time high.
In 2025, that pattern repeated, and Ethereum now looks caught at the end of its run. The network’s liquidity is vanishing, institutional positioning is turning cautious, and the mechanics of its own design are pushing it back into inflation.
Ethereum’s Fee Mechanics Reverse the Burn
Daily transactions on Layer-1 are holding near 1.6 million. The number of active Ethereum wallets has climbed to 127 million, marking a 22% increase over the past year, indicating sticky user activity.

Despite this, Ethereum has shifted back into a net inflationary phase, with ETH burns falling below issuance. The main driver for this is the historically low gas fees, which reduce the burn levels even when transaction volumes remain steady.

In February 2025, Ethereum expanded the network’s daily capacity by increasing its block gas limit, allowing more transactions in each block. Hence, while the number of transactions stayed roughly the same until May 2025, the total gas used per block rose significantly.

However, each unit of gas still cost less, which led to lower transaction fees and, crucially, less ETH being burnt. This shift tipped Ethereum back into net inflation; respite came starting in May until September with an increase in transaction volume, but we’re back to seeing on-network transactions decline since then.
Institutions Expressing Caution
CME has quietly become Ethereum’s second home. By mid-2025, over 70% of all fixed-expiry ETH futures OI were sitting on CME.
That’s a reflection of how hedge funds, asset managers, and ETF issuers are choosing to express ETH exposure through margin-efficient mechanisms.
In Q2 alone, average daily volume on CME’s ETH futures surged past 16,000 contracts, nearly $1.8 billion in notional value per day, at a time when ETH was down 25% YTD.
Today, though, with ETH up 25% YTD, CME futures posted consecutive record-breaking months. July saw $118 billion in volume, a then all-time high, followed by $173.9 billion in August that marked the highest monthly volume in CME’s history.
OI also spiked, rising from $2.97 billion in June to $7.94 billion in August, reflecting surging institutional demand.

Over the past month, institutional investors have cut long positions and increased shorts. Asset manager net positioning has historically been a reliable signal of price declines, with major reversals in net longs often lagging sharp futures selloffs over the last five years. The latest reversal shows a pattern similar to those past episodes.

The thesis of altcoin rallying after BTC did prove itself right, but that cycle has now run its course.
Institutions are increasingly using ETFs as an investment tool. While ETFs have grown structurally, recent outflows have mirrored price declines. Given their larger influence on the ETH market, sustained outflows or weaker inflows could trigger a slowdown similar to last year, when prices also fell sharply.

A Familiar Pattern
Historically, Ethereum underperforms Bitcoin and then outpaces it. Year-to-date, bitcoin is up 22%, with Ethereum currently outperforming by over 3%.
The ETH/BTC ratio is often the best early indicator of that shift. After hitting a painful low of 0.018 in April, it started to climb again, up 130% over four months, peaking at over 0.043 in August.

But this altcoin cycle carries new weight. ETH stakers have withdrawal access and an incentive to take profit, especially as yields compress and prices plateau. Meanwhile, a deeper derivatives market means speculative blowoffs are harder to sustain, as hedging accelerates mean reversion.
Conclusions and Lessons From History
Institutions are increasingly driving Ethereum’s price action. With ETFs and CME futures gaining dominance, tracking institutional positioning is critical. Current data shows caution: asset managers have cut net long positions since the rally peak, and ETF outflows are accelerating.

After reaching a new all-time high, ETH’s performance mirrors the 2021 peak. Many recent ETF buyers entered at elevated prices, leaving a significant share of holdings unprofitable. If prices fall back to March levels, more than half of ETF inflows from the past year would be at risk of losses.

With profit-taking in full swing, prices echo the peak during the 2021 bull run. A short position from present levels has the potential for massive upside according to historical trends.

Historically, after profit-taking at key price levels—measured by a drop in MVRV—ETH has averaged a 36% decline over two months. Currently, just 18 days past the last all-time high and only 5% lower, historical patterns suggest the potential for a sharper downturn.

With prices already trading at the 23.6% fibonacci level, continued decline could push prices lower to the 38.2% level at 3600.

A relevant case study is the decline following profit-taking after ETH’s all-time high in 2021. A simulated position under similar conditions to today shows a compelling return profile, highlighting how traders can benefit from profit-taking–driven downturns. Please note that historical trends are not indicative of future performance.

The strategy was not universally successful. A comparable position in September 2021, when ETH retested its prior ATH, would have resulted in losses. This underscores the importance of monitoring multiple signals that confirm slowing momentum and active profit-taking before entering such trades. Entering too early, before the bull run has fully played out, poses a significant risk.

This content is sponsored.
MARKET DATA
CME Real-time Market Data helps identify trading set-ups and express market views better. If you have futures in your trading portfolio, you can check out on CME Group data plans available that suit your trading needs tradingview.com/cme.
DISCLAIMER
This case study is for educational purposes only and does not constitute investment recommendations or advice. Nor are they used to promote any specific products, or services.
Trading or investment ideas cited here are for illustration only, as an integral part of a case study to demonstrate the fundamental concepts in risk management or trading under the market scenarios being discussed. Please read the FULL DISCLAIMER the link to which is provided in our profile description.
In 2025, that pattern repeated, and Ethereum now looks caught at the end of its run. The network’s liquidity is vanishing, institutional positioning is turning cautious, and the mechanics of its own design are pushing it back into inflation.
Ethereum’s Fee Mechanics Reverse the Burn
Daily transactions on Layer-1 are holding near 1.6 million. The number of active Ethereum wallets has climbed to 127 million, marking a 22% increase over the past year, indicating sticky user activity.
Despite this, Ethereum has shifted back into a net inflationary phase, with ETH burns falling below issuance. The main driver for this is the historically low gas fees, which reduce the burn levels even when transaction volumes remain steady.
In February 2025, Ethereum expanded the network’s daily capacity by increasing its block gas limit, allowing more transactions in each block. Hence, while the number of transactions stayed roughly the same until May 2025, the total gas used per block rose significantly.
However, each unit of gas still cost less, which led to lower transaction fees and, crucially, less ETH being burnt. This shift tipped Ethereum back into net inflation; respite came starting in May until September with an increase in transaction volume, but we’re back to seeing on-network transactions decline since then.
Institutions Expressing Caution
CME has quietly become Ethereum’s second home. By mid-2025, over 70% of all fixed-expiry ETH futures OI were sitting on CME.
That’s a reflection of how hedge funds, asset managers, and ETF issuers are choosing to express ETH exposure through margin-efficient mechanisms.
In Q2 alone, average daily volume on CME’s ETH futures surged past 16,000 contracts, nearly $1.8 billion in notional value per day, at a time when ETH was down 25% YTD.
Today, though, with ETH up 25% YTD, CME futures posted consecutive record-breaking months. July saw $118 billion in volume, a then all-time high, followed by $173.9 billion in August that marked the highest monthly volume in CME’s history.
OI also spiked, rising from $2.97 billion in June to $7.94 billion in August, reflecting surging institutional demand.
Over the past month, institutional investors have cut long positions and increased shorts. Asset manager net positioning has historically been a reliable signal of price declines, with major reversals in net longs often lagging sharp futures selloffs over the last five years. The latest reversal shows a pattern similar to those past episodes.
The thesis of altcoin rallying after BTC did prove itself right, but that cycle has now run its course.
Institutions are increasingly using ETFs as an investment tool. While ETFs have grown structurally, recent outflows have mirrored price declines. Given their larger influence on the ETH market, sustained outflows or weaker inflows could trigger a slowdown similar to last year, when prices also fell sharply.
A Familiar Pattern
Historically, Ethereum underperforms Bitcoin and then outpaces it. Year-to-date, bitcoin is up 22%, with Ethereum currently outperforming by over 3%.
The ETH/BTC ratio is often the best early indicator of that shift. After hitting a painful low of 0.018 in April, it started to climb again, up 130% over four months, peaking at over 0.043 in August.
But this altcoin cycle carries new weight. ETH stakers have withdrawal access and an incentive to take profit, especially as yields compress and prices plateau. Meanwhile, a deeper derivatives market means speculative blowoffs are harder to sustain, as hedging accelerates mean reversion.
Conclusions and Lessons From History
Institutions are increasingly driving Ethereum’s price action. With ETFs and CME futures gaining dominance, tracking institutional positioning is critical. Current data shows caution: asset managers have cut net long positions since the rally peak, and ETF outflows are accelerating.
After reaching a new all-time high, ETH’s performance mirrors the 2021 peak. Many recent ETF buyers entered at elevated prices, leaving a significant share of holdings unprofitable. If prices fall back to March levels, more than half of ETF inflows from the past year would be at risk of losses.
With profit-taking in full swing, prices echo the peak during the 2021 bull run. A short position from present levels has the potential for massive upside according to historical trends.
Historically, after profit-taking at key price levels—measured by a drop in MVRV—ETH has averaged a 36% decline over two months. Currently, just 18 days past the last all-time high and only 5% lower, historical patterns suggest the potential for a sharper downturn.
With prices already trading at the 23.6% fibonacci level, continued decline could push prices lower to the 38.2% level at 3600.
A relevant case study is the decline following profit-taking after ETH’s all-time high in 2021. A simulated position under similar conditions to today shows a compelling return profile, highlighting how traders can benefit from profit-taking–driven downturns. Please note that historical trends are not indicative of future performance.
The strategy was not universally successful. A comparable position in September 2021, when ETH retested its prior ATH, would have resulted in losses. This underscores the importance of monitoring multiple signals that confirm slowing momentum and active profit-taking before entering such trades. Entering too early, before the bull run has fully played out, poses a significant risk.
This content is sponsored.
MARKET DATA
CME Real-time Market Data helps identify trading set-ups and express market views better. If you have futures in your trading portfolio, you can check out on CME Group data plans available that suit your trading needs tradingview.com/cme.
DISCLAIMER
This case study is for educational purposes only and does not constitute investment recommendations or advice. Nor are they used to promote any specific products, or services.
Trading or investment ideas cited here are for illustration only, as an integral part of a case study to demonstrate the fundamental concepts in risk management or trading under the market scenarios being discussed. Please read the FULL DISCLAIMER the link to which is provided in our profile description.
Full Disclaimer - linktr.ee/mintfinance
כתב ויתור
המידע והפרסומים אינם מיועדים להיות, ואינם מהווים, ייעוץ או המלצה פיננסית, השקעתית, מסחרית או מכל סוג אחר המסופקת או מאושרת על ידי TradingView. קרא עוד ב־תנאי השימוש.
Full Disclaimer - linktr.ee/mintfinance
כתב ויתור
המידע והפרסומים אינם מיועדים להיות, ואינם מהווים, ייעוץ או המלצה פיננסית, השקעתית, מסחרית או מכל סוג אחר המסופקת או מאושרת על ידי TradingView. קרא עוד ב־תנאי השימוש.