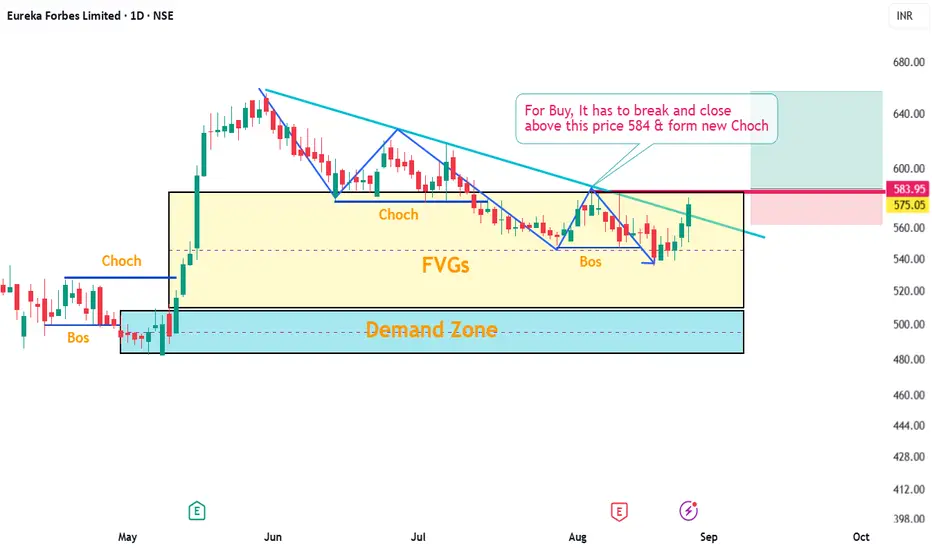
In this Supply and Demand Strategy, spotted reversal and waiting for breakout confirmation (above 584) for the target of 650/655 with stoploss 560
Eureka Forbes is trading 2.19% upper at Rs 575.10 as compared to its last closing price. It has been trading in the price range of 578.05 & 550.85.
Eureka Forbes has given -4.92% in this year & -1.08% in the last 5 days and it has TTM P/E ratio 67.51 as compared to the sector P/E of 26.99.
The company posted a net profit of 38.68 Crores in its last quarter.
== EDUCATIONAL PURPOSE ONLY ==
כתב ויתור
המידע והפרסומים אינם מיועדים להיות, ואינם מהווים, ייעוץ או המלצה פיננסית, השקעתית, מסחרית או מכל סוג אחר המסופקת או מאושרת על ידי TradingView. קרא עוד ב־תנאי השימוש.
כתב ויתור
המידע והפרסומים אינם מיועדים להיות, ואינם מהווים, ייעוץ או המלצה פיננסית, השקעתית, מסחרית או מכל סוג אחר המסופקת או מאושרת על ידי TradingView. קרא עוד ב־תנאי השימוש.