Fetch.ai (FET) Chart Analysis: Observing a Bullish Pennant Break
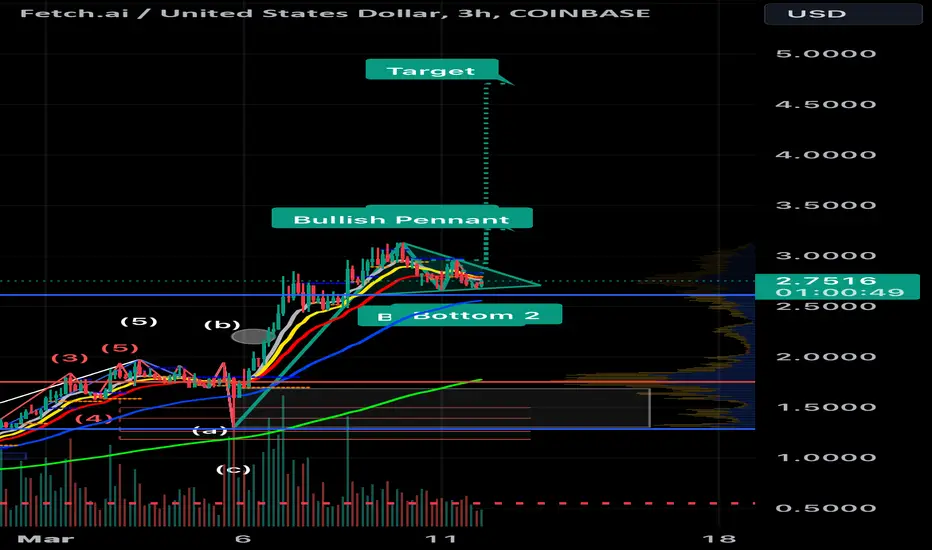
The FET/USD 3-hour chart displays a pattern resembling a bullish pennant breakout. If this breakout is confirmed, technical analysis suggests a potential price target of $4.71.
עסקה פעילה
הערה
Sometimes patterns morph into new patternsהערה
New pattern same targetהערה
הערה
הערה
Another new ATHהערה
Agix and ocean are planning to merge with FetchAi.הערה
הערה
Bull markets are fun. Its meme and AI season.הערה
עסקה פעילה
הערה
There is lots of fud coming out regarding the agix, ocean, fetchai token consolidation. I’m just gonna double down on fet at the equilibrium around $2 if it falls there.הערה
הערה
I just can’t see a big correction just yet.עסקה פעילה
עסקה פעילה
הערה
Stop loss at $2.79.עסקה סגורה: הגיע לסטופ
עסקה פעילה
Strong bullish divergence on all time framesUSDT: 0xd3787d843Cf915E5475119459B34b6429827c297
כתב ויתור
המידע והפרסומים אינם אמורים להיות, ואינם מהווים, עצות פיננסיות, השקעות, מסחר או סוגים אחרים של עצות או המלצות שסופקו או מאושרים על ידי TradingView. קרא עוד בתנאים וההגבלות.
USDT: 0xd3787d843Cf915E5475119459B34b6429827c297
כתב ויתור
המידע והפרסומים אינם אמורים להיות, ואינם מהווים, עצות פיננסיות, השקעות, מסחר או סוגים אחרים של עצות או המלצות שסופקו או מאושרים על ידי TradingView. קרא עוד בתנאים וההגבלות.