Breakout and Volume Accumulation in Great Eastern Shipping Co. Ltd
 GESHIP
📈Pattern & Setup:
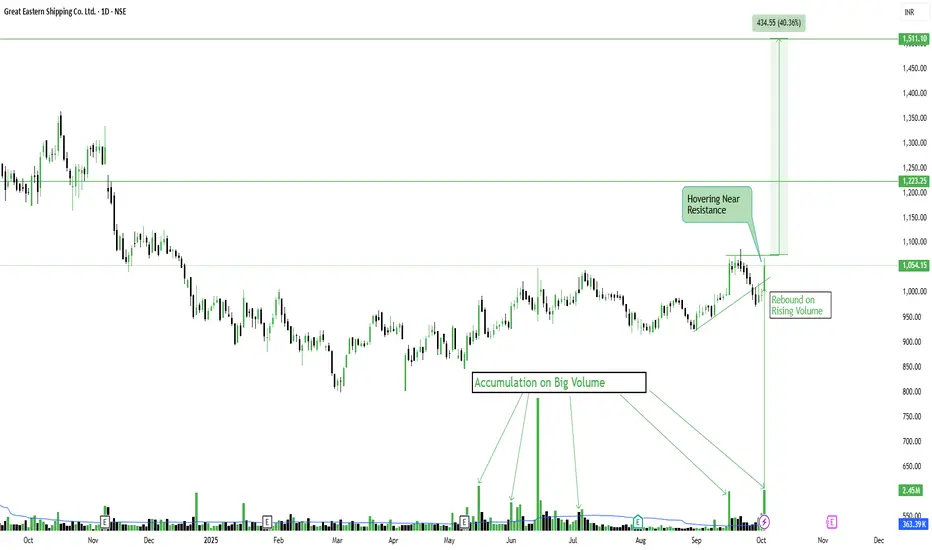
The stock has shown a strong rebound after months of sideways consolidation, forming a solid accumulation base around 850–950 levels. Multiple large-volume candles during this phase indicate smart money quietly building positions.
Now, the price is hovering near the key resistance zone around 1,220–1,230. Sustaining above this level could trigger a strong continuation rally. Volume behavior remains impressive — rising on every up day and holding well above average, confirming underlying demand.
📝 Trade Plan:
Entry: Current levels (1,050–1,060) are suitable for tracking early continuation setups.
🚩Stop-Loss: 980 (below the rising trendline).
🎯Targets:
Target 1 → 1,225 (immediate resistance zone).
Target 2 → 1,510 (measured breakout projection, 40% potential upside).
💡Pyramiding Strategy:
1. Enter first lot around 1,050–1,060.
2. Add above 1,125 once breakout sustains, trail SL to 1,000.
3. Add final lot above 1,225 breakout, trail SL to 1,125.
Ride the trend as long as the stock continues to close above the trendline.
🧠Logic Behind Selecting this Trade:
The chart reflects a **classic accumulation to breakout transition** — long consolidation with big-volume participation followed by a sharp upward move. Price rebounded perfectly from a breakout retest zone with increasing volume, signaling institutional re-entry. A decisive breakout above 1,225 could unleash strong upside momentum.
Keep Learning. Keep Earning.
Let's grow together 📚🎯
🔴Disclaimer:
This is not an investment advice. Always do your own due diligence before making any trading or investment decision.
📈Pattern & Setup:
The stock has shown a strong rebound after months of sideways consolidation, forming a solid accumulation base around 850–950 levels. Multiple large-volume candles during this phase indicate smart money quietly building positions.
Now, the price is hovering near the key resistance zone around 1,220–1,230. Sustaining above this level could trigger a strong continuation rally. Volume behavior remains impressive — rising on every up day and holding well above average, confirming underlying demand.
📝 Trade Plan:
Entry: Current levels (1,050–1,060) are suitable for tracking early continuation setups.
🚩Stop-Loss: 980 (below the rising trendline).
🎯Targets:
Target 1 → 1,225 (immediate resistance zone).
Target 2 → 1,510 (measured breakout projection, 40% potential upside).
💡Pyramiding Strategy:
1. Enter first lot around 1,050–1,060.
2. Add above 1,125 once breakout sustains, trail SL to 1,000.
3. Add final lot above 1,225 breakout, trail SL to 1,125.
Ride the trend as long as the stock continues to close above the trendline.
🧠Logic Behind Selecting this Trade:
The chart reflects a **classic accumulation to breakout transition** — long consolidation with big-volume participation followed by a sharp upward move. Price rebounded perfectly from a breakout retest zone with increasing volume, signaling institutional re-entry. A decisive breakout above 1,225 could unleash strong upside momentum.
Keep Learning. Keep Earning.
Let's grow together 📚🎯
🔴Disclaimer:
This is not an investment advice. Always do your own due diligence before making any trading or investment decision.
TrendX INC
פרסומים קשורים
כתב ויתור
המידע והפרסומים אינם מיועדים להיות, ואינם מהווים, ייעוץ או המלצה פיננסית, השקעתית, מסחרית או מכל סוג אחר המסופקת או מאושרת על ידי TradingView. קרא עוד ב־תנאי השימוש.
TrendX INC
פרסומים קשורים
כתב ויתור
המידע והפרסומים אינם מיועדים להיות, ואינם מהווים, ייעוץ או המלצה פיננסית, השקעתית, מסחרית או מכל סוג אחר המסופקת או מאושרת על ידי TradingView. קרא עוד ב־תנאי השימוש.