https://www.tradingview.com/x/Z6ULfRnB/
News:
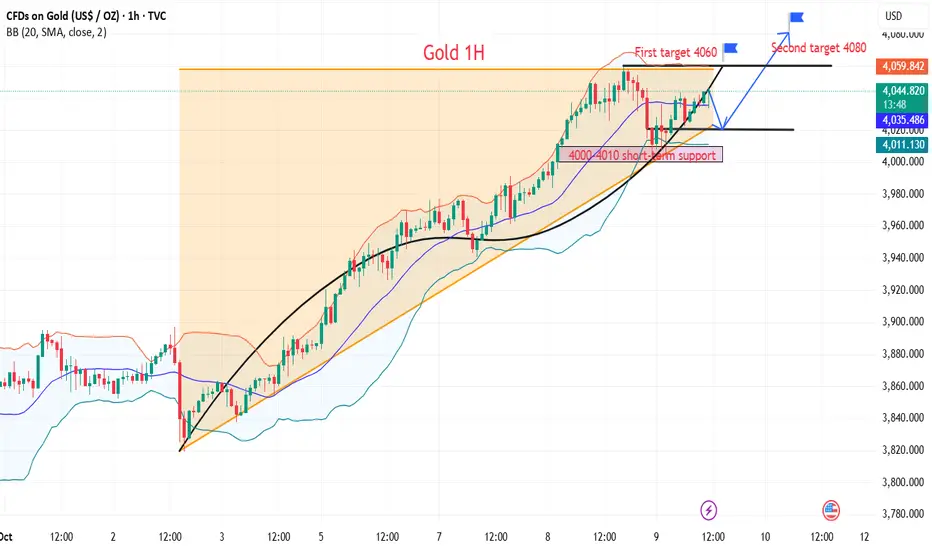
During the Asia-Europe session on Wednesday, spot gold hit a bottom and rebounded. Affected by the ceasefire agreement signed by Hamas in Gaza, it fell nearly 1% during the session, and then rebounded sharply. It is currently down 0.07%, and its price is stable above the historical high of US$4,000 per ounce.
Gold smells a familiar smell of sweeping here, which is in line with our expectations. According to the signal strategy given yesterday, if the price reaches 4020-4025, enter the long position and you can make a profit now.
Specifically:
The bullish momentum has not been broken. The upper double-line support on the hourly chart, along with the channel line, serves as a defensive dividing line.
This rally, which began at 3280 in August, accelerated in September and doubled in October, with a nearly $780 surge, setting a new record and reshaping market perception.
The two closest waves, one at 3720 and the other at 3820, sought support for further gains.
The upper double-line support on the hourly chart is currently between 4000 and 4010, tentatively serving as the dividing line for any shifts in momentum. Holding the upper double-line support level will ensure the overall bullish momentum remains unchanged, and any short-term pullbacks and accelerations are intended to facilitate a stronger rally.
Strategy:
Long Position4020-4030,SL:4010,Target:4060,4080
News:
During the Asia-Europe session on Wednesday, spot gold hit a bottom and rebounded. Affected by the ceasefire agreement signed by Hamas in Gaza, it fell nearly 1% during the session, and then rebounded sharply. It is currently down 0.07%, and its price is stable above the historical high of US$4,000 per ounce.
Gold smells a familiar smell of sweeping here, which is in line with our expectations. According to the signal strategy given yesterday, if the price reaches 4020-4025, enter the long position and you can make a profit now.
Specifically:
The bullish momentum has not been broken. The upper double-line support on the hourly chart, along with the channel line, serves as a defensive dividing line.
This rally, which began at 3280 in August, accelerated in September and doubled in October, with a nearly $780 surge, setting a new record and reshaping market perception.
The two closest waves, one at 3720 and the other at 3820, sought support for further gains.
The upper double-line support on the hourly chart is currently between 4000 and 4010, tentatively serving as the dividing line for any shifts in momentum. Holding the upper double-line support level will ensure the overall bullish momentum remains unchanged, and any short-term pullbacks and accelerations are intended to facilitate a stronger rally.
Strategy:
Long Position4020-4030,SL:4010,Target:4060,4080
עסקה פעילה
Gaza ceasefire, Fed rate cut "fight", should we buy or sell gold now?I'm Theodore, welcome to join my channel, where you can get the latest trading signals and strategy layout.
פרסומים קשורים
כתב ויתור
המידע והפרסומים אינם אמורים להיות, ואינם מהווים, עצות פיננסיות, השקעות, מסחר או סוגים אחרים של עצות או המלצות שסופקו או מאושרים על ידי TradingView. קרא עוד בתנאים וההגבלות.
I'm Theodore, welcome to join my channel, where you can get the latest trading signals and strategy layout.
פרסומים קשורים
כתב ויתור
המידע והפרסומים אינם אמורים להיות, ואינם מהווים, עצות פיננסיות, השקעות, מסחר או סוגים אחרים של עצות או המלצות שסופקו או מאושרים על ידי TradingView. קרא עוד בתנאים וההגבלות.