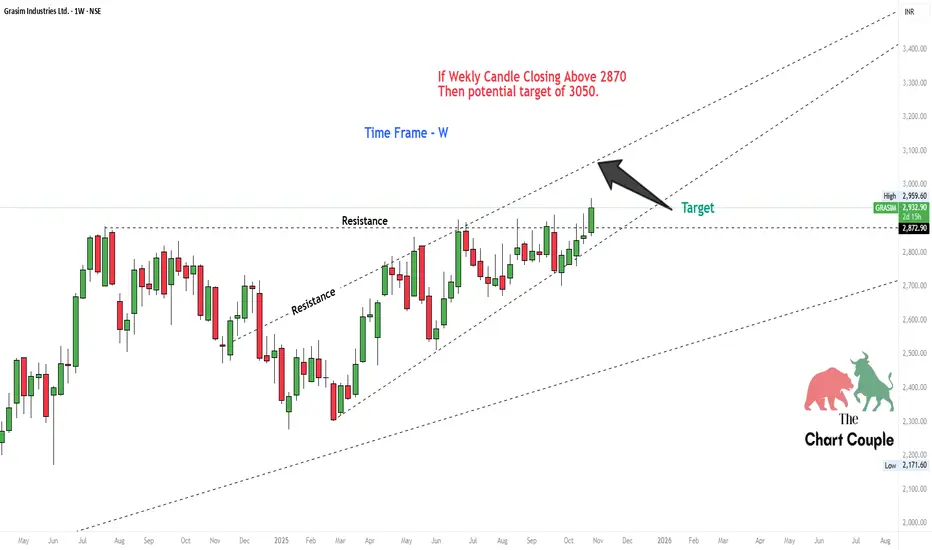
The stock is showing strong momentum within its rising channel!
📈 Key Level to Watch:
If the weekly candle closes above 2870, it could open the gates toward a potential target of 3050.
🧠 Technical View:
Price breaking past resistance zone
Volume confirmation could add strength
Trend remains bullish within channel
⚠️ Keep an eye on the weekly close — a confirmed breakout can bring solid upside momentum!
💬 What’s your view on GRASIM’s next move — breakout or pullback?
#grasim #technicalanalysis #stockmarketindia #nifty50 #priceactiontrading #thechartcouple #indianstocks #chartanalysis #stockbreakout #tradingview #swingtrading #marketanalysis
כתב ויתור
המידע והפרסומים אינם מיועדים להיות, ואינם מהווים, ייעוץ או המלצה פיננסית, השקעתית, מסחרית או מכל סוג אחר המסופקת או מאושרת על ידי TradingView. קרא עוד ב־תנאי השימוש.
כתב ויתור
המידע והפרסומים אינם מיועדים להיות, ואינם מהווים, ייעוץ או המלצה פיננסית, השקעתית, מסחרית או מכל סוג אחר המסופקת או מאושרת על ידי TradingView. קרא עוד ב־תנאי השימוש.