📊 Step 1: Price Action Analysis
Chart Summary:
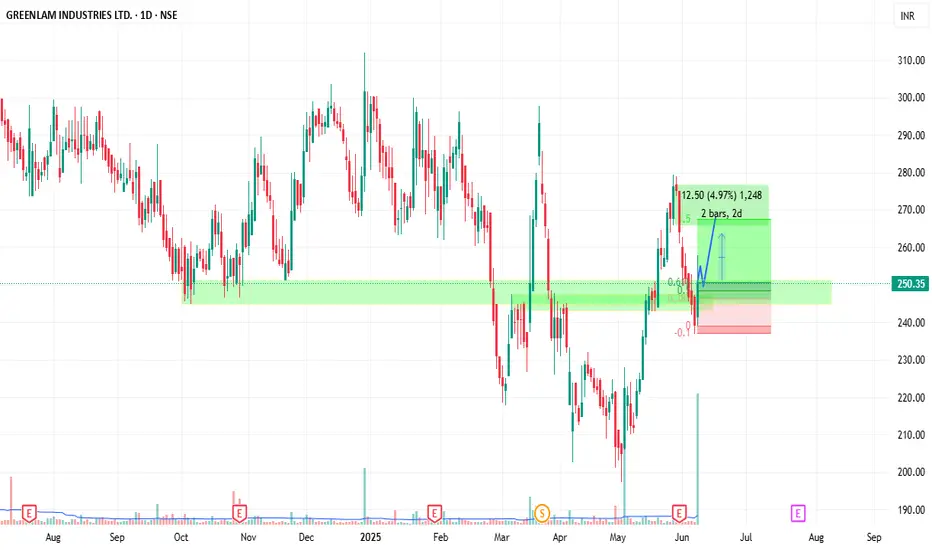
Price recently reversed from a low near ₹210 and surged toward ₹270.
A corrective pullback occurred, finding support near ₹240, which also aligns with a previous demand zone (highlighted green).
The stock is currently trading at ₹250.35 after a bounce off support, showing strength.
Candle Patterns:
Recent candles suggest bullish intent — long lower wicks and follow-through buying.
Small bullish structure forming with a potential higher low.
📈 Step 2: Volume and Momentum
Volume:
Noticeable volume spike during the uptrend in late May.
Volume during the recent pullback is lower, which is a bullish sign (healthy retracement).
Volatility:
Moderate range movement; not too aggressive — indicates stability and accumulation.
🔍 Step 3: Stage Identification
✅ Current Stage: Stage 2 – Early Accumulation to Markup
Why?
The stock completed a downtrend (Stage 4) from October 2024 to April 2025.
From May onward, it's shown clear higher highs and higher lows — a Stage 2 behavior.
Now consolidating and bouncing off a Fibonacci retracement level (0.618 zone).
Strong support established; retest done; buyers showing up.
🎯 Trade Structure (as per your chart):
Entry: Near ₹250–252
Stop-loss: Below ₹240
Target Zone: ₹262–270 (short-term), ₹280+ (medium-term)
🧠 Risk-Reward Ratio: Reasonable for swing entry
📈 Fibonacci Support: Bounce from 61.8% retracement confirms technical strength
✅ Final Strategy & Plan
Element Value
📌 Stage ✅ Stage 2 (Early markup)
📉 Support ₹240–244
📈 Resistance ₹270 (short), ₹280+ (next swing)
🎯 Target ₹262–270
❌ Stop-loss Below ₹240
🔔 Action Plan
Good for Swing Trade or Positional Entry
Add more on a breakout above ₹260 with volume
Trail SL above ₹244 once ₹260+ is sustained
Chart Summary:
Price recently reversed from a low near ₹210 and surged toward ₹270.
A corrective pullback occurred, finding support near ₹240, which also aligns with a previous demand zone (highlighted green).
The stock is currently trading at ₹250.35 after a bounce off support, showing strength.
Candle Patterns:
Recent candles suggest bullish intent — long lower wicks and follow-through buying.
Small bullish structure forming with a potential higher low.
📈 Step 2: Volume and Momentum
Volume:
Noticeable volume spike during the uptrend in late May.
Volume during the recent pullback is lower, which is a bullish sign (healthy retracement).
Volatility:
Moderate range movement; not too aggressive — indicates stability and accumulation.
🔍 Step 3: Stage Identification
✅ Current Stage: Stage 2 – Early Accumulation to Markup
Why?
The stock completed a downtrend (Stage 4) from October 2024 to April 2025.
From May onward, it's shown clear higher highs and higher lows — a Stage 2 behavior.
Now consolidating and bouncing off a Fibonacci retracement level (0.618 zone).
Strong support established; retest done; buyers showing up.
🎯 Trade Structure (as per your chart):
Entry: Near ₹250–252
Stop-loss: Below ₹240
Target Zone: ₹262–270 (short-term), ₹280+ (medium-term)
🧠 Risk-Reward Ratio: Reasonable for swing entry
📈 Fibonacci Support: Bounce from 61.8% retracement confirms technical strength
✅ Final Strategy & Plan
Element Value
📌 Stage ✅ Stage 2 (Early markup)
📉 Support ₹240–244
📈 Resistance ₹270 (short), ₹280+ (next swing)
🎯 Target ₹262–270
❌ Stop-loss Below ₹240
🔔 Action Plan
Good for Swing Trade or Positional Entry
Add more on a breakout above ₹260 with volume
Trail SL above ₹244 once ₹260+ is sustained
פרסומים קשורים
כתב ויתור
המידע והפרסומים אינם אמורים להיות, ואינם מהווים, עצות פיננסיות, השקעות, מסחר או סוגים אחרים של עצות או המלצות שסופקו או מאושרים על ידי TradingView. קרא עוד בתנאים וההגבלות.
פרסומים קשורים
כתב ויתור
המידע והפרסומים אינם אמורים להיות, ואינם מהווים, עצות פיננסיות, השקעות, מסחר או סוגים אחרים של עצות או המלצות שסופקו או מאושרים על ידי TradingView. קרא עוד בתנאים וההגבלות.