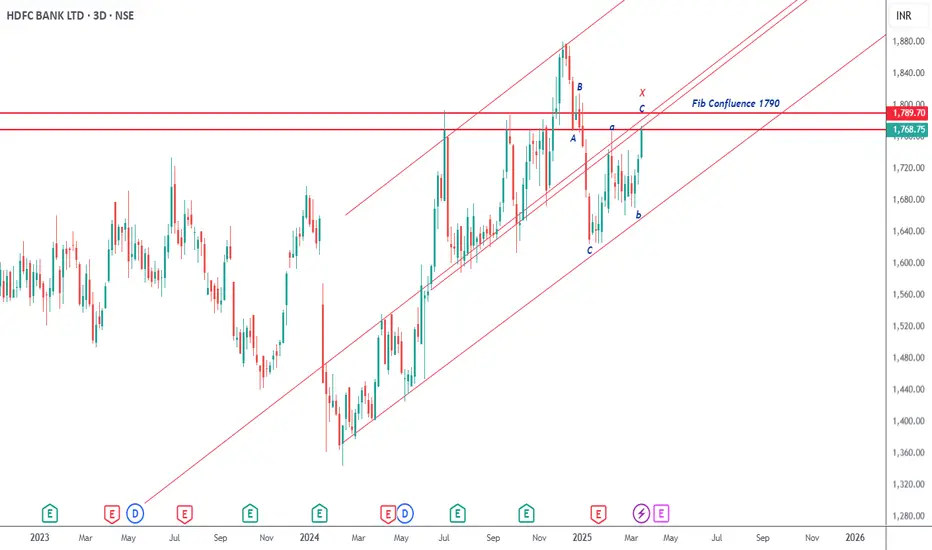
HDFC Bank CMP 1769
I had posted previously how this stock has turned negative on higher time frame charts. Now it is set on the daily charts as well.
Elliott- The first correction from the highs is a bullish zig zag. It is followed by another corrective pattern which is a bearish zig zag. Hence a fresh three wave fall ABC should begin from here.
Fibs- the current zone and the next at 1769 are both fib confluence zones and hence strong resistance.
Channel - the stock is also at channel resistance as well.
Conclusion - In my view it will break the 1600 zone this time around.
כתב ויתור
המידע והפרסומים אינם אמורים להיות, ואינם מהווים, עצות פיננסיות, השקעות, מסחר או סוגים אחרים של עצות או המלצות שסופקו או מאושרים על ידי TradingView. קרא עוד בתנאים וההגבלות.
כתב ויתור
המידע והפרסומים אינם אמורים להיות, ואינם מהווים, עצות פיננסיות, השקעות, מסחר או סוגים אחרים של עצות או המלצות שסופקו או מאושרים על ידי TradingView. קרא עוד בתנאים וההגבלות.